2306
Assessment of a long label duration in multi-delay pseudo-continuous arterial spin labelling scheme1Philips Japan, Tokyo, Japan, 2Department of Molecular Imaging & Diagnosis, Graduate School of Medical Sciences, Kyushu University, Fukuoka, Japan, 3Division of Radiological Technology, Department of Medical Technology, Kyushu University Hospital, Fukuoka, Japan, 4Department of Health Sciences, Graduate School of Medical Sciences, Kyushu University, Fukuoka, Japan, 5C.J. Gorter MRI Center, Department of Radiology, Leiden University Medical Center, Leiden, Netherlands, 6Kyoto College of Medical Science, Kyoto, Japan, 7Philips Healthcare, Best, Netherlands, 8Philips Healthcare, Tokyo, Japan
Synopsis
Keywords: Stroke, Perfusion, ASL
Motivation: Clinical usefulness of multi-delay (MD) as well as long label duration (LD) pseudo-continuous arterial spin labelling (pCASL) have been suggested. However, MD-pCASL scheme including long LD has not been established.
Goal(s): Long LD combined MD-pCASL scheme was assessed in terms of quantification. The possibility of scan acceleration was also studied.
Approach: MD-pCASL with maximum LD 3 sec for 11 (3min 13sec) and 5 delays (1min 38sec) were assessed, and compared to a scheme with maximum LD 2 sec.
Results: Reasonable quantitative values were obtained by both LD 3 sec schemes, while providing higher SNR.
Impact: The potential of a MD-ASL scheme with long label duration has been demonstrated in terms of improved SNR, reasonable quantitative parameters, and acceleration of scan time. Advantages of the scheme are especially expected for neurovascular applications.
Purpose
Arterial transit time (ATT) and cerebral blood flow (CBF) can be measured by multi-delay pseudo-continuous arterial spin labelling (MD-pCASL).1–4A few reports have suggested the usefulness of long label duration (LD) and long post label delay (PLD) ASL for applications in neurovascular disease (NVD) to guarantee reliable quantification, also for long ATTs.5–8
So far, no MD-pCASL has been proposed that combines long LD and PLD within a single scheme. In this study, maximum 3 sec LD is combined into MD-pCASL and reliability of calculated parameters is assessed. In addition, the possibility of scan acceleration by reducing the number of acquired delays is investigated.
Methods
MD-pCASL Scheme: For MD-pCASL, a sequential variable-TR scheme2,3,9 with 21 delays was used (Figure 1a). Detailed acquisition parameters are summarised in Figure 1b. The first acquisition provides a noise estimation; three schemes were retrospectively extracted from these 21 delays: 1) maximum LD 2 sec with 11 delays (MD11-LD2); 2) maximum LD 3 sec with 11 delays (MD11-LD3); 3) 5 delays extracted from MD11-LD3 (MD5-LD3). Scan time for three schemes were 2min 50sec, 3min 13sec and 1min 38sec, respectively.Magnetic Resonance Experiments: The MD-pCASL scheme was implemented on a 3.0T Ingenia Elition scanner (Philips, Best, Netherlands). The quantitative parameters derived from the three schemes were compared. Seven healthy subjects (mean age 39.7±7.0 years) were examined, and informed consent, as required by the Institutional Review Board, was obtained.
SNR, CBF and ATT Quantification: The three highest ASL signals along the time axis were selected and averaged voxel by voxel for each scheme. The SD of grey matter (GM) signal was calculated from the noise scan. The SNR was calculated by dividing the averaged ASL signal by the SD. CBF and ATT maps were created using a Buxton general kinetic model by applying a nonlinear fitting.1
Scheme Validations: All SNR, CBF and ATT maps were normalised to the Montreal Neurological Institute space template. The volumes of interest were automatically delineated using a vascular territory atlas template,10 and SNR, CBF and ATT values in the anterior cerebral artery, middle cerebral artery and posterior cerebral artery territories for both left and right hemisphere—with subdivision into proximal, middle and distal regions—were evaluated.
The averaged SNR, CBF and ATT in the GM of each region were calculated and compared among the schemes. The temporal SNR (tSNR)—the SNR divided by the square root of the scan time—was also compared.
A P-value lower than 0.01 was considered statistical significance.
Results
Representative MD-pCASL images, SNR, CBF and ATT maps, and SNR, tSNR and CBF quantitative comparisons are shown in Figure 2, 3 and 4, respectively.The SNR for MD11-LD3 was the highest of the three schemes and the SNR for MD5-LD3 was significantly higher than that of MD11-LD2. The tSNR for MD5-LD3 was the highest of the three schemes and the tSNR for MD11-LD3 was significantly higher than that of MD11-LD2.
The CBF for MD11-LD2 was the lowest of the three schemes, while there was no significant difference between MD11-LD3 and MD5-LD3.
Correlations and Bland-Altman plot analysis for ATT are shown in Figure 5. Statistically significant correlations were observed between MD11-LD2 and MD11-LD3. In addition, proportional bias was observed between these two. Statistically significant correlations, fixed bias and proportional bias were observed between MD11-LD3 and MD5-LD3.
Discussion
The finding of higher SNR and tSNR for MD11-LD3 and MD5-LD3 compared to MD11-LD2, indicates an advantage of long LD, which could be hypothesized to be even more important when applied in slow flow cases as NVD. Although significant differences in CBF were found as well as a proportional bias in ATT, the difference was minor compared to the standard deviation and high correlation of ATT-values point also to reliable quantification. The found discrepancies can be attributed to inherent sensitivity to physiological parameters, such as the number of heart beats during the label, vascular artefacts, or fitting stability.Comparing MD5-LD3 with MD11-LD3, similar CBF and strong ATT correlation were observed. Although a systematic bias in ATT was found, fixed bias -15.4 msec and limit of agreement less than +/- 67.1 msec, this can be considered clinically acceptable by considering that the time resolution of the scheme is 500 msec.
The study is limited to normal subjects and further investigations with NVD are mandatory.
Conclusion
The potential of the MD-ASL scheme with long label duration has been demonstrated in terms of improved SNR, tSNR and ability to accelerate scan time.Acknowledgements
No acknowledgement found.References
1. Guo, J. et al. Comparing accuracy and reproducibility of sequential and Hadamard-encoded multi-delay PCASL for measuring CBF and ATT in healthy subjects – a simulation and in vivo study. J. Magn. Reson. Imaging 47, 1119–1132 (2018).
2. Togao, O. et al. Assessment of cerebral perfusion in moyamoya disease with dynamic pseudo-continuous arterial spin labeling using a variable repetition time scheme with optimized background suppression. Neuroradiology 65, 529–538 (2023).
3. Johnston, M. E., Lu, K., Maldjian, J. A. & Jung, Y. Multi-TI arterial spin labeling MRI with variable TR and bolus duration for cerebral blood flow and arterial transit time mapping. IEEE Trans. Med. Imaging 34, 1392–1402 (2015).
4. Dai, W., Shankaranarayanan, A. & Alsop, D. C. Volumetric measurement of perfusion and arterial transit delay using hadamard encoded continuous arterial spin labeling. Magn. Reson. Med. 69, 1014–1022 (2013).
5. Fan, A. P. et al. Long-Delay Arterial Spin Labeling Provides More Accurate Cerebral Blood Flow Measurements in Moyamoya Patients: A Simultaneous Positron Emission Tomography/MRI Study. Stroke 48, 2441–2449 (2017).
6. Amemiya, S. et al. Arterial Transit Time-Based Multidelay Combination Strategy Improves Arterial Spin Labeling Cerebral Blood Flow Measurement Accuracy in Severe Steno-Occlusive Diseases. J. Magn. Reson. Imaging 55, 178–187 (2022).
7. Ishida, S. et al. Robust arterial transit time and cerebral blood flow estimation using combined acquisition of Hadamard-encoded multi-delay and long-labeled long-delay pseudo-continuous arterial spin labeling: a simulation and in vivo study. NMR Biomed. 33, 1–12 (2020).
8. Lin, T. et al. Test-retest reliability and reproducibility of long-label pseudo-continuous arterial spin labeling. Magn. Reson. Imaging 73, 111–117 (2020).
9. Makoto Obara, Osamu Togao, Tatsuhiro Wada, Chiaki Tokunaga, Ryoji Mikayama, Hiroshi Hamano, Kim van de Ven, Masami Yoneyama, Tetsuo Ogino, Yuta Akamine, Yu Ueda, Jihun Kwon, M. V. C. ISMRM2021_0870_vTR_Obara.pdf. in Proc. Intl. Soc. Mag. Reson. Med. 29 870 (2021).
10. Mutsaerts, H. J. M. M. et al. Cerebral perfusion measurements in elderly with hypertension using arterial spin labeling. PLoS One 10, 1–13 (2015).
Figures
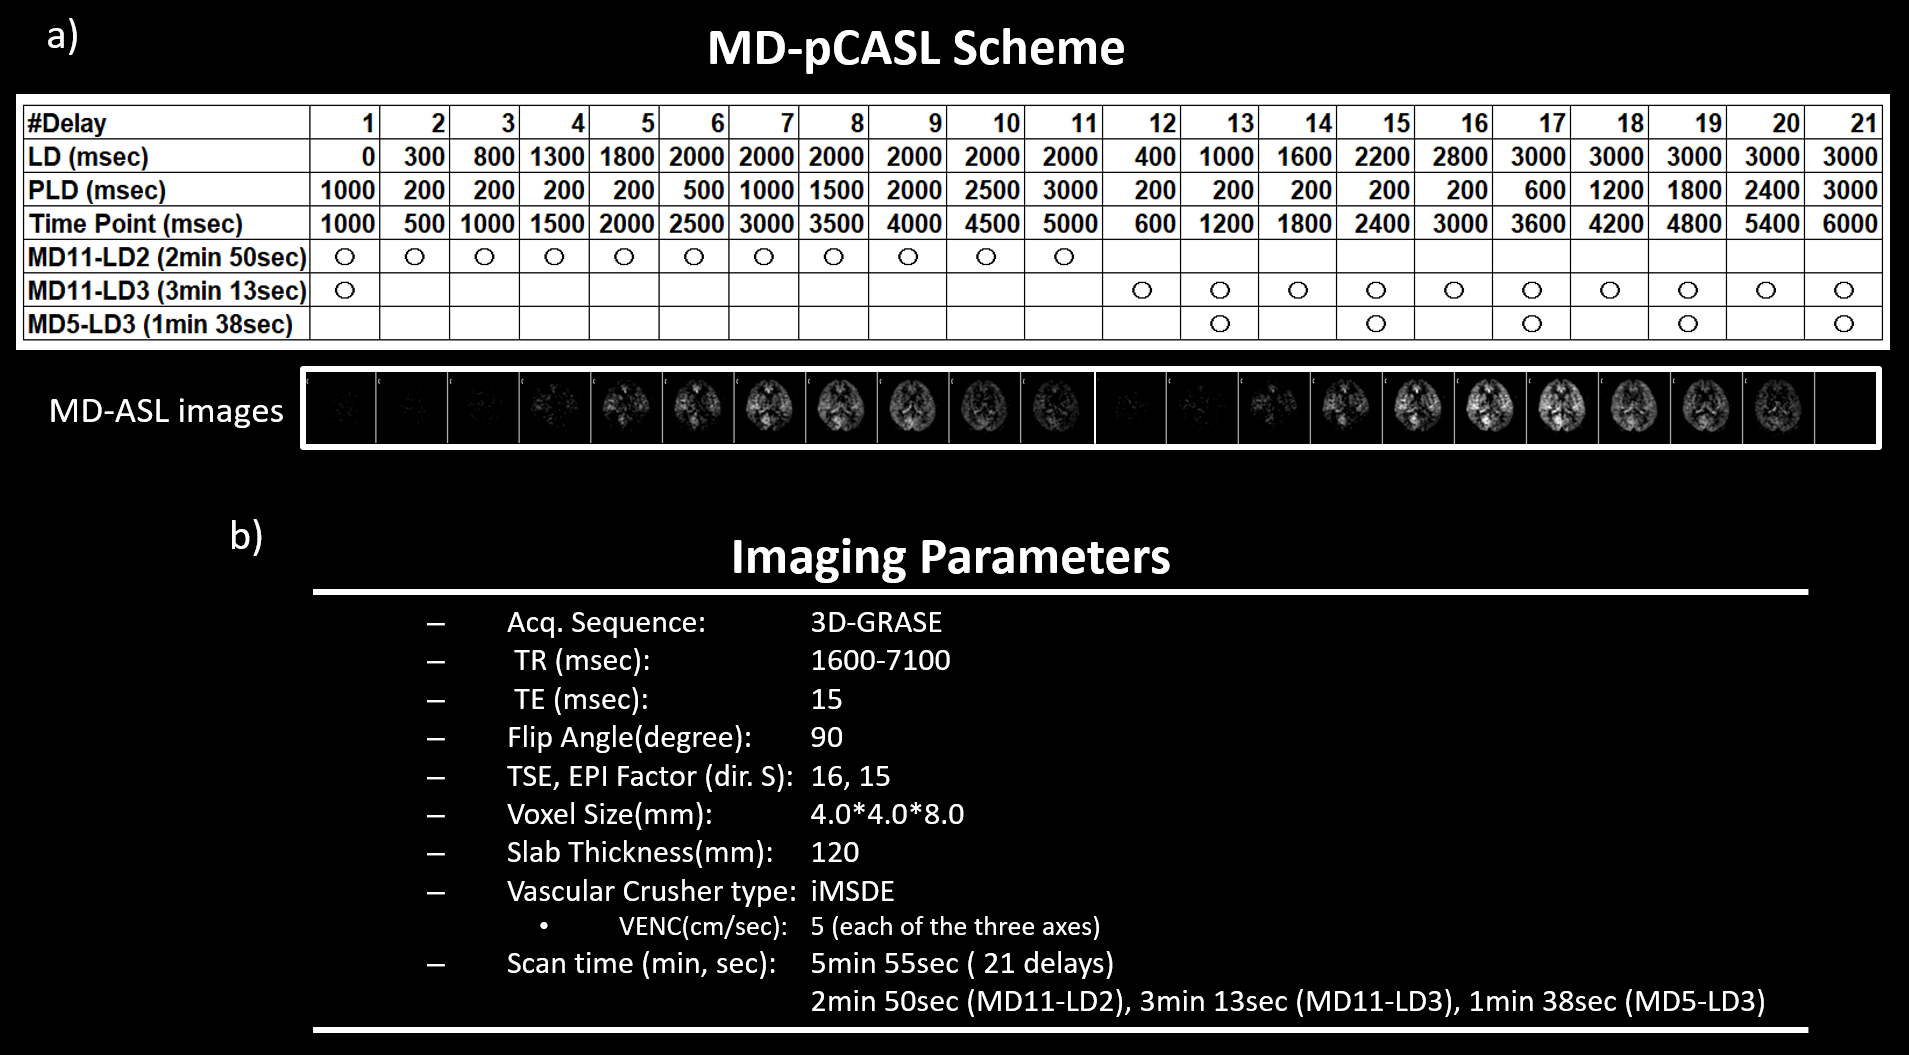
Figure 1: MD-pCASL scheme and acquisition parameters
a) Total 21 delays MD-pCASL scheme including MD11-LD2, MD11-LD3 and MD5-LD3 acquisitions. pCASL images from 21 delays are displayed. b) Acquisition parameters.
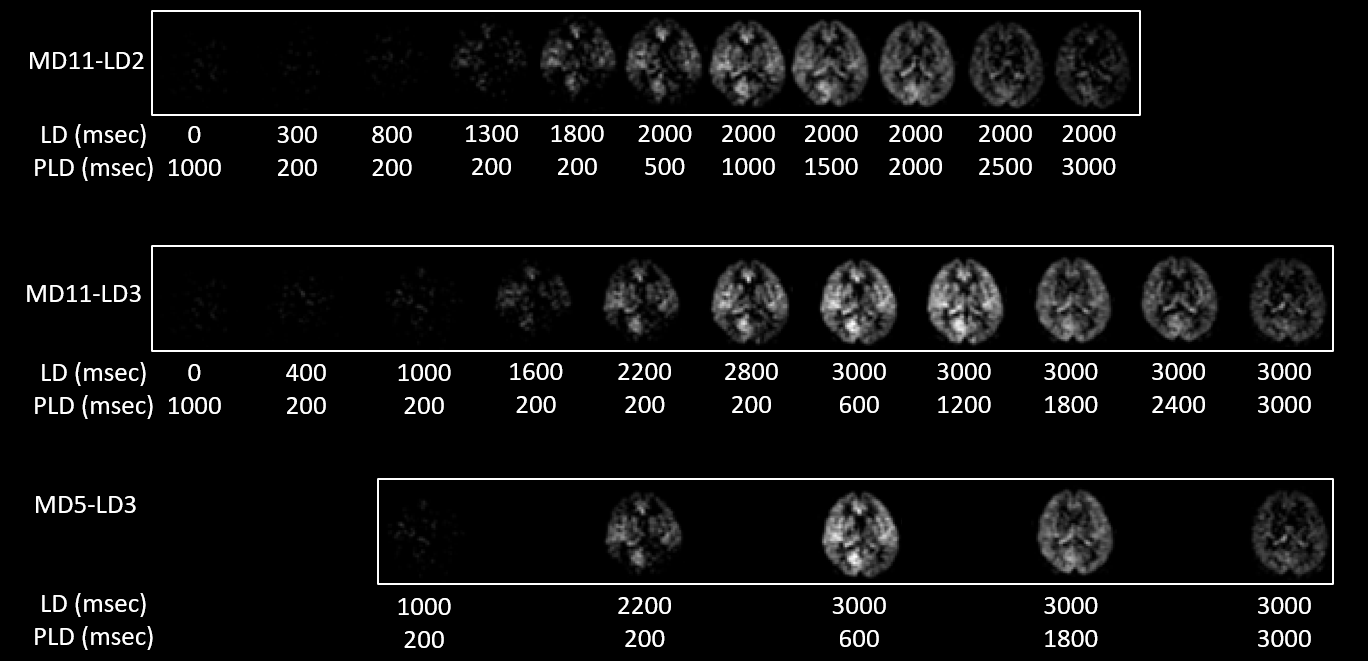
Figure 2: pCASL images comparisons
Representative MD-pCASL images are shown for each scheme.
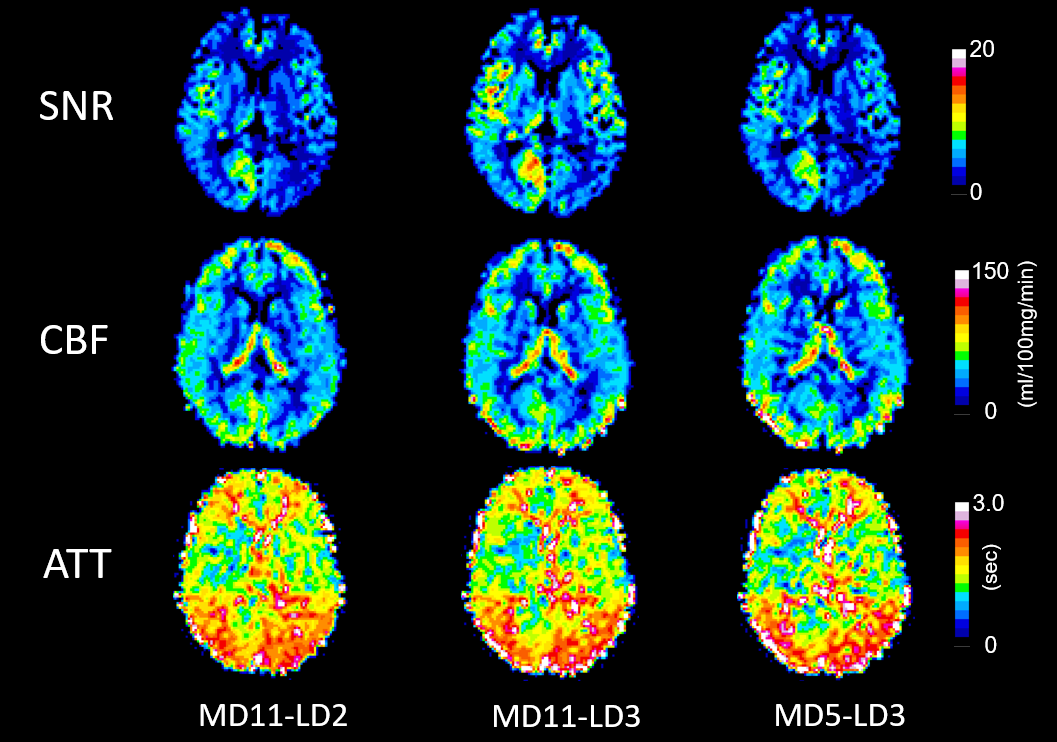
Figure 3: SNR, CBF and ATT maps
Representative SNR, CBF and ATT maps measured using the three different schemes.
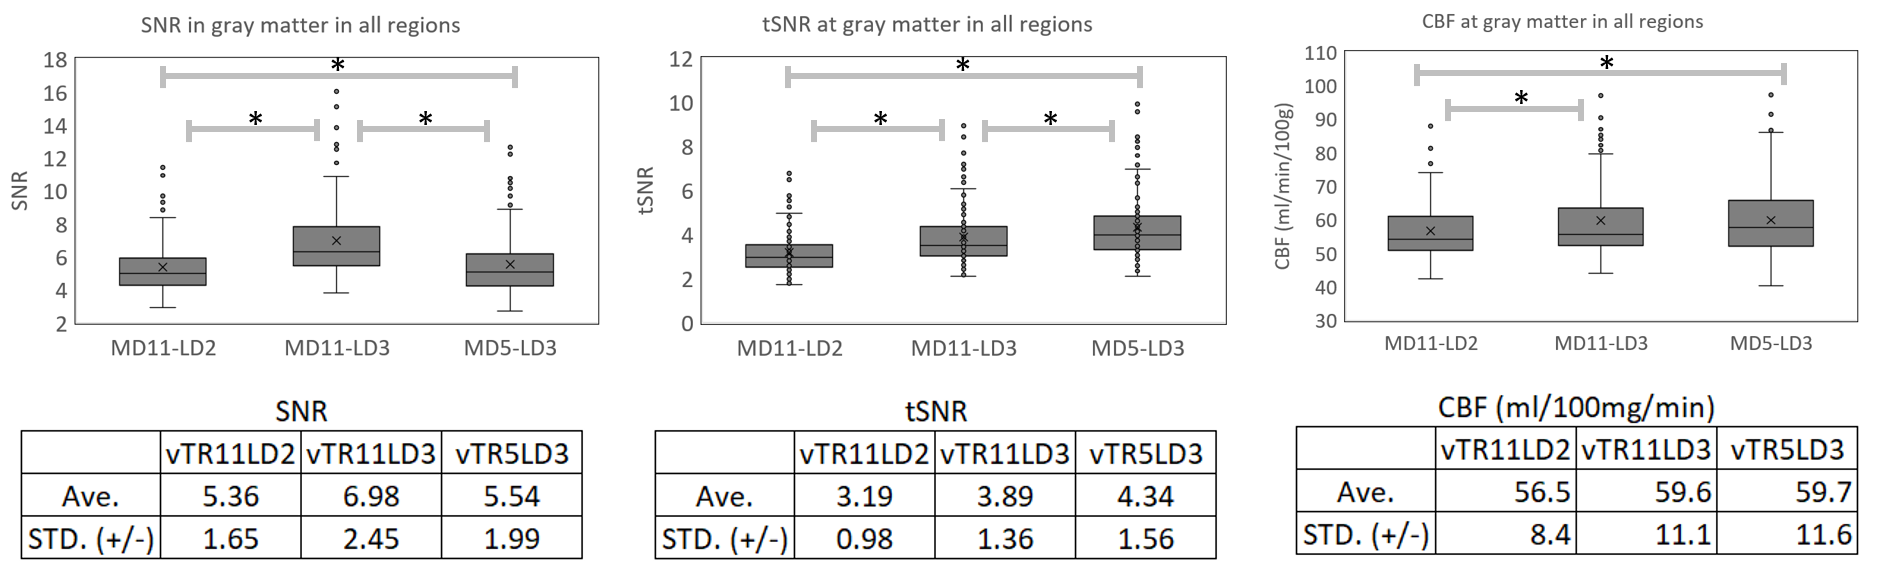
Figure 4: SNR, tSNR and CBF comparisons
Comparisons of averaged SNR, temporal SNR (tSNR) and CBF in gray matter of flow territory regions between the schemes. An asterisk (*) represents p < 0.01.
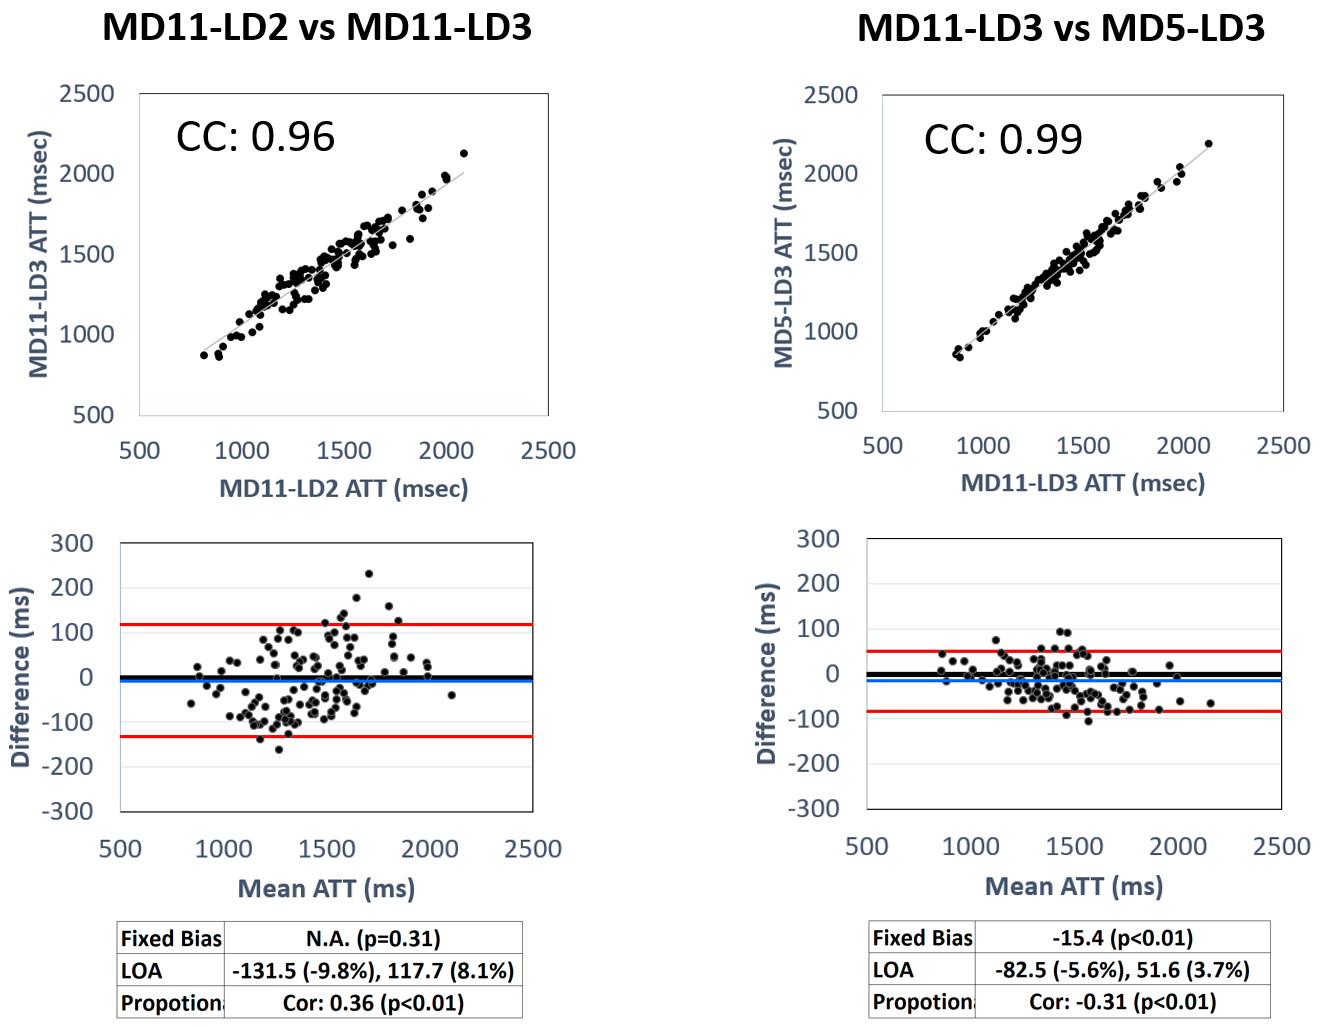
Figure 5: Correlation graph and Bland-Altman plot of ATT
Correlation graph and Bland-Altman plot between MD11-LD2 and MD11-LD3, and MD11-LD3 and MD5-LD3. Correlation Coefficients (CC), fixed bias and 95% limits of agreement (LOA) as well as proportional bias (CC) are calculated.