2296
Measuring blood flow in stroke using Quantitative Transport Mapping Network (QTMnet)1Biomedical Engineering, Cornell University, Ithaca, NY, United States, 2Weill Cornell Medical College, New York, NY, United States, 3Mechanical Engineering, Cornell University, Ithaca, NY, United States, 4Radiology, Tongji Hospital, Tongji Medical College, Wuhan, China, 5Huazhong University of Science and Technology, Wuhan, China
Synopsis
Keywords: Stroke, Perfusion, Stroke, DSC MRI, Ischemia, Blood Flow Quantification, Deep Learning
Motivation: To assess the ability of quantitative transport mapping (QTM) to estimate blood flow in stroke from DSC MRI through a deep learning model.
Goal(s): To use an automated deep learning based method to measure blood flow in stroke using DSC MRI.
Approach: A deep learning network (QTMnet) is trained on synthetic MR data generated using realistic vascular models to learn the mapping between DSC MR data and underlying tissue blood flow.
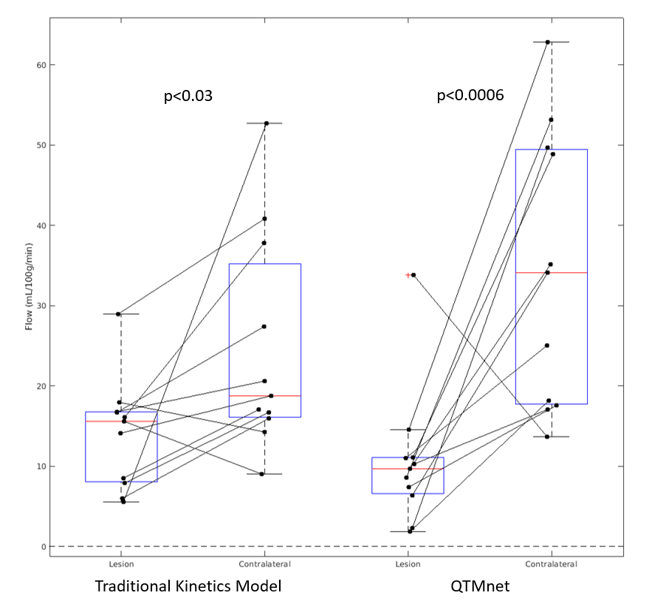
Results: QTMnet demonstrates decreased perfusion in ischemic lesion compared to contralateral healthy tissue (p=0.0006), similar to results using traditional modeling. QTMnet performed well without needing to select an appropriate AIF or regularization.
Impact: QTMnet may identify hypoperfused tissue following stroke in an automated manner. Accurate blood flow estimation may assist in determining whether reperfusion therapy is beneficial.
Background
Dynamic Susceptibility Contrast (DSC) MRI is used to quantify perfusion in stroke and is part of the perfusion-diffusion mismatch approach to assess the risk of progressive ischemic stroke by determining the non-core hypoperfused area whose size may indicate whether reperfusion therapy will be beneficial1. Traditional perfusion analysis relies on the selection of a global input function (AIF) which ignores the spatial aspect of flow and is therefore susceptible to delay, dispersion, and dilution effects as the bolus travels through the brain vasculature. Global AIF selection, both manual and automatic, can lead to large variations in blood flow estimation2. Quantitative transport mapping (QTM), a biophysical modeling approach to tracer kinetics, and its deep learning extension, QTMnet3, have been developed to eliminate the use of a global AIF. QTM has been shown to outperform traditional tracer kinetics models in simulations and phantoms where ground truth is available and in classification tasks4,5,6,7,8. Here, we apply QTM to DSC MRI, particularly for blood flow quantification. We show that QTMnet demonstrates decreased perfusion in ischemic lesions without needing to select a global AIF or tuning regularization as is required for the traditional kinetics model.Methods
Following stroke, 11 patients underwent DSC MRI (1.9x1.9x6.5 mm3 resolution, 1.5 s time resolution, TE=19 ms, TR=15 ms) and DWI MRI (0.94 mm in-plane resolution, 6.5 mm slice resolution, 3 s time resolution, TE=70.9 ms, TR=3 s, b-values of 0 and 1000) on a 3T GE Discovery. Post-processing included skull stripping, resampling to 1mm3 isotropic resolution, and co-registration of DWI to DSC and was performed using FSL9. Contrast agent concentration was assumed to be given by:$$C_t = -log(\frac{S_t}{S_0})$$ where $$$S_t$$$ was the DCE MRI image at time $$$t$$$. ADC maps were computed from the DWI data.
In QTMnet, a Unet is trained to map the concentration images to the underlying blood flow. The training data consisted of synthetic data generated as follows. Anatomically inspired synthetic vasculature with an approximate capillary network in 32x32x32mm3 cubes was generated using the constrained constructive optimization (CCO) algorithm10 based on synthetically generated 3D maps of piecewise constant blood flow, $$$F$$$, and cerebral blood volume, $$$V_p$$$, and a local tracer boundary condition given by a randomly generated gamma variate with second pass characteristics equation11. Computational flow modeling is used to generate the simulated concentration profile of tracer through the vasculature, as well as perfusion into the tissue structure. These training data aim to provide a realistic depiction of tracer transport in the discrete domain. We implemented a standard Unet design12 with 45 temporal input channels and 16 layers. We generated 420 32x32x32 mm3 cubes with an 80/20 training/validation split and trained for 500 epochs using the SGD optimizer (learning rate = 0.001, momentum = 0.9) with $$$L_1$$$ loss.
Traditional perfusion analysis was done by solving a one-compartment tracer kinetic model: $$V_p\partial_t C_p (t)=F(C_a (t)-C_p (t))$$ Lesions and contralateral healthy tissue were segmented based on the DWI and ADC maps. A two-sample t-test was performed to determine differences in perfusion parameters between these two regions.
Results
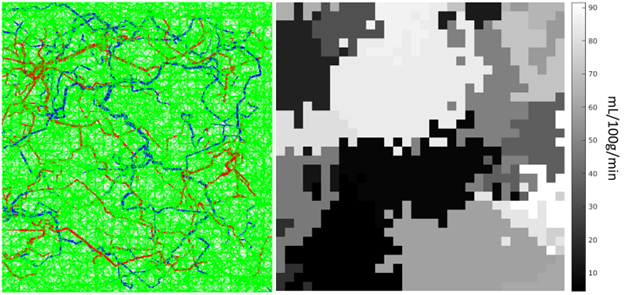
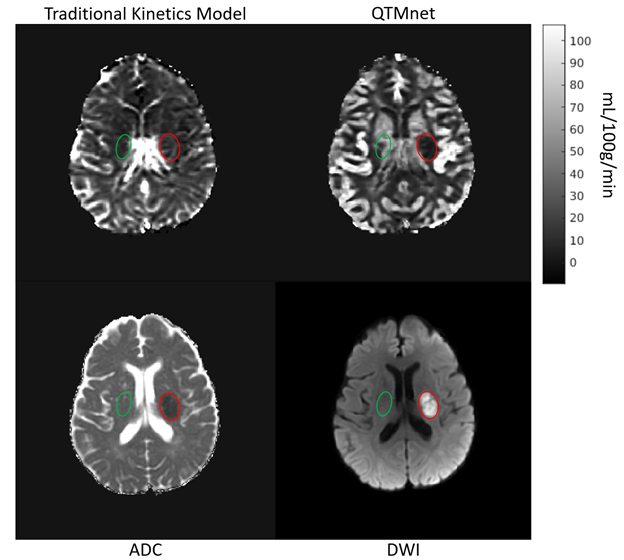
Figure 1 shows the synthetic vasculature generated using the CCO algorithm for a single 32x32x32 mm3 training cube, as well as the corresponding flow map for a given slice. Figure 2 show the flow maps for one patient, with QTMnet better defining the hypoperfusion in the lesion compared to the contralateral healthy tissue compared to the traditional method. This is reflected across subjects, as seen in Figure 3. Both QTMnet and the traditional perfusion analysis showed a decrease in flow in the stroke lesion compared to healthy tissue, p<0.0006 and p<0.03, respectively.Discussion
This study shows the feasibility of using QTMnet for measuring the difference in blood flow in a stroke lesion versus contralateral healthy tissue. While the traditional model performed similarly to QTMnet, the traditional model required careful AIF selection for each patient as well as regularization tuning, for the model to output a reasonable result given the noisy data. For the patient with higher flow in the lesion compared to contralateral healthy for QTMnet, it was discovered that a vessel nearby the lesion may be contributing to signal within the lesion ROI. The traditional kinetics model also estimated higher flow in the lesion for this patient, as well as for an additional patient where QTMnet correctly estimated lower flow in the lesion. Plans for future work include expanding QTMnet to the two-compartment exchange model, which will allow for estimation of permeability with the aim of predicting hemorrhagic transformation risk following stroke13.Acknowledgements
This work was funded by the NIH 1 R01 EB034755-01 and NIH 1 R01 AG080011-01A1.References
- Hsu, C. Y., Cheng, C. Y., Tsai, Y. H., Lee, J. D., Yang, J. T., Weng, H. H., Lin, L. C., Huang, Y. C., Lee, M., Lee, M. H., Wu, C. Y., Lin, Y. H., Hsu, H. L., Yang, H. T., Pan, Y. T., & Huang, Y. C. (2015). Perfusion-diffusion Mismatch Predicts Early Neurological Deterioration in Anterior Circulation Infarction without Thrombolysis. Current neurovascular research, 12(3), 277–282. https://doi.org/10.2174/1567202612666150605122536
- Calamante, F. (2013). Arterial input function in perfusion MRI: A comprehensive review. Progress in Nuclear Magnetic Resonance Spectroscopy, 74, 1-32. https://doi.org/10.1016/j.pnmrs.2013.04.002
- Zhang, Q. Estimating perfusion and vascular properties from medical images: Quantitative transport mapping (QTM) [Ph.D.]. United States – New York: Cornell University; 2023. 104p
- Zhou, L., Zhang, Q., Spincemaille, P., Nguyen, T. D., Morgan, J., Dai, W., Li, Y., Gupta, A., Prince, M. R., & Wang, Y. (2021). Quantitative transport mapping (QTM) of the kidney with an approximate microvascular network. Magnetic resonance in medicine, 85(4), 2247–2262. https://doi.org/10.1002/mrm.28584
- Huang, W., Zhang, Q., Wu, G., Chen, P.P., Li, J., Gillen, K.M., Spincemaille, P., Chiang, G.C., Gupta, A., Wang, Y., & Chen, F. (2021). DCE-MRI quantitative transport mapping for noninvasively detecting hypoxia inducible factor-1α, epidermal growth factor receptor overexpression, and Ki-67 in nasopharyngeal carcinoma patients. Radiotherapy and Oncology, 164, 146-154. https://doi.org/10.1016/j.radonc.2021.09.016
- Zhang, Q., Spincemaille, P., Drotman, M., Chen, C., Eskreis-Winkler, S., Huang, W., Zhou, L., Morgan, J., Nguyen, T. D., Prince, M. R., & Wang, Y. (2022). Quantitative transport mapping (QTM) for differentiating benign and malignant breast lesion: Comparison with traditional kinetics modeling and semi-quantitative enhancement curve characteristics. Magnetic resonance imaging, 86, 86–93. https://doi.org/10.1016/j.mri.2021.10.039
- Zhang, Q., Luo, X., Zhou, L., Nguyen, T., Prince, M., Spincemaille, P., & Wang, Y. (2023) Fluid mechanics approach to perfusion quantification: Vasculature computational fluid dynamics simulation, quantitative transport mapping (QTM) analysis of dynamics contrast enhanced MRI, and application in nonalcoholic fatty liver disease classification. IEEE Transactions on Biomedical Engineering, 70(3), 980-990. https://doi.org/10.1109/TBME.2022.3207057
- Zhang, Q., Lee, K. S., Talenfeld, A. D., Spincemaille, P., Prince, M. R., & Wang, Y. (2022). Prediction of Lung Shunt Fraction for Yttrium-90 Treatment of Hepatic Tumors Using Dynamic Contrast Enhanced MRI with Quantitative Perfusion Processing. Tomography (Ann Arbor, Mich.), 8(6), 2687–2697. https://doi.org/10.3390/tomography8060224
- Jenkinson, M. and Smith, S. M. A Global Optimisation Method for Robust Affine Registration of Brain Images. Medical Image Analysis, 5(2), 143-156, 2001.
- Karch, R., Neumann, F., Neumann, M., & Schreiner, W. (1999). A three-dimensional model for arterial tree representation, generated by constrained constructive optimization. Computers in biology and medicine, 29(1), 19–38. https://doi.org/10.1016/s0010-4825(98)00045-6
- Patil, V., & Johnson, G. (2011). An improved model for describing the contrast bolus in perfusion MRI. Medical physics, 38(12), 6380–6383. https://doi.org/10.1118/1.3658570
- Ronneberger, O., Fischer, P., & Brox, T. (2015). U-net: Convolutional networks for biomedical image segmentation. https://doi.org/10.48550/arXiv.1505.04597
- Lin, K., Kazmi, K.S., Law, M., Babb, J., Peccerelli, N., & Pramanik, B.K. (2007). Measuring elevated microvascular permeability and predicting hemorrhagic transformation in acute ischemic stroke using first-pass dynamic perfusion ct imaging. American Journal of Neuroradiology, 28(7), 1292-1298.
Figures