2294
Feasibility of high-resolution deep learning reconstruction synthetic T2 maps contrast images in diagnosis of joint degeneration1Wuhan University, wuhan, China, 2GE MR, beijing, China
Synopsis
Keywords: Cartilage, Quantitative Imaging
Motivation: Combing T2 mapping with routine knee MRI increase diagnostic efficacy especially early identification of joint degeneration.
Goal(s): To explore the feasibility of high-resolution deep-learning reconstruction (DLR) synthetic MRI with equivalent to higher diagnosis performance using conventional routine knee MRI as reference.
Approach: To test reliability of T2 mapping for in vitro phantom and in vivo human knees and explore the image quality of DLR synthetic contrast MR images in comparison with conventional MR images.
Results: DLR synthetic MRI offer reliable T2 mapping and provide sufficient image quality for diagnosis of knee.
Impact: There has been always a demand for high-resolution knee MRI acquisition and straightforward diagnosis in clinics. DLR synthetic MRI is a rapid-acquisition and high-image-quality contrast images and quantitative maps and may improves diagnosis, prognosis and follow-ups.
Introduction
The population suffering from knee osteoarthritis (KOA) is growing and the lack of early biomarkers and therapeutics prompts the need of imaging methods. In clinical practices, adding a T2 mapping sequence to a routine MRI knee protocol has been shown that the detection of cartilage lesions, especially in the identification of early cartilage degeneration, significantly increases [1]. Due to insufficient image quality and spatial resolution, a multi-echo spin-echo (MESE) sequence (e.g., MAGnetic resonance image Compilation, MAGiC) is only used to estimate quantitative T1, T2 relaxation time and PD values rather than make diagnosis using synthetic contrast images, especially in T1 or STIR images [2,3]. This study aimed to : (1) evaluate the effect of DLR on the quantitative measurements for synthetic knee MRI using different acceleration factors; (2) Feasibility of rapid DLR synthetic MRI for qualitative and quantitative assessment of cartilage injuries in asymptomatic and mild knee OA.Materials and methods
This prospective study recruited 20 volunteers and 60 patients suspected of OA from May 2023 to October 2023. The experiments in this study were divided into two parts. In the first part, the reproducibility of the quantitative measurements for knee cartilage in 20 healthy volunteers and self-prepared phantom using DLR or non-DLR techniques and different acceleration factors for parallel imaging (PI) (SyMRIPI=1,SyMRIPI=1-DL, SyMRIPI=2, and SyMRIPI=2-DL). The sealed tubes were filled with specific concentrations of aqueous CuSO4 (anhydrous copper sulfate; 97.5% purity). A multi-echo fast-spin-echo (MESE) sequence was used as the reference T2 value. In the second part, synthetic PD-,T1 and STIR-weighted images (syPDWI, syT1WI,sySTIR) were evaluated separately using a 5-point Likert scale. Semi-quantitative assessment of structural lesions using MOAKS, which assesses radiological features that may be involved in the pathophysiology of OA from a whole-joint perspective[4]. Classification of subjects based on MOAKS was carried out, independent of their radiologic OA and clinical status. The quantitative values were compared using the paired t test. The percentage difference (DIFF) was calculated[5]. The intraclass correlation coefficient (ICC) was computed to evaluate intra-observer and inter-observer agreements, respectively. Linear regression analysis and Bland-Altman analysis were performed.Results
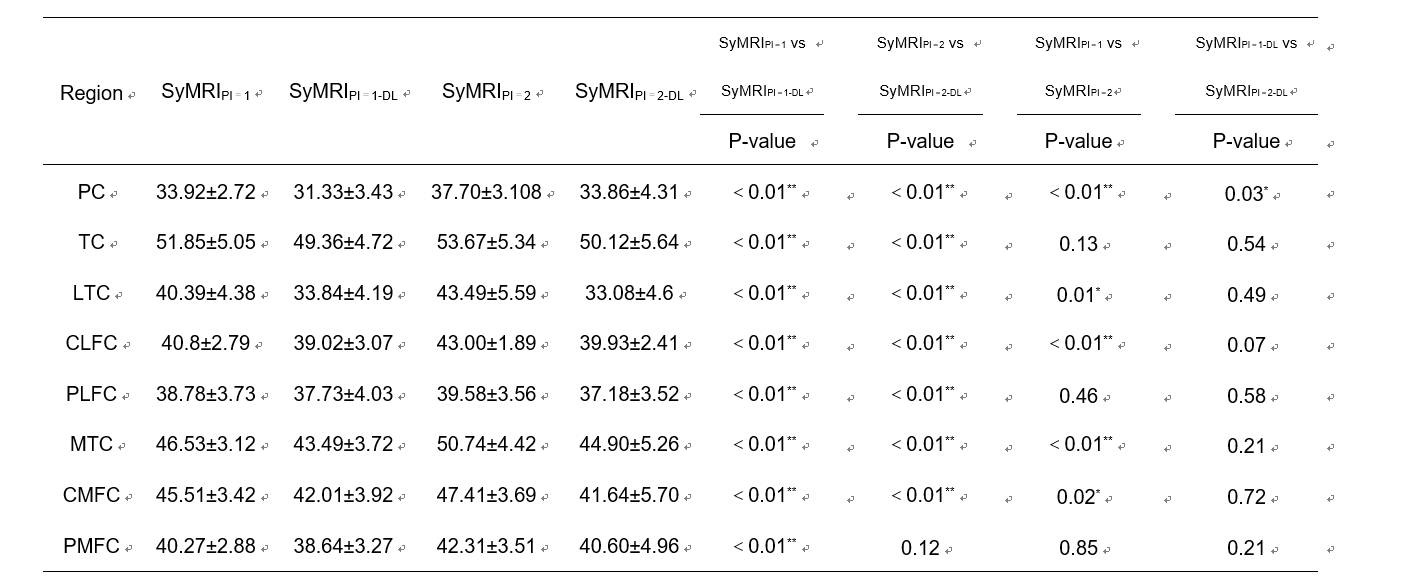
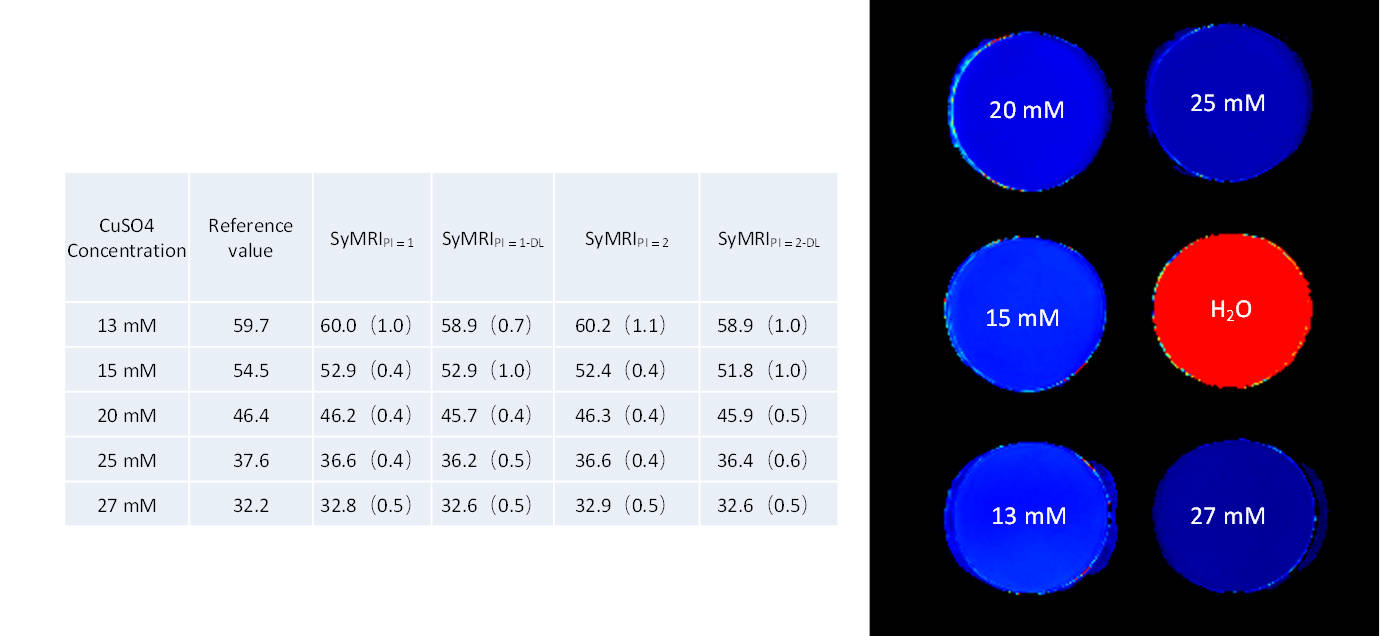
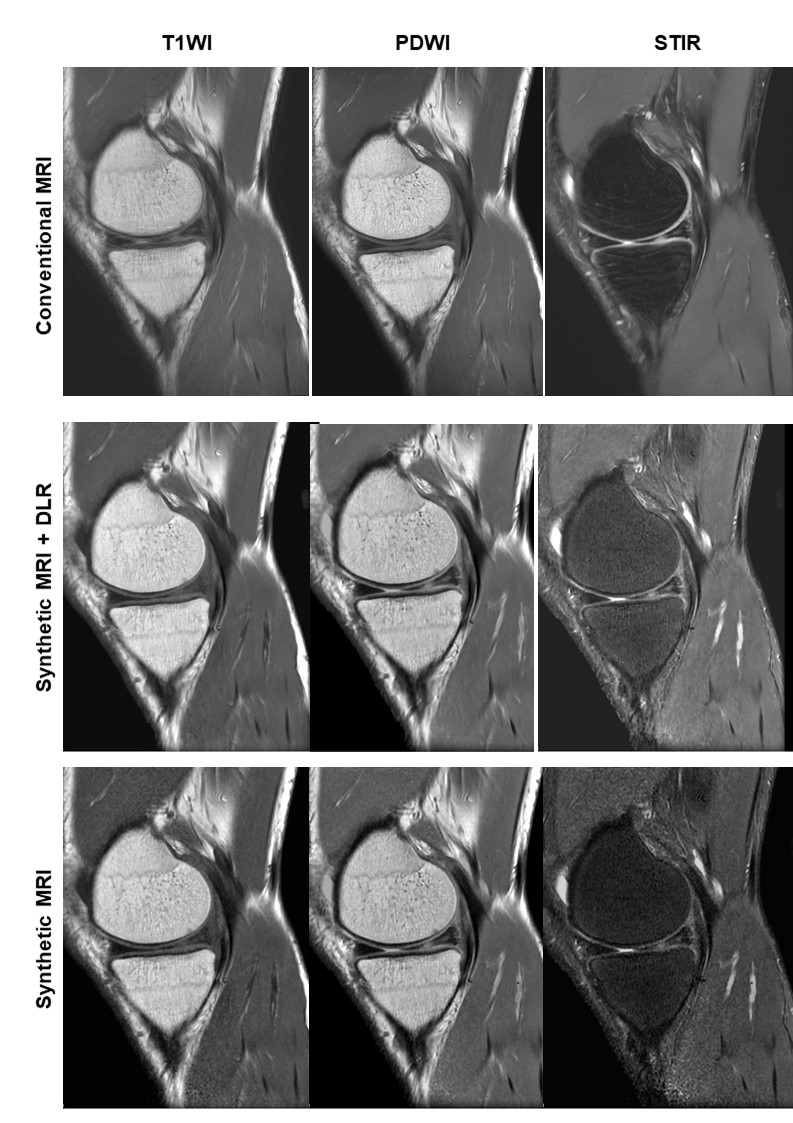
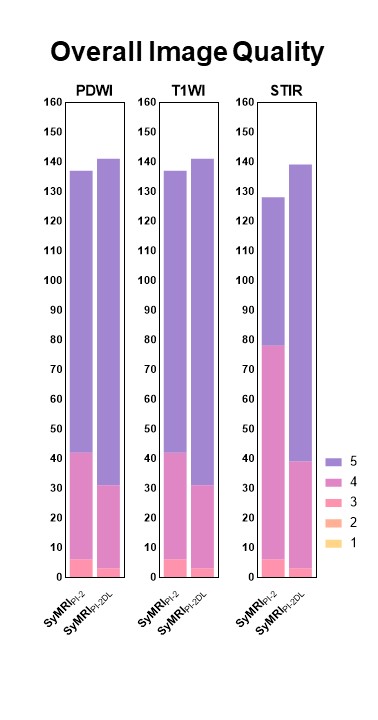
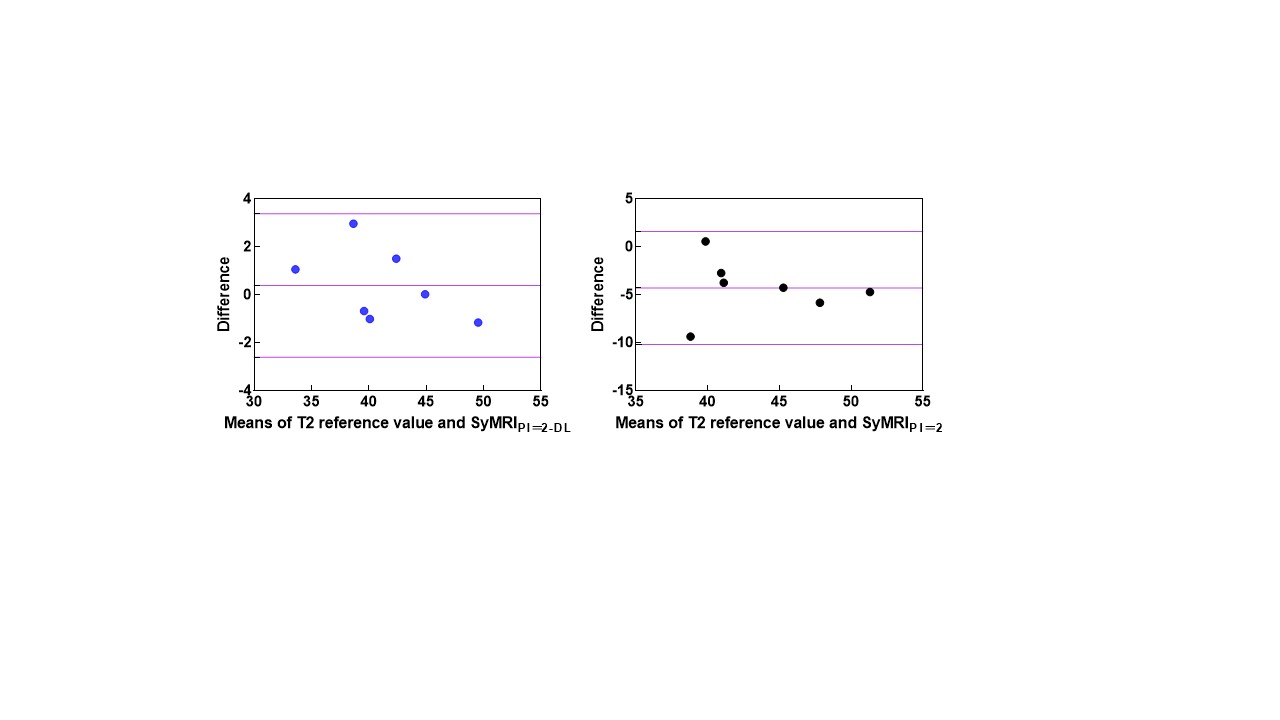
In vitro T2 quantitative values using acceleration factors of 1 and 2 were not significant different between DLR or non-DLR synthetic MRIs (P>.05), and were close to the reference T2 values (mean DIFFs =0.8%–2.1%)(Figure 1). There were significant differences in T2 values of in vivo knee cartilage acquired by synthetic MRI using DLR or non-DLR at the same acceleration factor (SyMRIPI=1 and SyMRIPI=1-DL, P<.001; SyMRIPI=2 and SyMRIPI=2-DL, P<.001, and linear regression analysis showed a strong linear relationship with a robust fit (R2 =0.94–0.998). T2 values of in vivo knee cartilage were significantly differences between SyMRIPI=1 and SyMRIPI=2 (P<.001) but no significantly differences between SyMRIPI=1-DL and SyMRIPI=2-DL (mean DIFF=0.8%–2.3%, P>.05) (Table 1). The differences in T2 values of SyMRIPI=2-DL and conventional ones were very small or negligible (Figure 4). The use of deep learning–based reconstruction in the synthetic scans significantly improved image quality for all contrast weighted images (P<.001) (Figure 2). Inter-reader agreement on MOAKS using SyMRIPI=2-DL was substantial with high PPA/NPA values of 88%/90%. Significantly higher T1、T2 and PD values were found in knee cartilage of subjects with MOAKS full-thickness cartilage loss (P < 0.05). Statistically better image quality of DLR-synthetic contrast MRI (PDWI, T1WI, STIR-T2) was found compared to no DLR images(Figure 3).Discussion and conclusion
In vitro T2 values showed no difference between synthetic MRI using DLR or noDLR at any acceleration factor but statistically different T2 values of in vivo knee cartilage between synthetic MRIs using DLR or noDLR at the same acceleration factor. This attributed to fewer smaller TE values in synthetic MRI setting in association with in vivo hyaline cartilage (e.g., conductivity and permittivity). For T2 measurements by both readers, in vivo T2 values were significantly higher in synthetic T2 maps compared to conventional ones, in agreement with previous studies. A joint of deep learning reconstruction and parallel imaging may mitigate negative impact and also improve the visibility of anatomic structures on contrast weighted images for removal of unnecessary high-frequency k-space information (e.g. noise) and further improve image sharpness[6] and more stable quantitative values. The statistical difference of T2 values in patella cartilage between SyMRIPI=1-DL and SyMRIPI=2-DL might attribute to field susceptibility, magic angle effect, partial volume effect caused by the interface between cartilage and synovial fluid, and other factors. Overall, we demonstrated that DLR -based reconstructed SyMRI with acceleration factor of 2 had great potential in clinical knee application.Acknowledgements
No acknowledgement found.References
[1] Kijowski R, Blankenbaker D G, Munoz del Rio A, et al. Evaluation of the Articular Cartilage of the Knee Joint: Value of Adding a T2 Mapping Sequence to a Routine MR Imaging Protocol[J]. Radiology, 2013, 267(2): 503–513. [2] Colotti R, Omoumi P, Bonanno G, et al. Isotropic three-dimensionalT2mapping of knee cartilage: Development and validation[J]. Journal of Magnetic Resonance Imaging, 2018, 47(2): 362–371. [3] Roux M, Hilbert T, Hussami M, et al. MRI T2 Mapping of the Knee Providing Synthetic Morphologic Images: Comparison to Conventional Turbo Spin-Echo MRI[J]. Radiology, 2019, 293(3): 620–630. [4] Hunter D J, Guermazi A, Lo G H, et al. Evolution of semi-quantitative whole joint assessment of knee OA: MOAKS (MRI Osteoarthritis Knee Score)[J]. Osteoarthritis and Cartilage, 2011, 19(8): 990–1002. [5] Lee S M, Kim E, You S K, et al. Clinical adaptation of synthetic MRI-based whole brain volume segmentation in children at 3 T: comparison with modified SPM segmentation methods[J]. Neuroradiology, 2022, 64(2): 381–392. [6] Lebel R M. Performance characterization of a novel deep learning-based MR image reconstruction pipeline[J]. arXiv, 2020.Figures