2293
MULTI-parametric MR imaging of the sacroiliac joints in patients with axial spondyloarthritis1Peking University Third Hospital, Beijing, China, 2Imaging Research Institute of Intelligent Imaging, Beijing, China
Synopsis
Keywords: Cartilage, Inflammation
Motivation: Cartilage abnormalities of the sacroiliac joints (SIJs) in spondyloarthritis(SpA) manifest as degeneration, fragmentation and erosions, fibrosis, and ossification.
Goal(s): To test whether MULTIPLEX(MTP) sequence of the sacroiliac joints (SIJs) might help identifying patients with SpA.
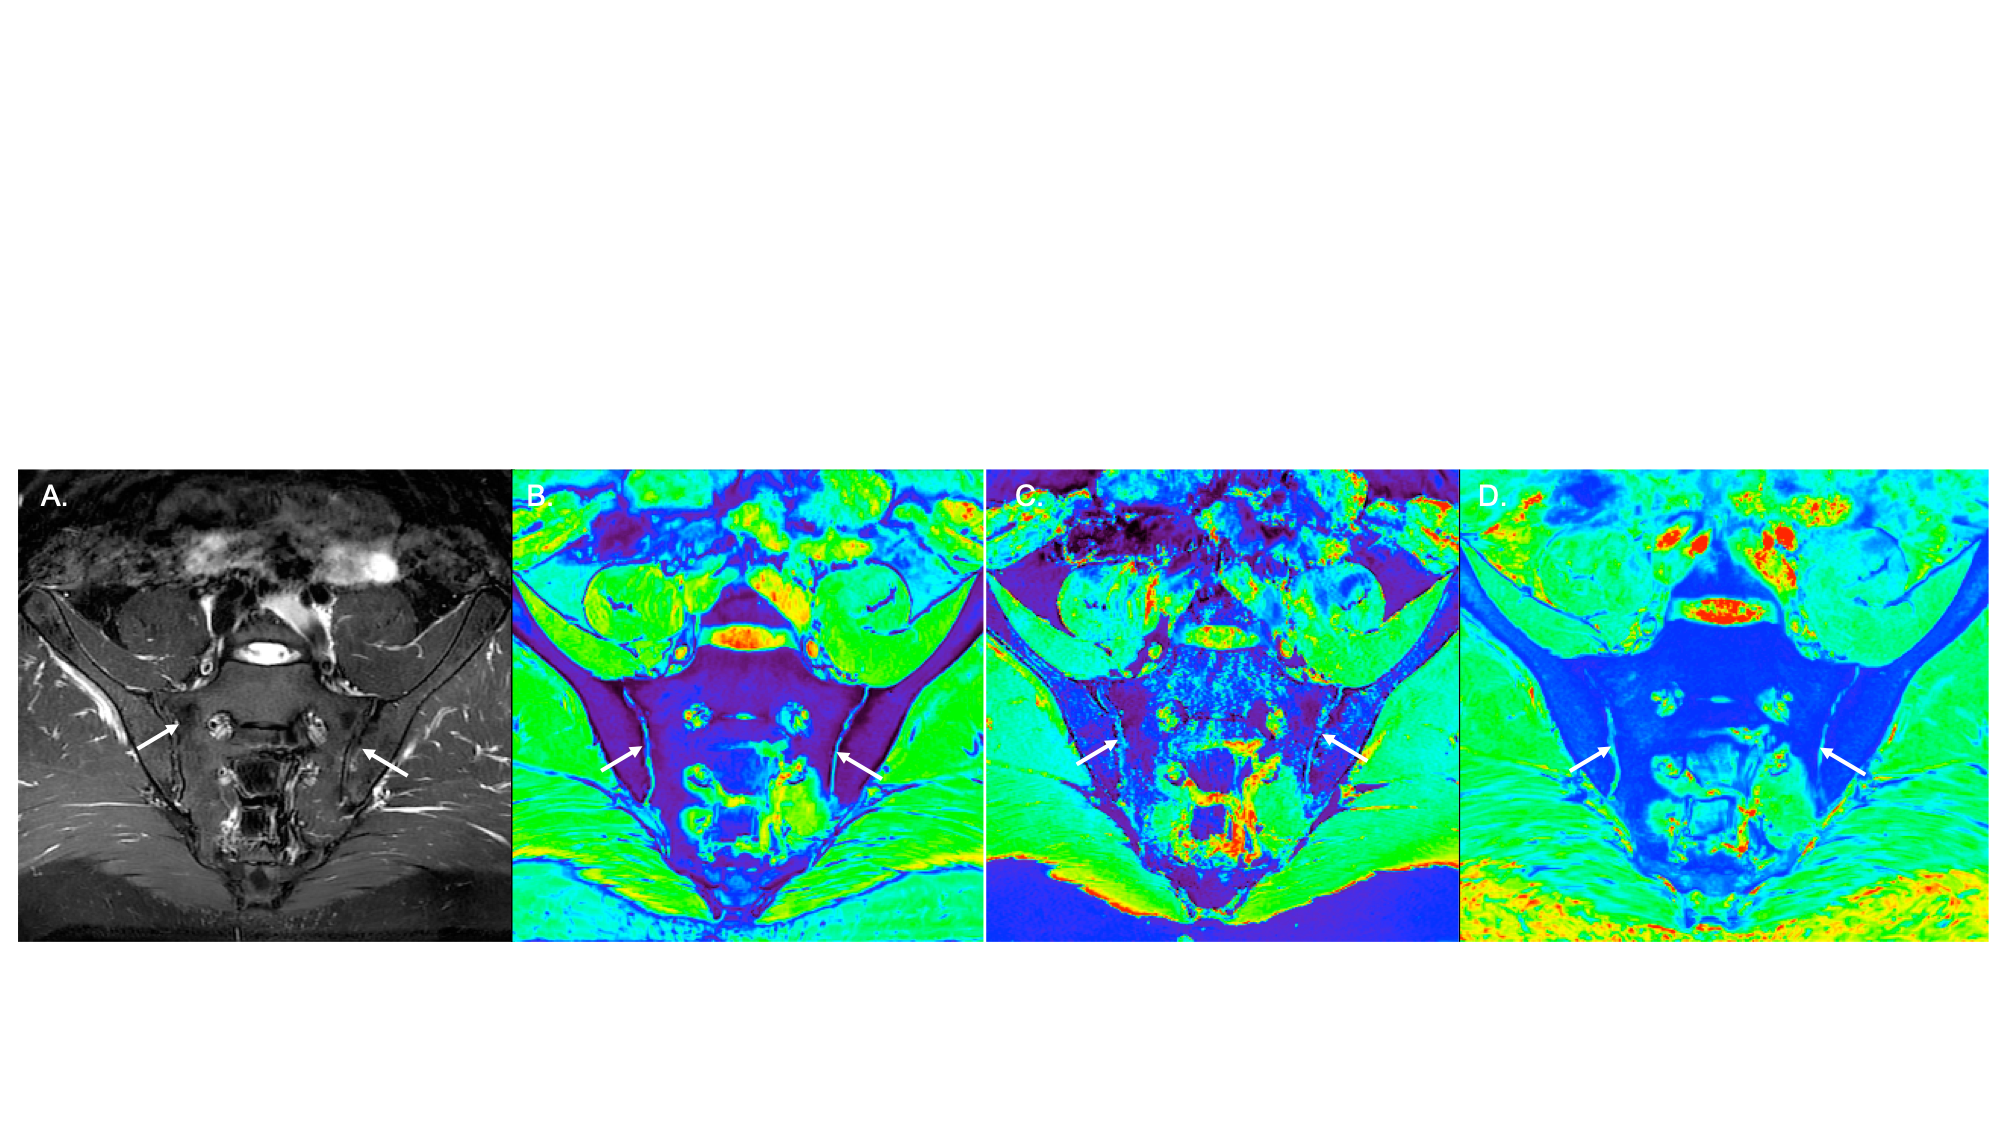
Approach: This study included 20 patients with axial SpA and 20 controls who prospectively underwent SIJs MRI using an oblique coronal MTP sequence.
Results: The PD and T2* values of cartilage in patients with SpA were significantly higher than those of healthy volunteers, p<0.05. There was no statistical difference between SpA and healthy group in T1 values of SIJ cartilage, P>0.05.
Impact: The MTP sequence represents a significant advancement in the imaging of SpA. By providing quantitative PD and T2* values of the SIJ cartilage, it offers a novel tool for the early diagnosis of SpA.
Introduction
SpA, a rheumatic disease primarily affecting the axial skeleton, poses diagnostic challenges due to its subtle and early-stage radiographic features. Cartilage abnormalities of the sacroiliac joints (SIJs) in SpA manifest as degeneration, fragmentation and erosions, fibrosis, and ossification, as proven by CT-guided needle biopsy [1-2]. Traditional imaging techniques might not detect these changes in the early stages. Quantitative imaging allows for the measurement of subtle changes in the SIJ cartilage, which can be crucial for early diagnosis and intervention.One MULTIPLEX(MTP) scan offers multiple sets of images, including but not limited to: composited PD, T2∗, T1 map. The objective of this study was to test whether MTP sequence of the sacroiliac joints (SIJs) might help identifying patients with spondyloarthritis(SpA).Methods
This study included 20 patients with axial SpA (15 males; mean age: 34 ± 5 years; range, 20–42) and 20 controls (15 males; mean age = 30 ± 7 years; range = 20–40) who prospectively underwent SIJs MRI using an oblique coronal MTP sequence. PD, T1, T2∗ maps obtained from MTP sequence were used to draw regions of interests in the cartilaginous part of the SIJs. Intra and interobserver reproducibility of quantitative values were calculated after independent assessment by two radiologists.Results
The PD values of cartilage in patients with SpA measured by two reviewers (Reader 1: 117.109 ±14.106 ms, Reader 2: 119.634±15.275 ms) were significantly higher than those of healthy volunteers (Reader 1: 108.377 ±14.387ms, Reader 2: 107.944 ±16.720ms), p<0.05. The T2* values of cartilage in patients with SpA ( Reader 1: 22.336 ±1.413 ms, Reader 2: 23.421±1.536 ms) were also significantly higher than those of healthy volunteers (Reader 1: 20.900±1.917ms, Reader 2: 21. 931±1.612 ms), p<0.05. There was no statistical difference between SpA and healthy group in T1 values of SIJ cartilage, P>0.05.The AUCs of the PD and T2* values for discriminating SpA from the controls by the two readers were 0.849- 0.854 and 0.816-0.847, respectively.Discussion
The study effectively demonstrates the utility of the MTP sequence in differentiating patients with SpA from healthy controls through the quantitative analysis of SIJ cartilage, a pivotal site in the pathology of SpA.In healthy cartilage, the tightly woven collagen network and proteoglycans restrict the motion of water molecules. This results in relatively short T2* relaxation times. However, early changes in cartilage health, such as inflammation, breakdown of the collagen network, or loss of proteoglycans, can disrupt this structure and increase the mobility of water molecules, leading to longer T2* relaxation times[3-4]. PD imaging is sensitive to the hydrogen proton density within tissues. In inflammatory conditions like SpA, there is often an increase in water content within the affected cartilage due to inflammation and edema. This increase in water content elevates the number of hydrogen protons in the area, leading to higher PD values. The composition of cartilage in terms of collagen and proteoglycan content, which primarily influences T1 values, might not differ significantly between SpA patients and healthy individuals.In conclusion, the MTP sequence represents a significant advancement in the imaging of SpA. By providing quantitative PD and T2* values of the SIJ cartilage, it offers a novel and effective tool for the early detection and diagnosis of SpA, potentially transforming the landscape of SpA management and care.
Acknowledgements
No acknowledgement found.References
1.Cui Y, Zhang X, Zhao Z, Liu Y, Zheng J. The relationship between histopathological and imaging features of sacroiliitis. Int J Clin Exp Med 2015 ;8:5904-5910.
2.Egund N, Sørensen FB, Østgård R, Loft AG, Boel LWT, Jurik AG. CT-guided transarticular biopsy of the sacroiliac joint: Technique and histomorphological results. A preliminary study. Skeletal Radiol 2020;49:453-460.
3.Hesper T, Hosalkar HS, Bittersohl D, Welsch GH, Krauspe R, Zilkens C, Bittersohl B. T2* mapping for articular cartilage assessment: principles, current applications, and future prospects. Skeletal Radiol 2014;43:1429-1445.
4.Choi JA, Gold GE. MR imaging of articular cartilage physiology. Magn Reson Imaging Clin N Am 2011;19:249-282.
Figures