2286
Reducing inter scanner variability using Voxel-based relaxometry and Z-score normalization: 6 years Longitudinal Study of Hip-OA patients1Radiology and Biomedical Imaging, University of California San Francisco, San Francisco, CA, United States, 2Department of Biomedical Engineering, University of Calgary, Canada, Calgary,, AB, Canada, 3Department of Radiology, University of Calgary, Calgary, AB, Canada, 4Epidemiology & Biostatistics, University of California San Francisco, San Francisco, CA, United States
Synopsis
Keywords: Cartilage, Quantitative Imaging
Motivation: It is important to examine and correct inter-scanner variability of T1rho/T2 values to improve the accuracy of longitudinal studies
Goal(s): To evaluate the inter-scanner variability of T1rho/T2 values and measure longitudinal changes in hip cartilage T1rho/T2 values after calibration.
Approach: TCalibrate the hip cartilage T1rho/T2 values using Voxel-based relaxometry and Z-score normalization techniques
Results: The T1rho/T2 values showed that there was no statistically significant cartilage region (p<0.05) between the scanners. The longitudinal results showed an increase in number of subjects showing positive slope was increased in T1rho/T2 values after calibration (36.84 and 34.21%) compared without calibration (15.8% for both T1rho/T2).
Impact: The technique used for reducing the inter-scanner variability of T1rho/T2 values may benefit the longitudinal assessments of hip OA, specifically for evaluating disease progression over time on different scanners/before and after scanner upgrades
INTRODUCTION
Hip Osteoarthritis (OA) is a highly prevalent joint disease in the United States 1. While quantitative MRI has shown promising results in the past years, scanner/sequence and coli sensitivity it is well documented in the literatures (2-4), however it is nearly impossible to harmonize all the technical aspects in a multiyear longitudinal study or in clinical practice where patients are followed for multiple years. Become than, important to examine and possibly correct the inter-scanner variability of the T1rho/T2 values across multiple scanners.The aims of the study were to a) Calibrate the hip cartilage T1rho/T2 values across two MRI scanners using Voxel-based relaxometry technique (VBR) technique and Z-score normalization and b) to evaluate the longitudinal variations in cartilage T1rho/T2 values in hip OA patients.
Methods
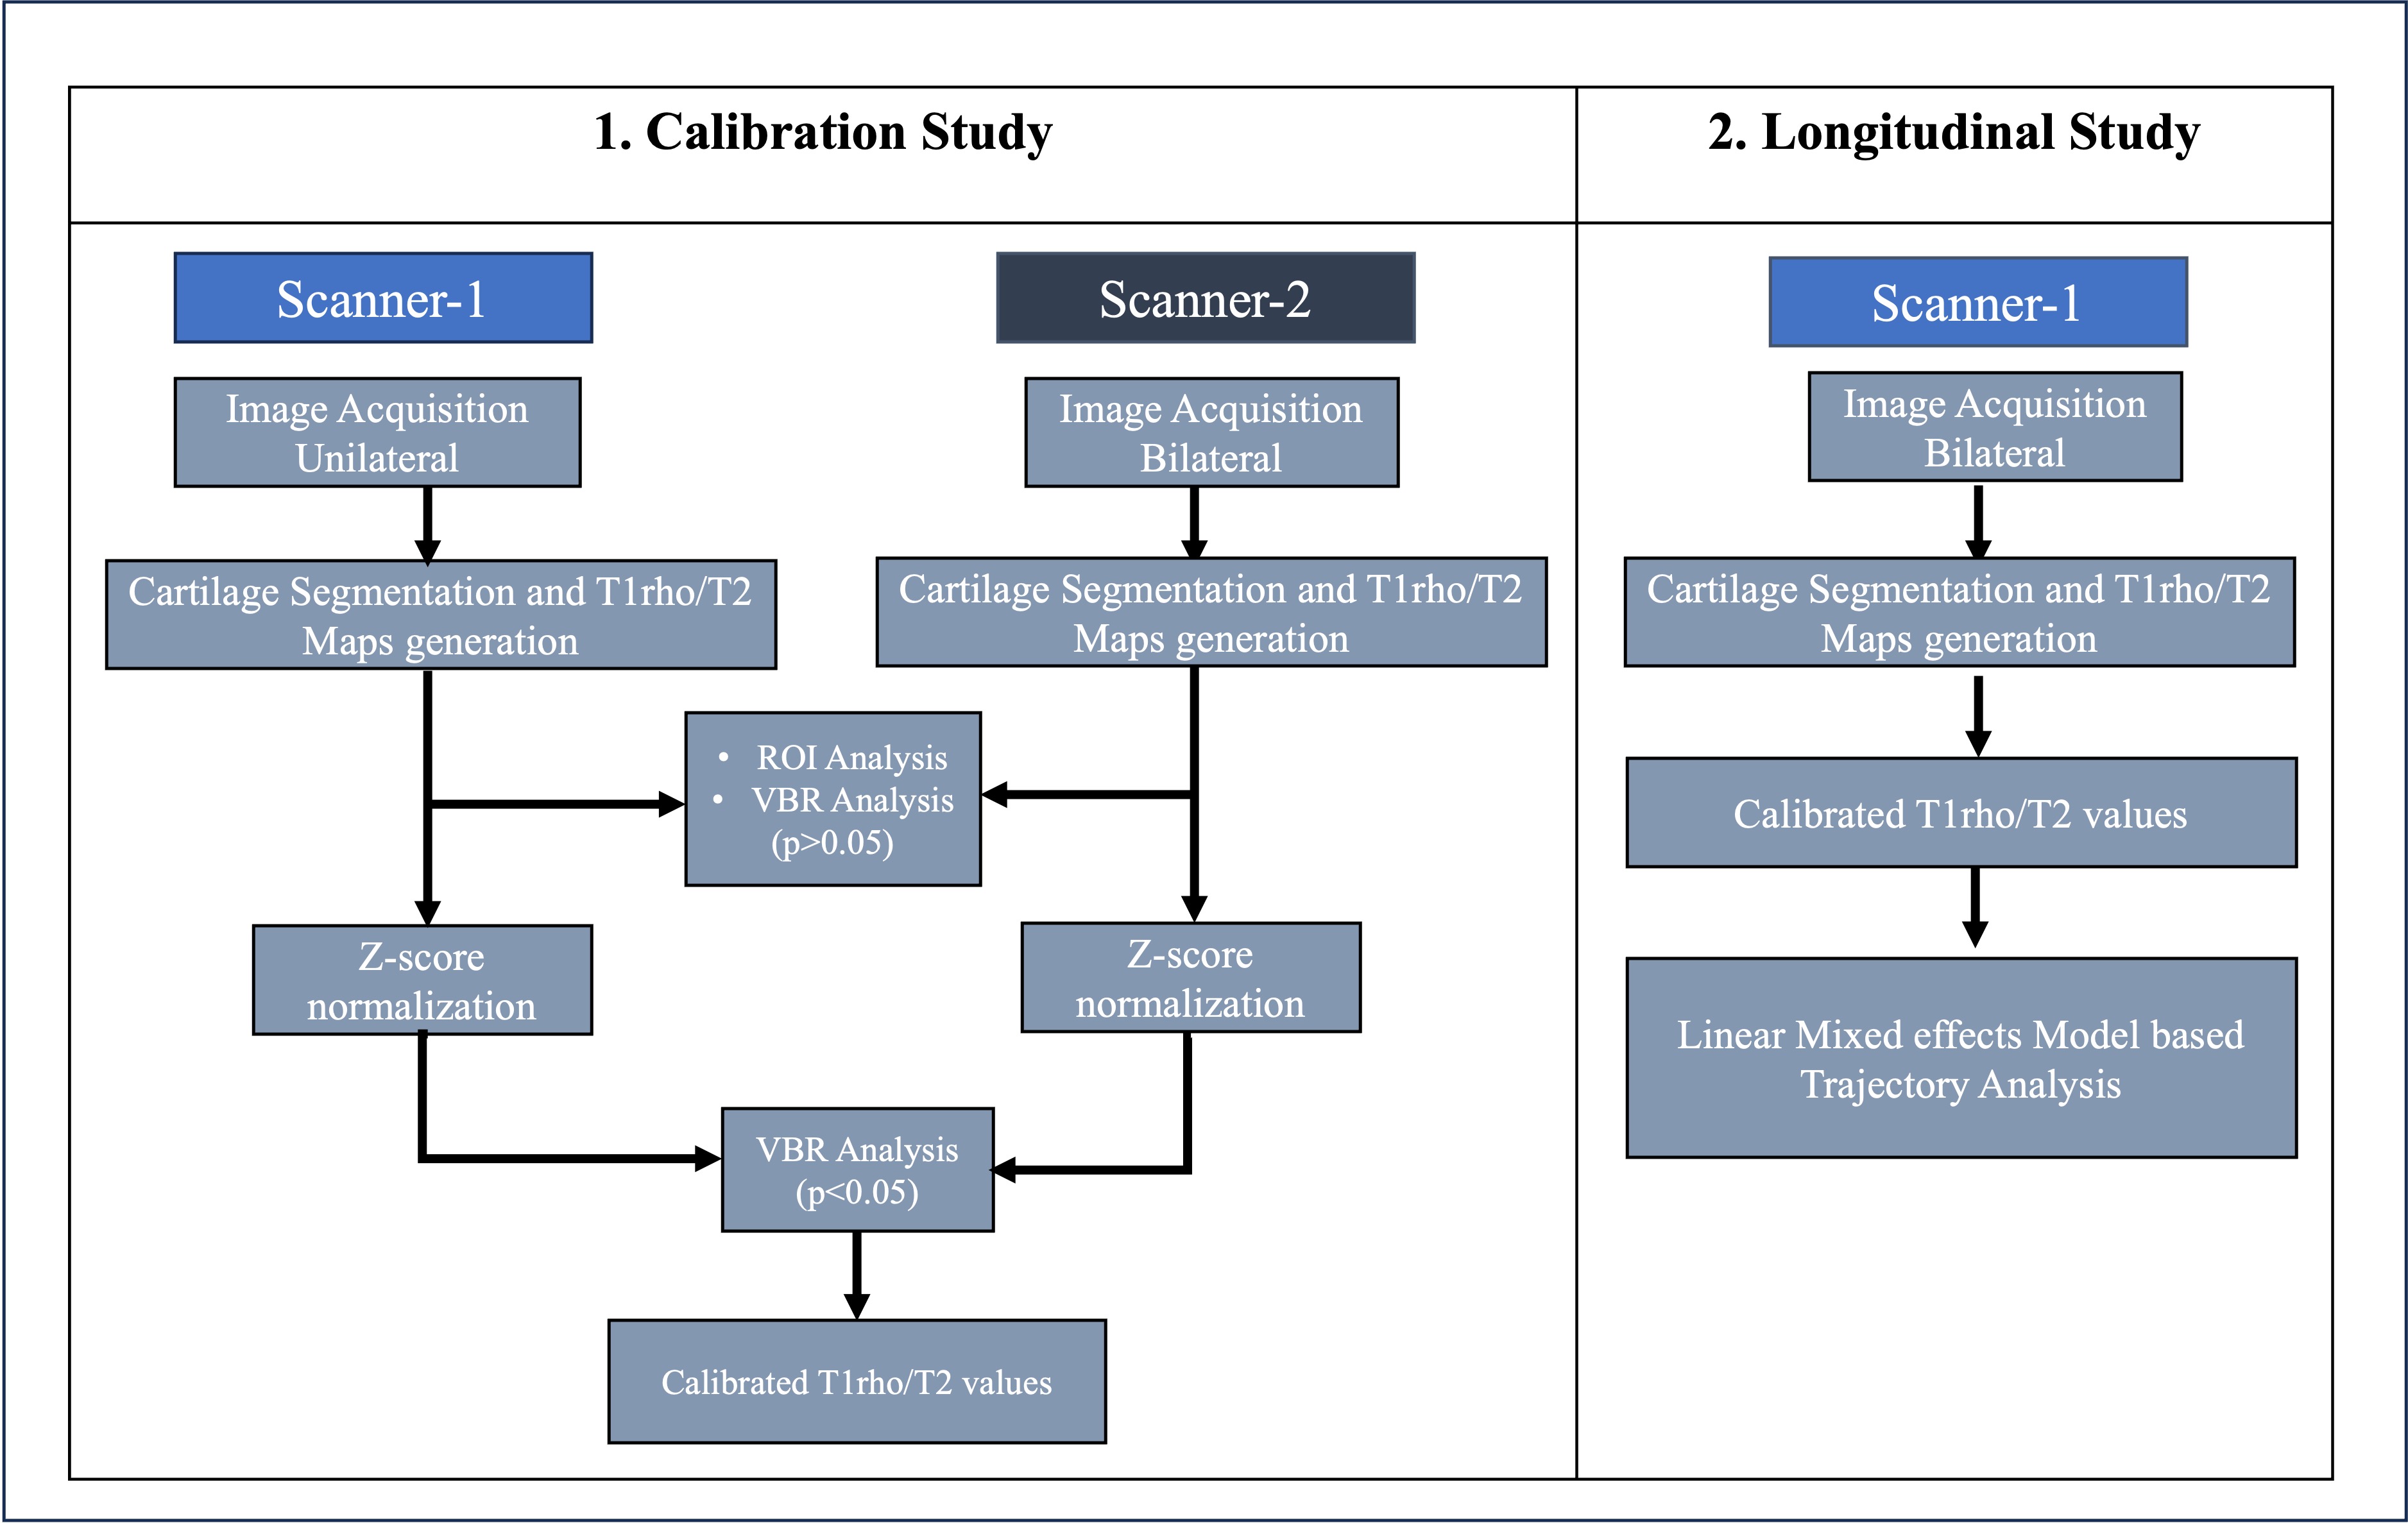
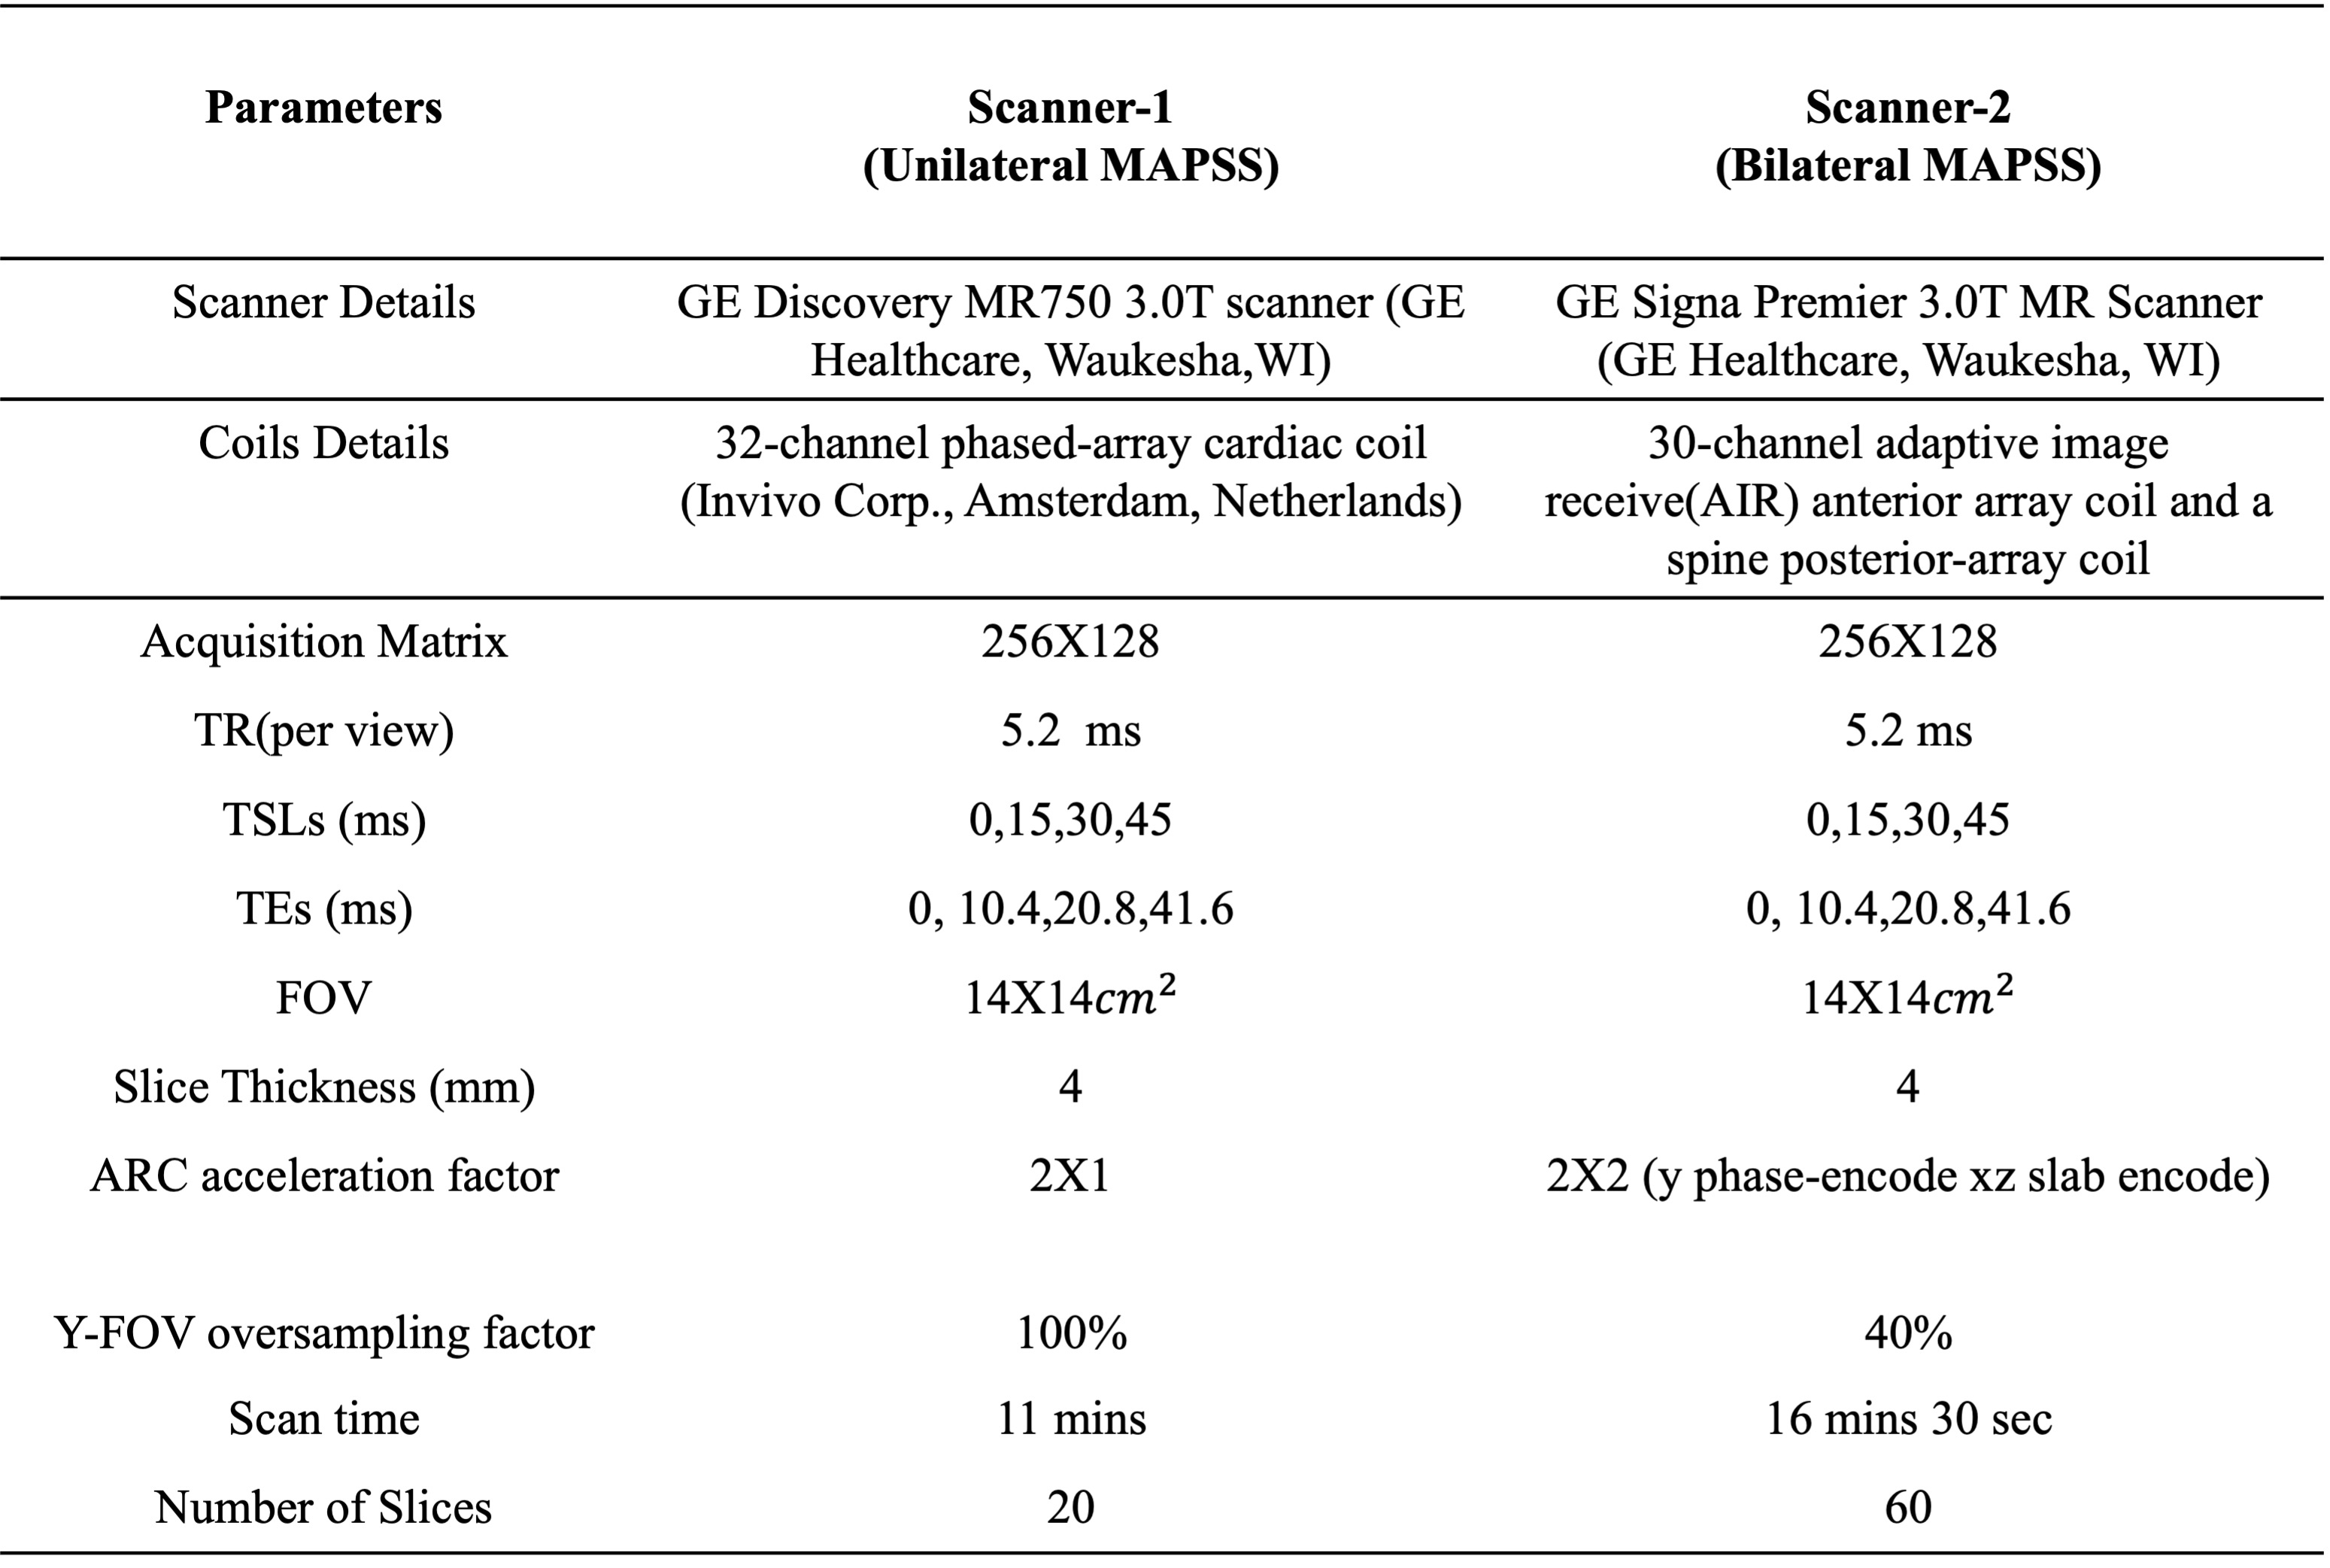
Two different cohorts were used in this study. In the first study (calibration study), 8 subjects (5 female, 40.88±14.36 years) were included. Images were acquired the from two scanners named Scanner-1 and Scanner-2 in the year 2022 using bilateral protocol (Table1) with a maximum gap of one month between the acquisition. In the validation study (longitudinal study), 19 hip OA subjects (12 female, age 54.53±15.80 years) were recruited. Images were acquired on Scanner-1 using the unilateral protocol (Table 1) from the year 2016 to 2021 and on Scanner-2 using the bilateral protocol (Table 1) in the year 2022. The impact of both protocol was studied and reported previously ^6. All the subjects were signed informed consent and approved by the local Institutional Review Board (IRB). The overall processing pipeline of the study was illustrated in Figure 1. Scanner details and MRI sequences are summarized in Table 1.a. Calibration Study:
In the calibration study, from the acquired MAPSS sequence images, acetabular and femoral cartilage were automatically segmented using atlas-based approach and registered to the same atlas subject to enable comparisons between subjects(_ ^( 5)) . The ROI-based and VBR method was used for estimating the variability between the two scanners based on the quantitative values from the T1rho/T2 maps. All postprocessing techniques were performed using an in-house program developed in MATLAB (version R2021a, The MathWorks Inc., USA).
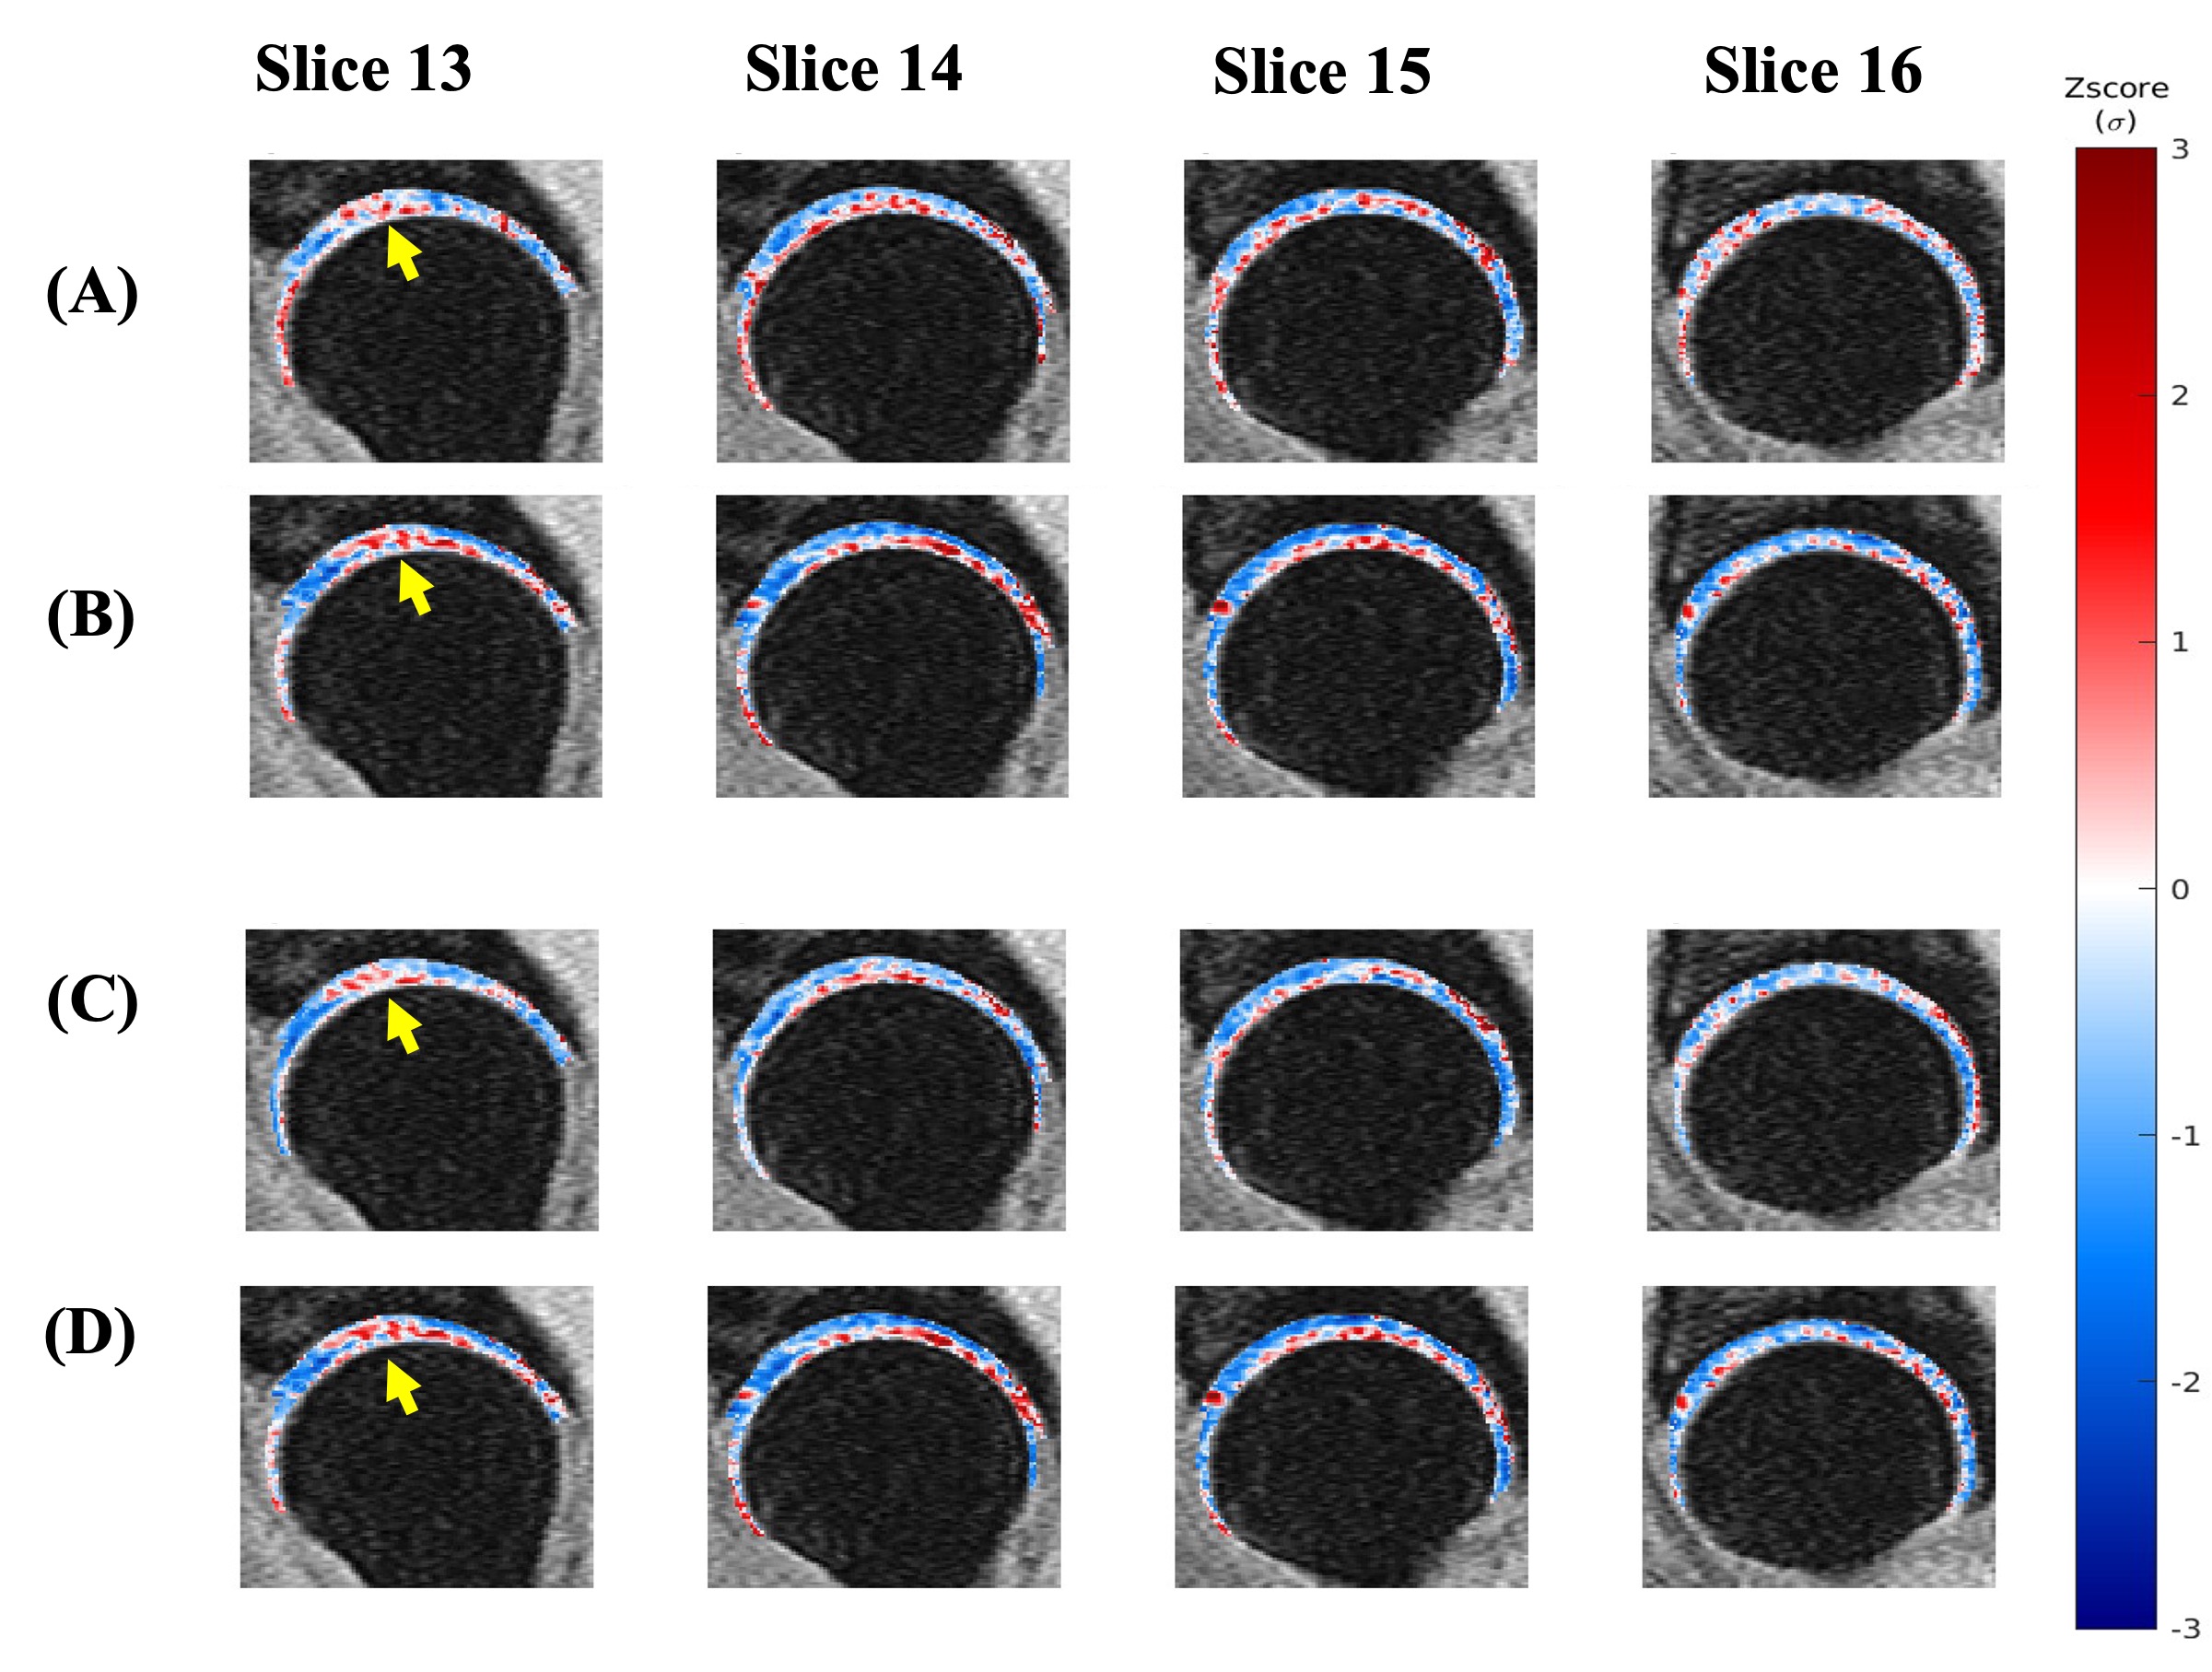
The mean and standard deviation of T1rho/ T2 values from VBR analysis were used for scanner specific (Scanner-1 and Scanner-2) Z-score generation using the formula:
$$Z_{isc1}= \frac{T_{isc1 }- MeanT_{isc1}}{\sigma_{sc1}} (1)$$
$$Z_{isc2}= \frac{T_{isc2 }- MeanT_{isc2}}{\sigma_{sc2}} (2)$$
All Z-score values beyond ± 4 range was thresholded to +4 or −4, respectively. After Z-score normalization, the VBR analysis was showed there was no voxel having the significant difference between Scanner-1 and Scanner-2 T1rho/T2 values. Therefore, the calibration equation derived from (1) and (2) is:
$$T_{iCB2}= (\frac{T_{isc1 }- MeanT_{sc1}}{\sigma_{sc1}}\times\sigma_{sc2})+ MeanT_{sc2}. (3)$$
Finally, this calibration factor was used to update the Scanner-2 T1rho/T2 values acquired bilaterally, and these values were used for the longitudinal hip-OA study.
b. Longitudinal Study: All the subjects were segmented and the T1rho/T2 maps generation was done same method used in the calibration study. However, the last time point T1rho/T2 values were calibrated based on Equation-3.
Paired t-test was used for the statistically significant difference between Scanner-1 and Scanner-2 T1rho/T2 values. A p-value of 0.05 was selected as the significant level of threshold. Relative percentage change (RPC) was used for evaluating the longitudinal study differences.
Results
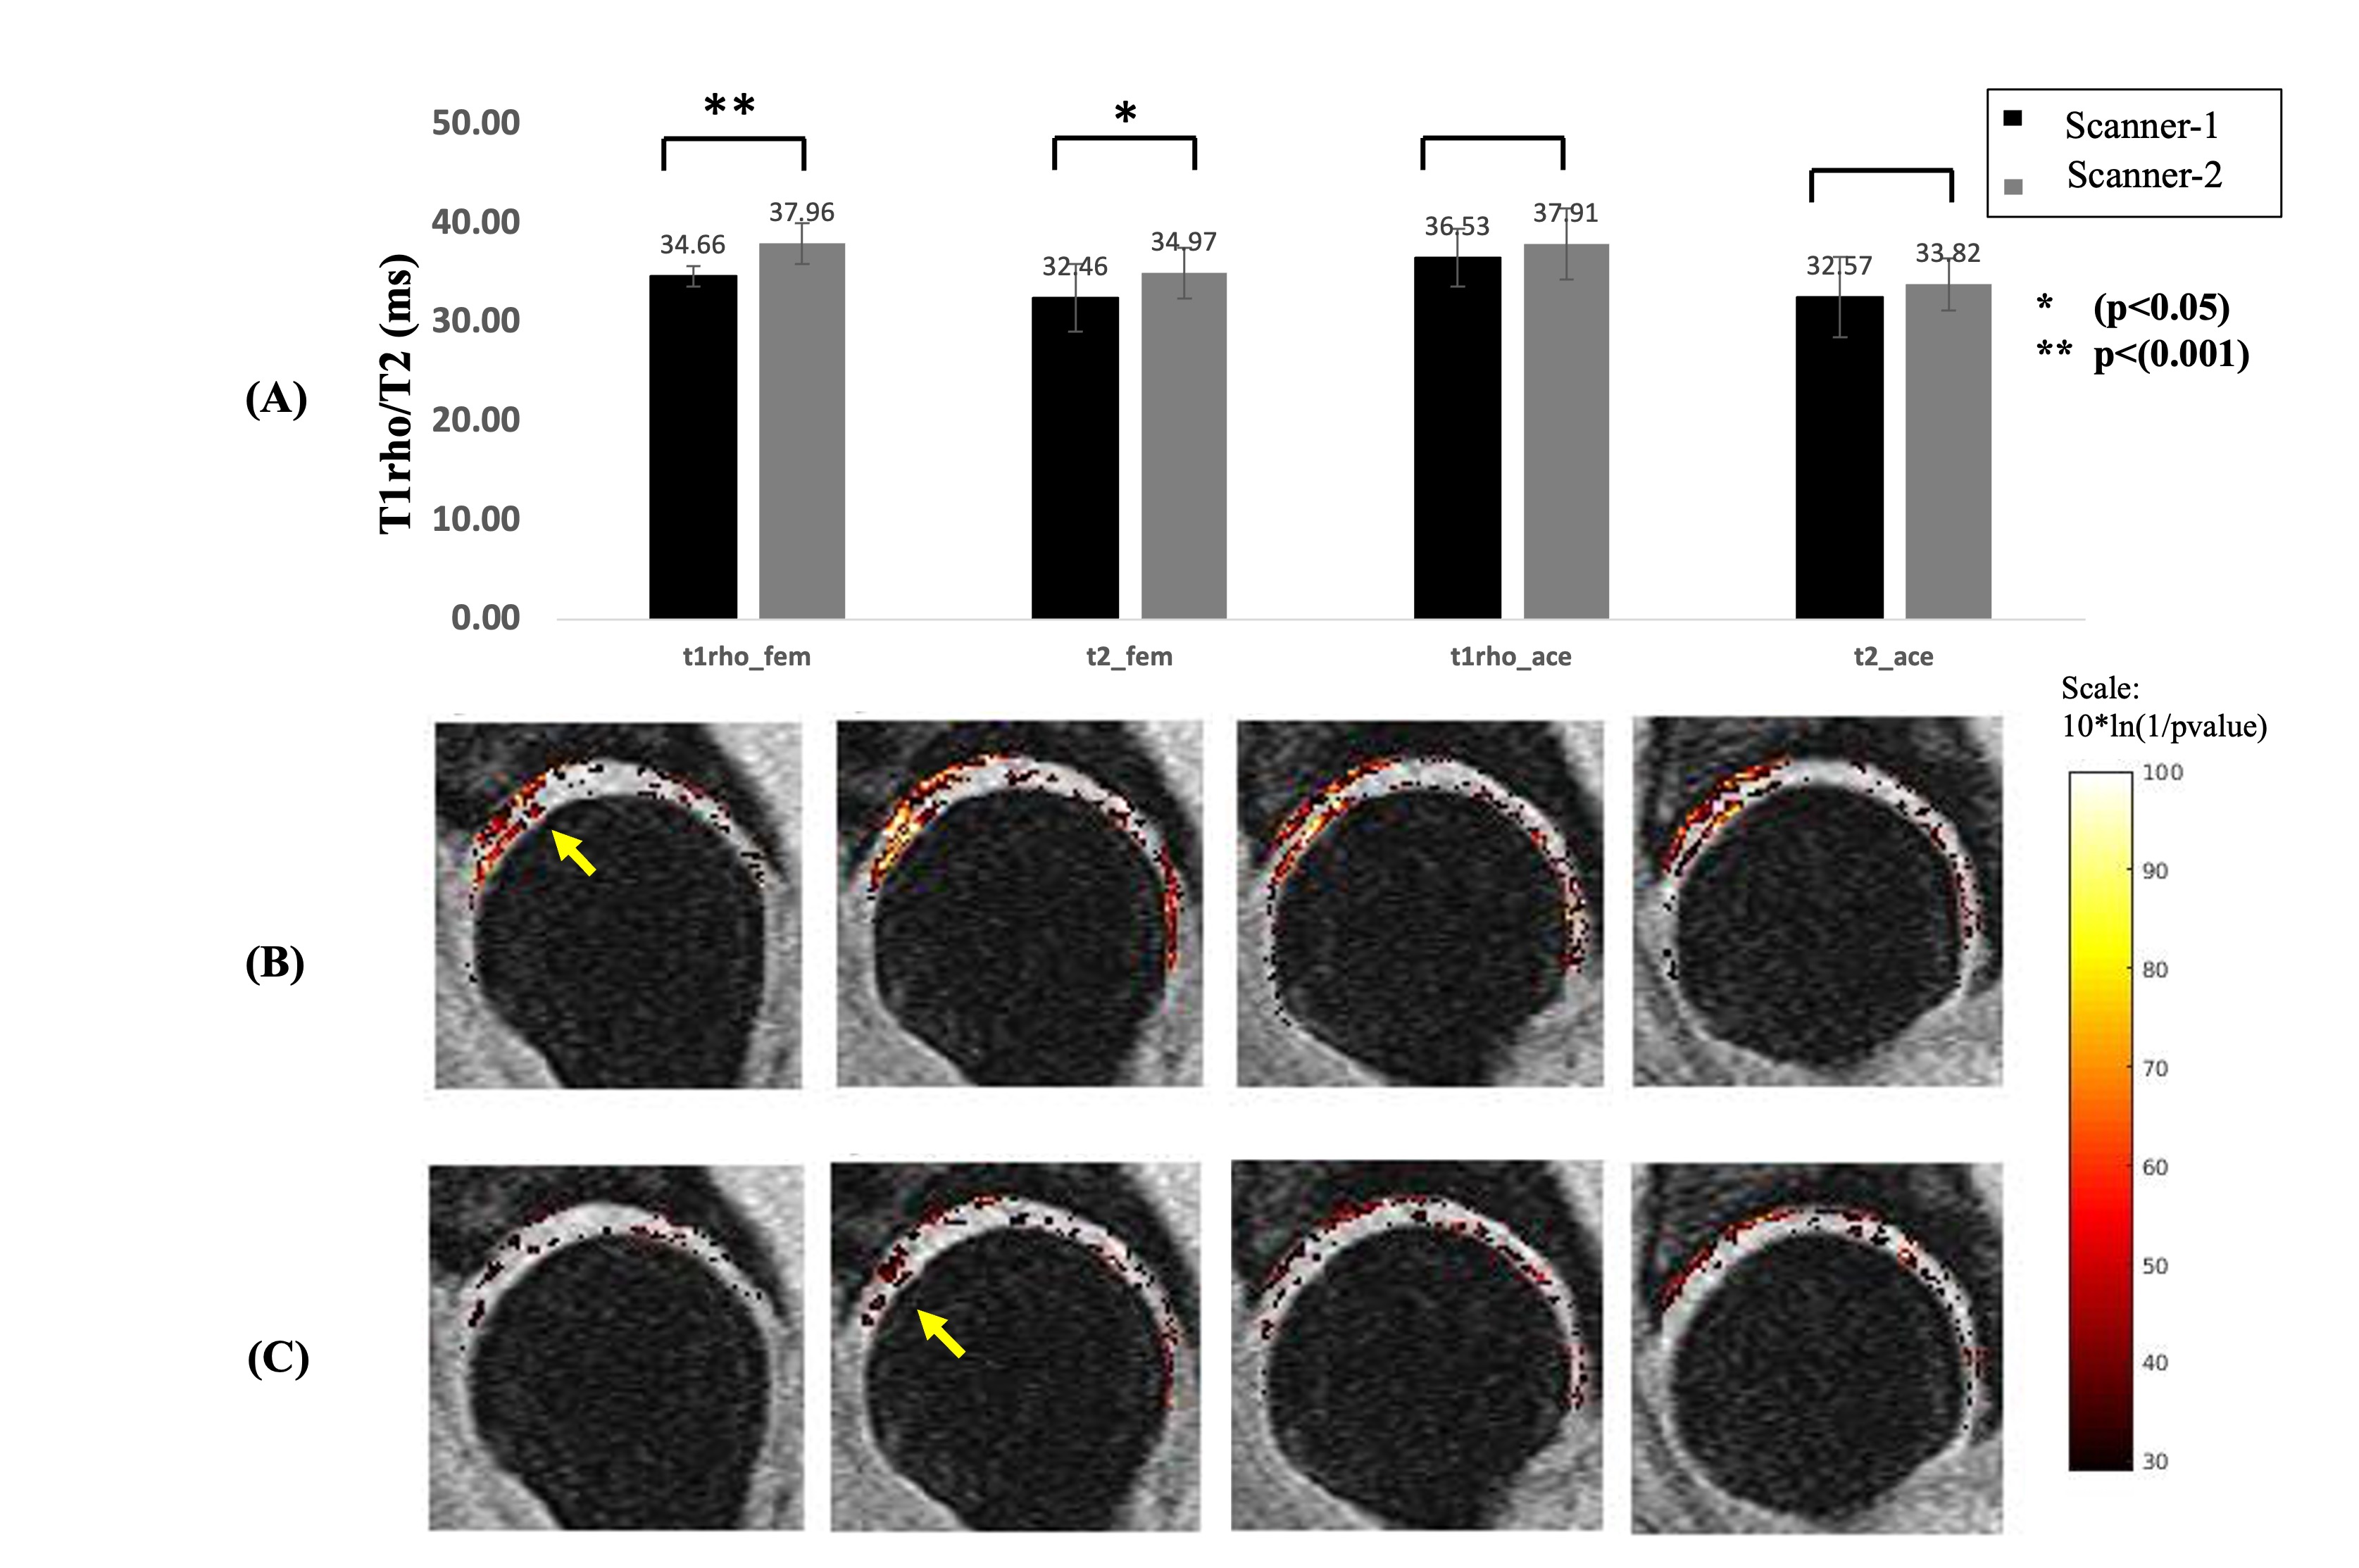
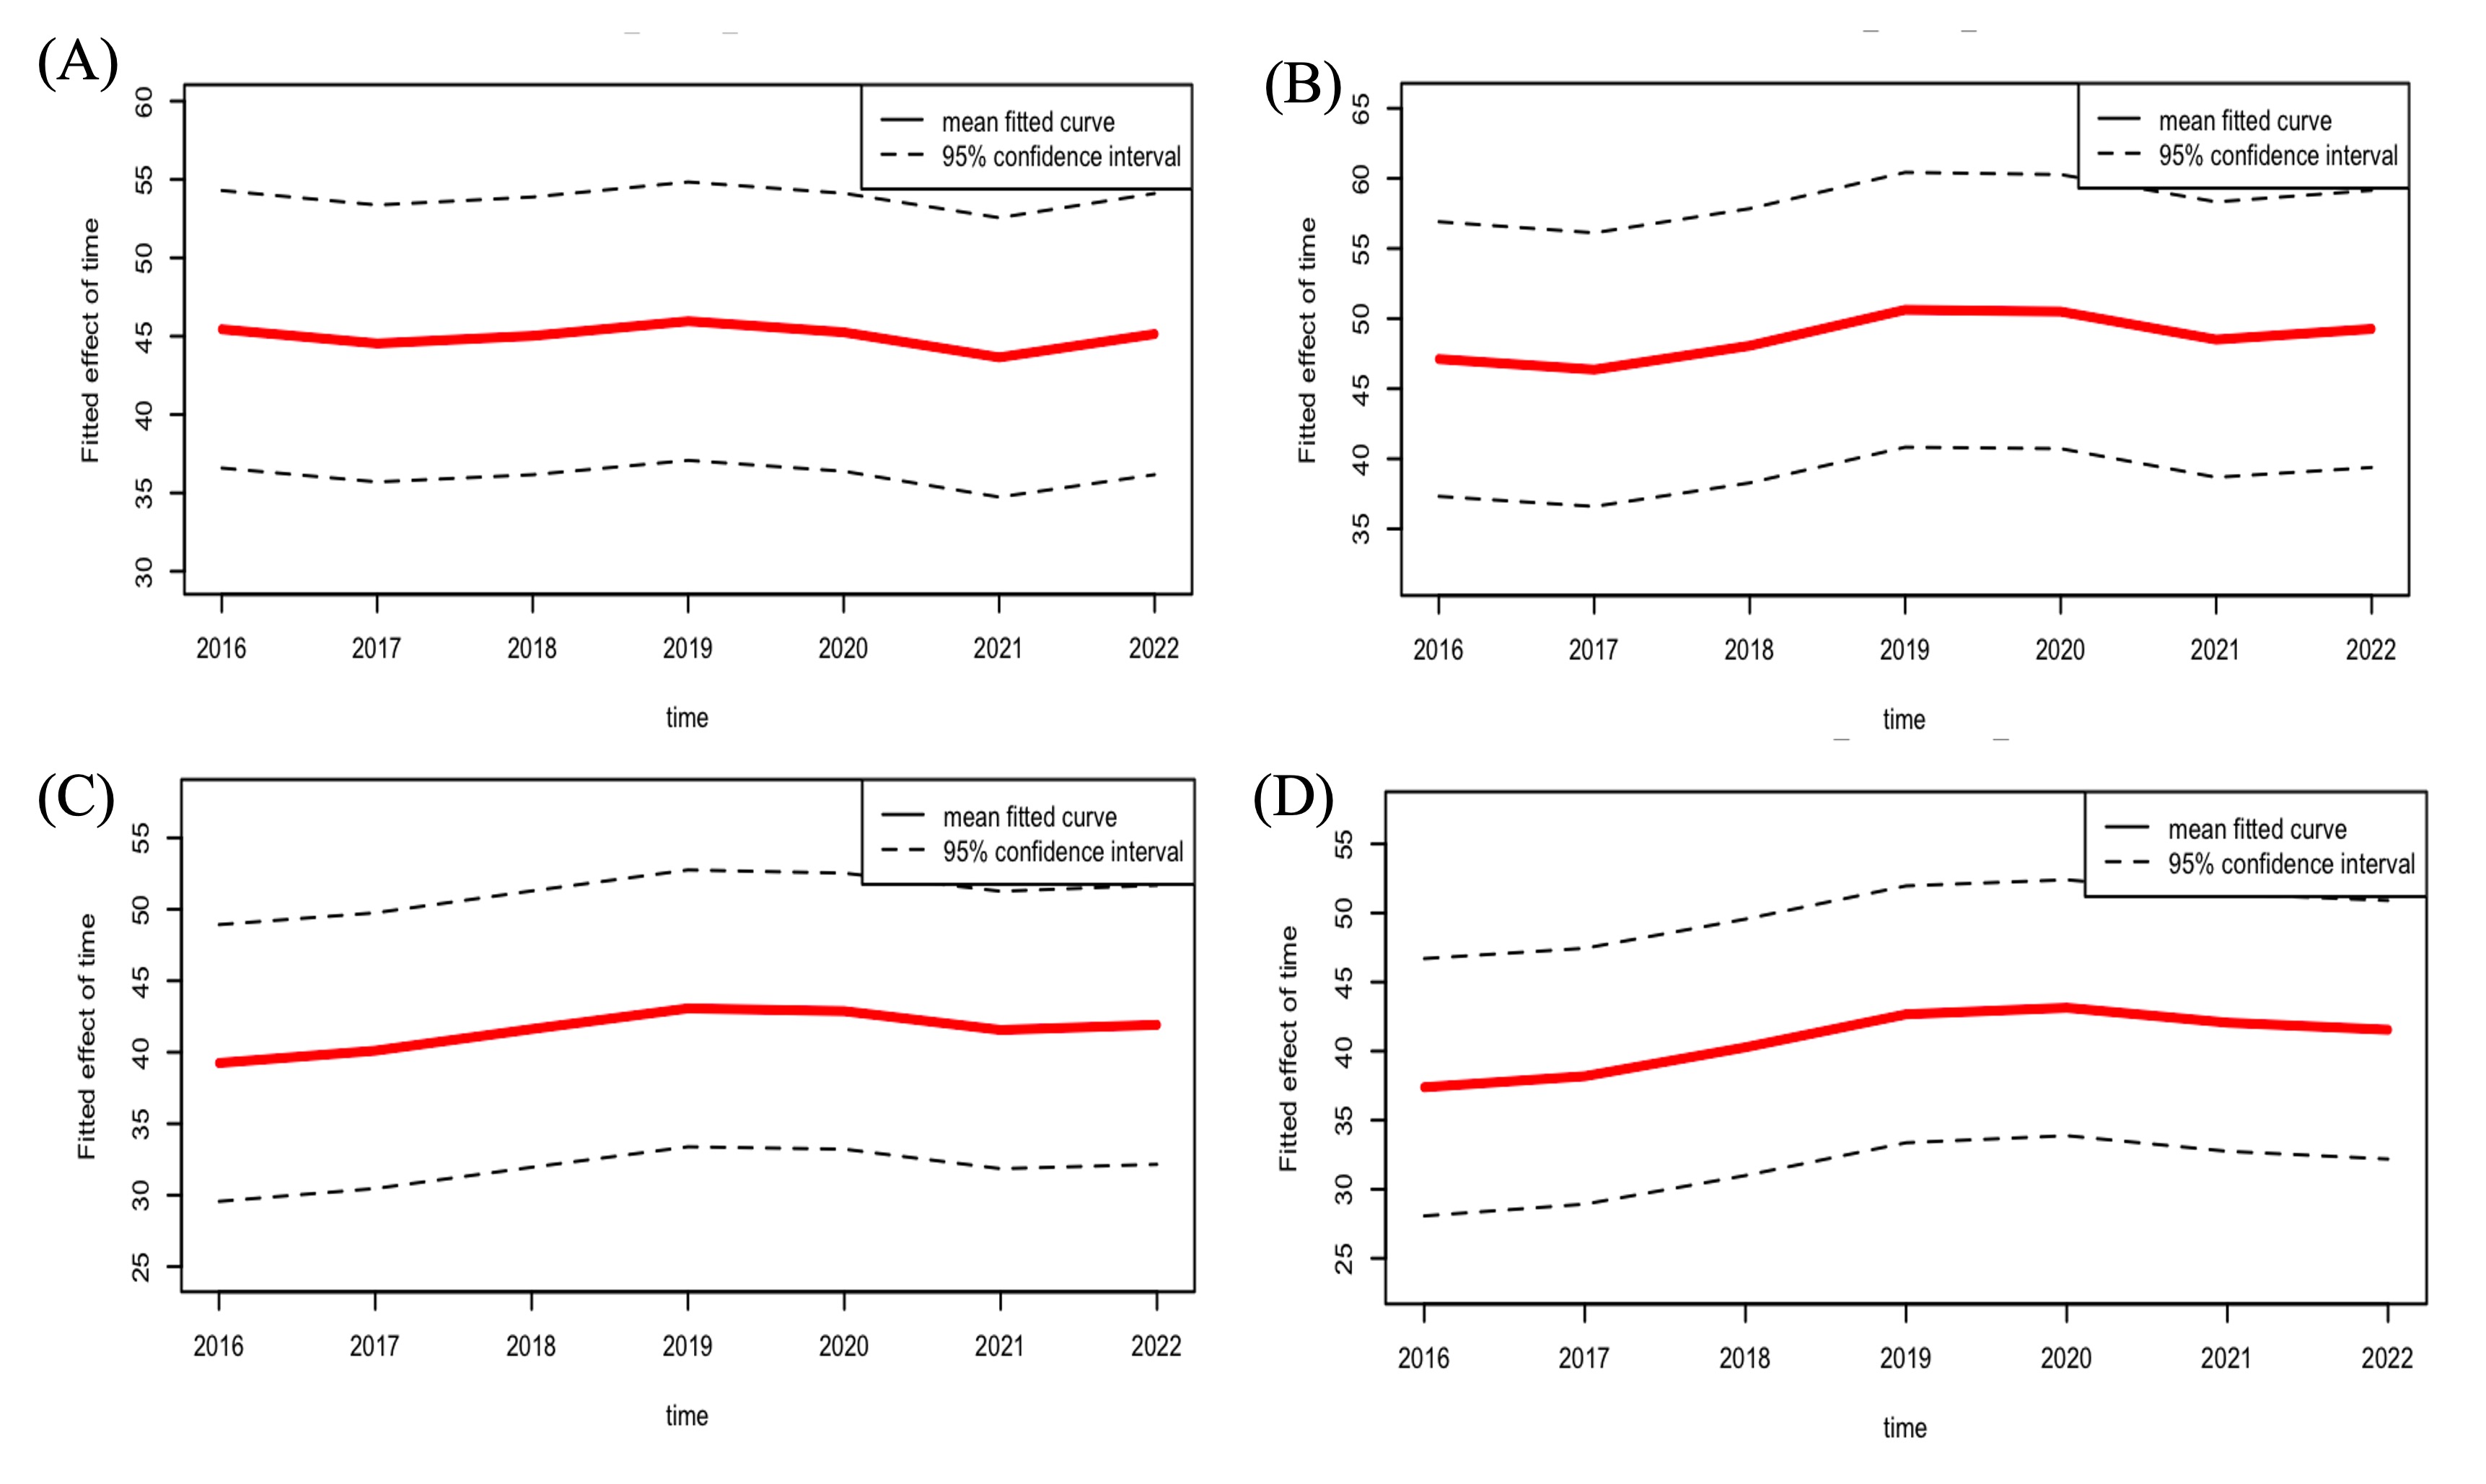
The ROI analysis showed a significant difference in femur T1rho(p<0.001) and T2(p=0.024) times. After Z-score normalization, the VBR analysis was done on the normalized values which showed that there was no longer a statistically significant difference(p<0.05) between scanners. Example of one sample subject Z-score T1rho/T2 maps were shown in Figure 4. RPC showed 34.21% of subjects showed an increasing trend after calibration whereas only 15.8% of subjects showed increase without calibration in acetabular cartilage region. The trajectory analysis curves results were shown in Figure 5.Discussion
In the current study, the ROI analysis and VBR analysis showed significant difference in T1rho/T2 values. These significant differences in quantitative values across scanners are often confusing as to understand whether these appear as part of scanner-related changes or real variation in the longitudinal data. The RPC results showed the subjects showed an increase in trend of T1rho/T2 values after calibration especially in the acetabular region. The trajectory analysis showed an increasing trend especially the mean-T2 value of the acetabular cartilage showed steady growth in the analysis based on age, gender, BMI and KL score predictor variables.CONCLUSION: The calibration approach demonstrated the ability of VBR and Z-score normalization for the inter scanner variability reduction. Furthermore, the calibrated data analysis may useful for longitudinal changes in T1rho/T2 values of articular cartilage with hip-OA patients.
Acknowledgements
This project was supported by R01AR069006 (NIH)References
1. Berenbaum F, Eymard F, Houard X. Osteoarthritis, inflammation and obesity. Curr Opin Rheumatol. 2013;25:114–118.2. V. Pedoia, C. Russell, A. Randolph, X. Li, S. Majumdar, and A.-A. Consortium, Principal component analysis-T1rho voxel based relaxometry of the articularcartilage: a comparison of biochemical patterns in osteoarthritis and anterior cruciate ligament subjects, Quant Imaging Med Surg, 2016, 6(6), 623-633, doi:10.21037/qims.2016.11.03.
3. U. Duvvuri, R. Reddy, S. D. Patel, J. H. Kaufman, J. B. Kneeland, and J. S. Leigh, T1rho-relaxation in articular cartilage: effects of enzymatic degradation, MagnReson Med, 1997, 38(6), 863-867
4. M. T. Nieminen, J. Rieppo, J. Toyras, J. M. Hakumaki, J. Silvennoinen, M. M. Hyttinen, H. J. Helminen, and J. S. Jurvelin, T2 relaxation reveals spatial collagenarchitecture in articular cartilage: a comparative quantitative MRI and polarized light microscopic study, Magn Reson Med, 2001, 46(3), 487-493, doi:10.1002/mrm.1218.
5. V. Pedoia, X. Li, F. Su, N. Calixto, and S. Majumdar, Fully automatic analysis of the knee articular cartilage T1rho relaxation time using voxel-based relaxometry, J Magn Reson Imaging, 2016, 43(4), 970-980, doi: 10.1002/jmri.25065.
6. K. Roach, M. Han, T.Link et al., Feasibility of Simultaneous Bilateral Hip Quantitative MRI, ISMRM 2022.
7. R. Bhattacharjee, R. Thahakoya, J. Luitjens et al., Effects of T1p Characteristics of Load-Bearing Hip Cartilage on Bilateral Knee Patellar Cartilage Subregions: Subjects With None to Moderate Radiographic Hip Osteoarthritis, https://doi.org/10.1002/jmri.29009
Figures