2282
TFL Fat Fraction Predicts Worse Patient-Reported Hip Pain After 4 Years1Radiology & Biomedical Imaging, UCSF, San Francisco, CA, United States, 2Physical Therapy and Rehabilitation Science, UCSF, San Francisco, CA, United States
Synopsis
Keywords: Muscle, Fat, Muscle, fat fraction, fatty infiltration, hip OA
Motivation: Hip abductor muscles have a fundamental role in walking and other daily physical tasks. Relating hip abductor muscle fat fractions to patient-reported hip outcomes at a later timepoint could provide insights on exercise targets for patients with hip osteoarthritis who may become candidates for total hip arthroplasty.
Goal(s): The study seeks to determine if hip abductor muscle fat fractions predict patient-reported hip outcomes after 4 years.
Approach: Linear mixed-effects regressions were performed to investigate relationships between baseline hip abductor fat fractions and PROMS at follow-up.
Results: Higher baseline TFL fat fraction was associated with worse patient-reported hip pain scores at 4-year follow-up.
Impact: Our findings suggest performing further research into tensor fascia lata fat fraction in relation to future clinical outcomes for patients with hip osteoarthritis.
Introduction
Abnormal muscle fat has been associated with various musculoskeletal pathologies including hip and knee osteoarthritis (OA).1,2 Previous studies have found that hip abductor and quadriceps muscle fat fraction values are associated with hip cartilage degeneration and knee OA respectively.3,4 While existing research has explored relationships between OA and hip muscle fat fractions cross-sectionally, no studies have related baseline muscle fat fraction values to longitudinal patent reported outcomes (PROMS). As such, this study investigates associations between baseline fat fraction of three hip abductor muscles (gluteus medius, gluteus minimus, tensor fascia lata) and PROMS using the Hip Disability and Osteoarthritis Outcome (HOOS) Scale at 4-year follow-up.Methods
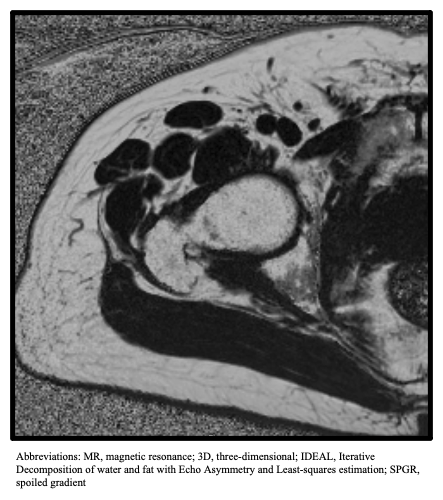
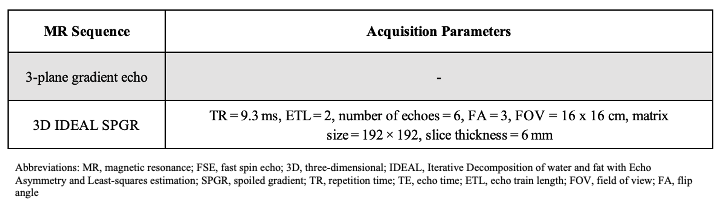
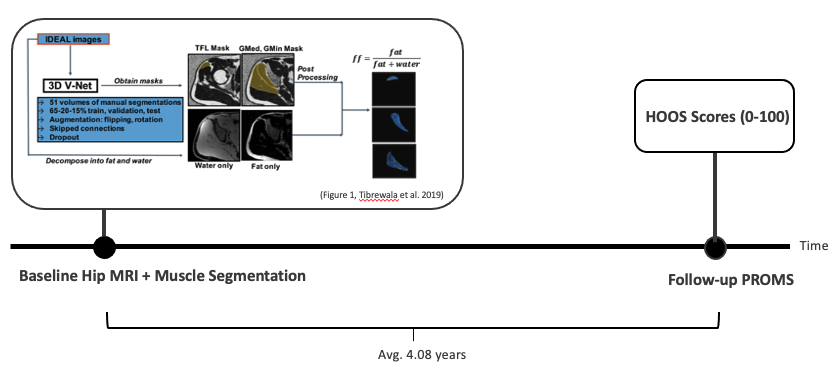
All participants provided written informed consent prior to participation and this study was approved by our IRB. Data on 41 hip joints from 23 patients (18 bilateral, 5 unilateral) were collected at two timepoints from 2018 to 2023 with an average of 4.08 years between visits. Patients were recruited as controls or OA patients with varying degrees of mild-moderate radiographic hip OA. At baseline, unilateral hip MR studies were acquired using a 3.0T scanner (GE Healthcare, Waukesha, WI, USA) with a 3-plane gradient echo localizer and eight-channel cardiac coil (GE Healthcare, Waukesha, WI, USA). The muscle MR sequence used was 3-dimensional axial Iterative Decomposition of water and fat with Echo Asymmetry and Least-squares estimation spoiled gradient (IDEAL SPGR) with multi-peak fat spectrum modeling and single T2* correction.5,6 Fat fraction values were acquired from an automatic, validated segmentation model by Tibrewala et al.7 Patients completed the HOOS survey at baseline and follow-up. Statistical analysis was performed using R Statistical Software (v4.2.3; 2023). Separate linear mixed-effects (LME) models (R nlme package version 3.1-163; 2023)8 were used to assess baseline fat fraction of the gluteus medius (GMed), gluteus minimus (GMin), and tensor fascia lata (TFL) as predictors of 5 HOOS subscale scores (Pain, Symptoms and Stiffness, Sports, Activities of Daily Life, Quality of Life) at follow-up, where scores are graded on a 0-100 scale, worst to best.9 Age, sex, BMI, time between visits, and baseline score were controlled for as covariates. Participant ID was included as a random effect to account for hips from the same patient.Results
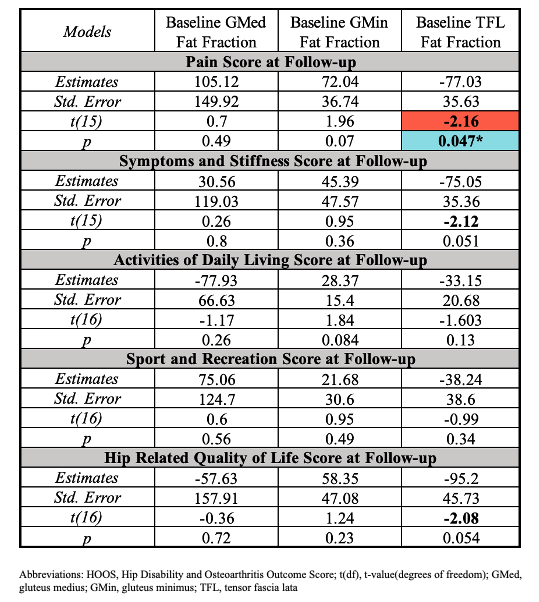
Baseline TFL fat fraction was a significant negative predictor for HOOS Pain score at follow-up (t(15)=-2.16, p=0.047). TFL fat fraction was not a significant predictor for other HOOS subscale scores at follow-up. Baseline gluteus medius and gluteus minimus fat fraction were not found to be significant predictors of follow-up HOOS subscale scores (Figure 3).Discussion
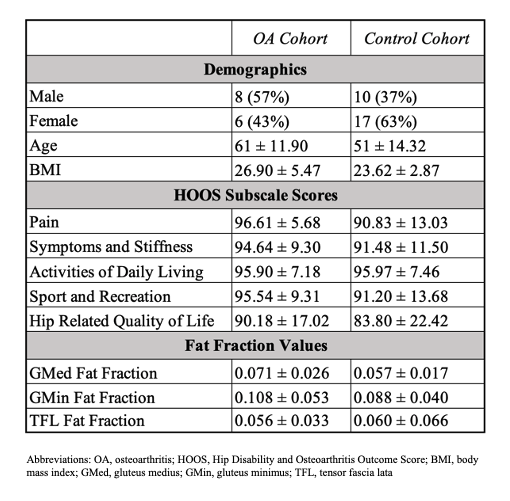
Our results suggest that TFL fat fraction values at baseline may have utility as imaging-based predictors of future pain in both healthy controls and patients with hip OA. TFL fat fraction as a negative predictor for HOOS Symptoms and Stiffness and HOOS Hip-Related Quality of Life trended towards significance with t>|2|, but were statistically insignificant (p≥0.05). Given our study's mixed cohort of healthy controls and patients with mild-moderate hip OA at baseline, none of the baseline characteristics in Figure 1 differ significantly between groups (p>0.05) except for age, controlled for as a covariate in our LME analyses. Our findings highlight potential avenues for early intervention in the development and progression of hip OA (e.g. muscle fat fraction biomarkers, informing strengthening exercises to address muscle deficits) at a stage where advanced cartilage degeneration has not yet occurred and targeted treatment strategies could be more effective.10,11 While this cohort did not include patients with severe hip OA, muscle fat fraction may possibly inform prognosis and treatment strategies for patients who may undergo total hip arthroplasty (THA), as approximately 23% of patients develop unexplainable hip pain after THA.12–15 Given that the TFL is connected to the iliotibial (IT) band, which aids in lateral rotation, abduction, and extension of the hip as well as stabilization of the knee, TFL pathology may reduce tension within the IT band, resulting in decreased lateral stability of the hip and knee.16 Further research could explore associations between TFL fat fraction and hip OA progression, knee OA development, and THA incidence and outcomes.Conclusion
TFL fat fraction may have utility as an imaging biomarker capable of predicting the worsening or development of future pain in both patients with hip OA and healthy controls. These findings have clinical implications for predicting and addressing persistent post-operative pain in some THA patients and point to a need for further research on associations between TFL fat fraction and OA.Acknowledgements
We would like to thank the patients for their years of participation in research. Research reported in this abstract was supported by the National Institute of Arthritis and Musculoskeletal and Skin Diseases of the National Institutes of Health under award number R01AR069006.References
1. Eck BL, Yang M, Elias JJ, et al. Quantitative MRI for Evaluation of Musculoskeletal Disease: Cartilage and Muscle Composition, Joint Inflammation, and Biomechanics in Osteoarthritis. Invest Radiol. 2023;58(1):60-75. doi:10.1097/RLI.00000000000009092.
2. Nozaki T, Tasaki A, Horiuchi S, et al. Predicting Retear after Repair of Full-Thickness Rotator Cuff Tear: Two-Point Dixon MR Imaging Quantification of Fatty Muscle Degeneration—Initial Experience with 1-year Follow-up. Radiology. 2016;280(2):500-509. doi:10.1148/radiol.20161517893.
3. Tibrewala R, Pedoia V, Lee J, et al. Automatic hip abductor muscle fat fraction estimation and association with early OA cartilage degeneration biomarkers. J Orthop Res Off Publ Orthop Res Soc. 2021;39(11):2376-2387. doi:10.1002/jor.249744.
4. Kumar D, Karampinos DC, MacLeod TD, et al. Quadriceps intramuscular fat fraction rather than muscle size is associated with knee osteoarthritis. Osteoarthr Cartil OARS Osteoarthr Res Soc. 2014;22(2):226-234. doi:10.1016/j.joca.2013.12.0055.
5. Reeder SB, Pineda AR, Wen Z, et al. Iterative decomposition of water and fat with echo asymmetry and least-squares estimation (IDEAL): application with fast spin-echo imaging. Magn Reson Med. 2005;54(3):636-644. doi:10.1002/mrm.206246.
6. Reeder SB, McKenzie CA, Pineda AR, et al. Water-fat separation with IDEAL gradient-echo imaging. J Magn Reson Imaging JMRI. 2007;25(3):644-652. doi:10.1002/jmri.208317.
7. Tibrewala R, Pedoia V, Kinnunen C, Popovic T, Souza R, Majumdar S. Deep learning-based automatic estimation of volume and fat fraction in abductor muscles and their associations with T1RHO and T2 in hip osteoarthritis patients. Osteoarthritis Cartilage. 2019;27:S384-S385. doi:10.1016/j.joca.2019.02.3858.
8. version) JP (S, to 2007) DB (up, to 2002) SD (up, et al. nlme: Linear and Nonlinear Mixed Effects Models. Published online August 9, 2023. Accessed November 6, 2023. https://cran.r-project.org/web/packages/nlme/index.html9.
9. Nilsdotter AK, Lohmander LS, Klässbo M, Roos EM. Hip disability and osteoarthritis outcome score (HOOS)--validity and responsiveness in total hip replacement. BMC Musculoskelet Disord. 2003;4:10. doi:10.1186/1471-2474-4-1010.
10. Anderson DD, Chubinskaya S, Guilak F, et al. Post-traumatic osteoarthritis: Improved understanding and opportunities for early intervention. J Orthop Res. 2011;29(6):802-809. doi:10.1002/jor.2135911.
11. Conaghan PG, Kloppenburg M, Schett G, Bijlsma JWJ, EULAR osteoarthritis ad hoc committee. Osteoarthritis research priorities: a report from a EULAR ad hoc expert committee. Ann Rheum Dis. 2014;73(8):1442-1445. doi:10.1136/annrheumdis-2013-20466012.
12. Ethgen O, Bruyère O, Richy F, Dardennes C, Reginster JY. Health-related quality of life in total hip and total knee arthroplasty. A qualitative and systematic review of the literature. J Bone Joint Surg Am. 2004;86(5):963-974. doi:10.2106/00004623-200405000-0001213.
13. Judge A, Arden NK, Batra RN, et al. The association of patient characteristics and surgical variables on symptoms of pain and function over 5 years following primary hip-replacement surgery: a prospective cohort study. BMJ Open. 2013;3(3):e002453. doi:10.1136/bmjopen-2012-00245314.
14. Nam D, Nunley RM, Sauber TJ, Johnson SR, Brooks PJ, Barrack RL. Incidence and Location of Pain in Young, Active Patients Following Hip Arthroplasty. J Arthroplasty. 2015;30(11):1971-1975. doi:10.1016/j.arth.2015.05.03015.
15. Beswick AD, Wylde V, Gooberman-Hill R, Blom A, Dieppe P. What proportion of patients report long-term pain after total hip or knee replacement for osteoarthritis? A systematic review of prospective studies in unselected patients. BMJ Open. 2012;2(1):e000435. doi:10.1136/bmjopen-2011-00043516.
16. Deshmukh S, Abboud SF, Grant T, Omar IM. High-resolution ultrasound of the fascia lata iliac crest attachment: anatomy, pathology, and image-guided treatment. Skeletal Radiol. 2019;48(9):1315-1321. doi:10.1007/s00256-018-3141-z
Figures