2280
Non-Contrast MR Perfusion Imaging of the Hip1University of California, San Diego, La Jolla, CA, United States, 2VA San Diego Healthcare System, San Diego, CA, United States
Synopsis
Keywords: Bone, Perfusion, Hip, avascular necrosis, blood flow
Motivation: Avascular necrosis of the hip is due to disturbed blood supply related to various causes. Early evaluation currently requires contrast enhanced MR perfusion imaging.
Goal(s): Evaluate human hip perfusion using non-contrast MR perfusion technique.
Approach: Bilateral hips of healthy volunteers were imaged coronally at 3-T using a 2D spin labeling MR perfusion technique using tag-on tag-off acquisition at varying TI and processing to determine tagged blood signal into the acetabulum, femoral head, and femoral neck.
Results: We found distinct perfusion signal in the acetabulum but the signal in the femoral head and neck were more subdued.
Impact: This study demonstrates the feasibility of non-contrast MR perfusion imaging of the human hip, with future application in evaluation of avascular necrosis.
INTRODUCTION
Normal blood flow to the human hip bones including femoral head and neck are disturbed in avascular necrosis of the hip, resulting in hip osteoarthritis and eventual surgery.1 It could occur as a result of trauma or due to use of certain medication or excessive alcohol intake. While there is no cure, an early diagnosis can increase chances of nonsurgical interventions. Conventional MRI such as spin echo T1-weighted sequence can reveal abnormal low intensity patterns in the bone marrow,2 but this may represent a late phase after necrotic changes have taken place. We developed a non-contrast arterial spin labeling perfusion technique for the hip region that may be suitable for AVascular Necrosis (AVN) imaging.METHODS
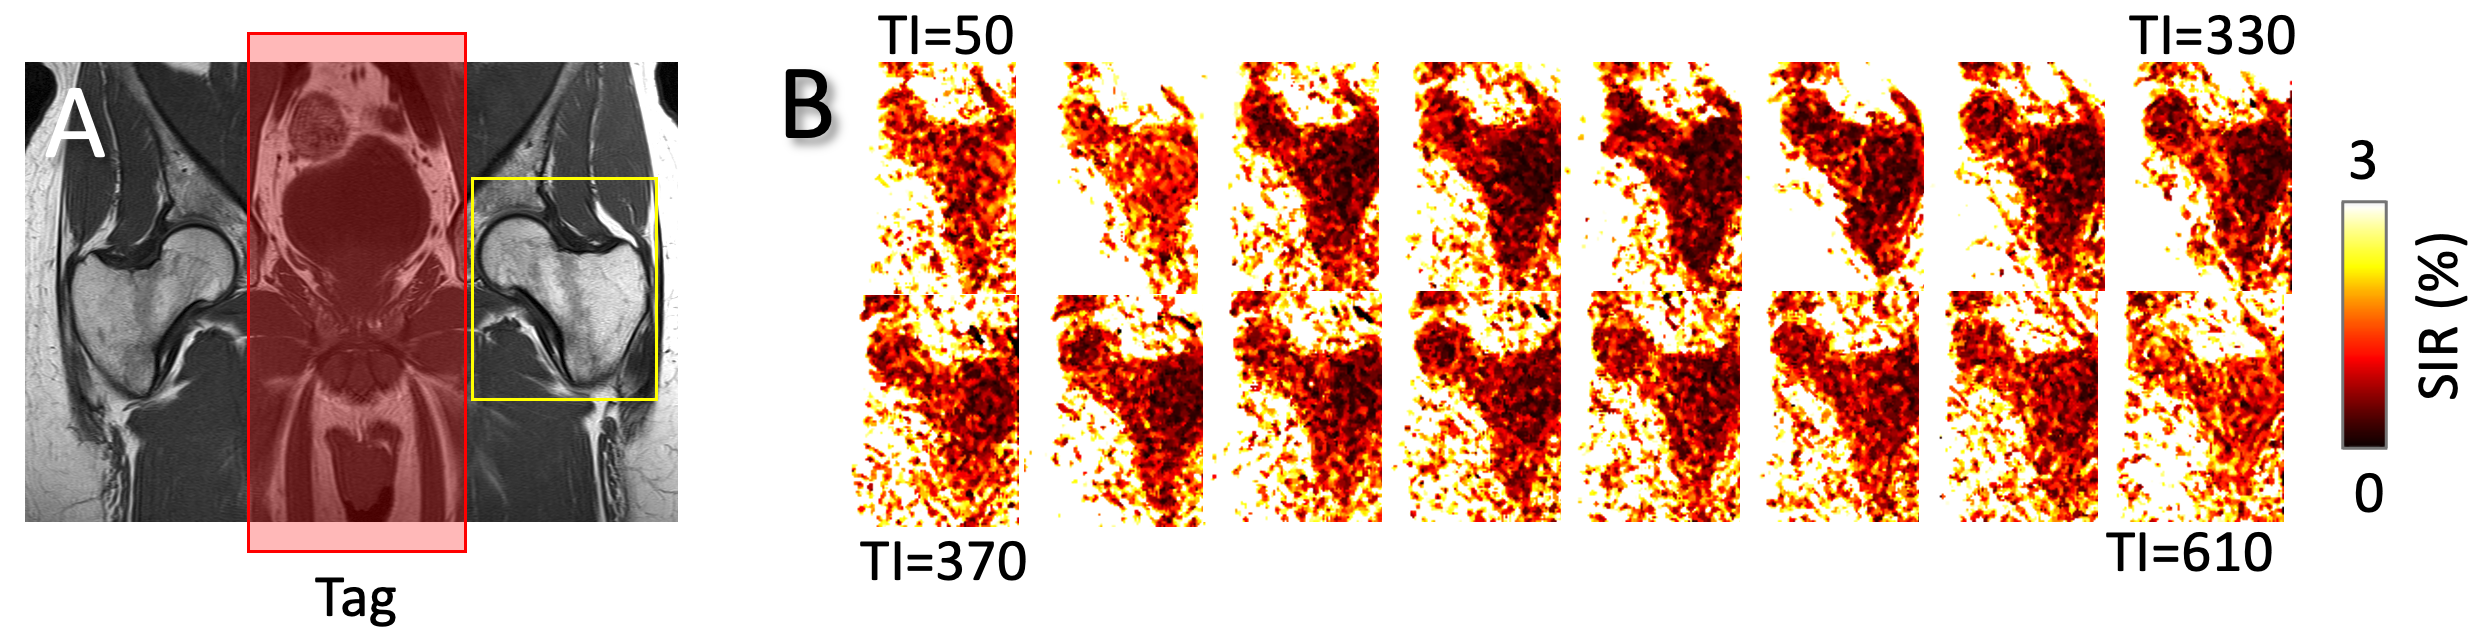
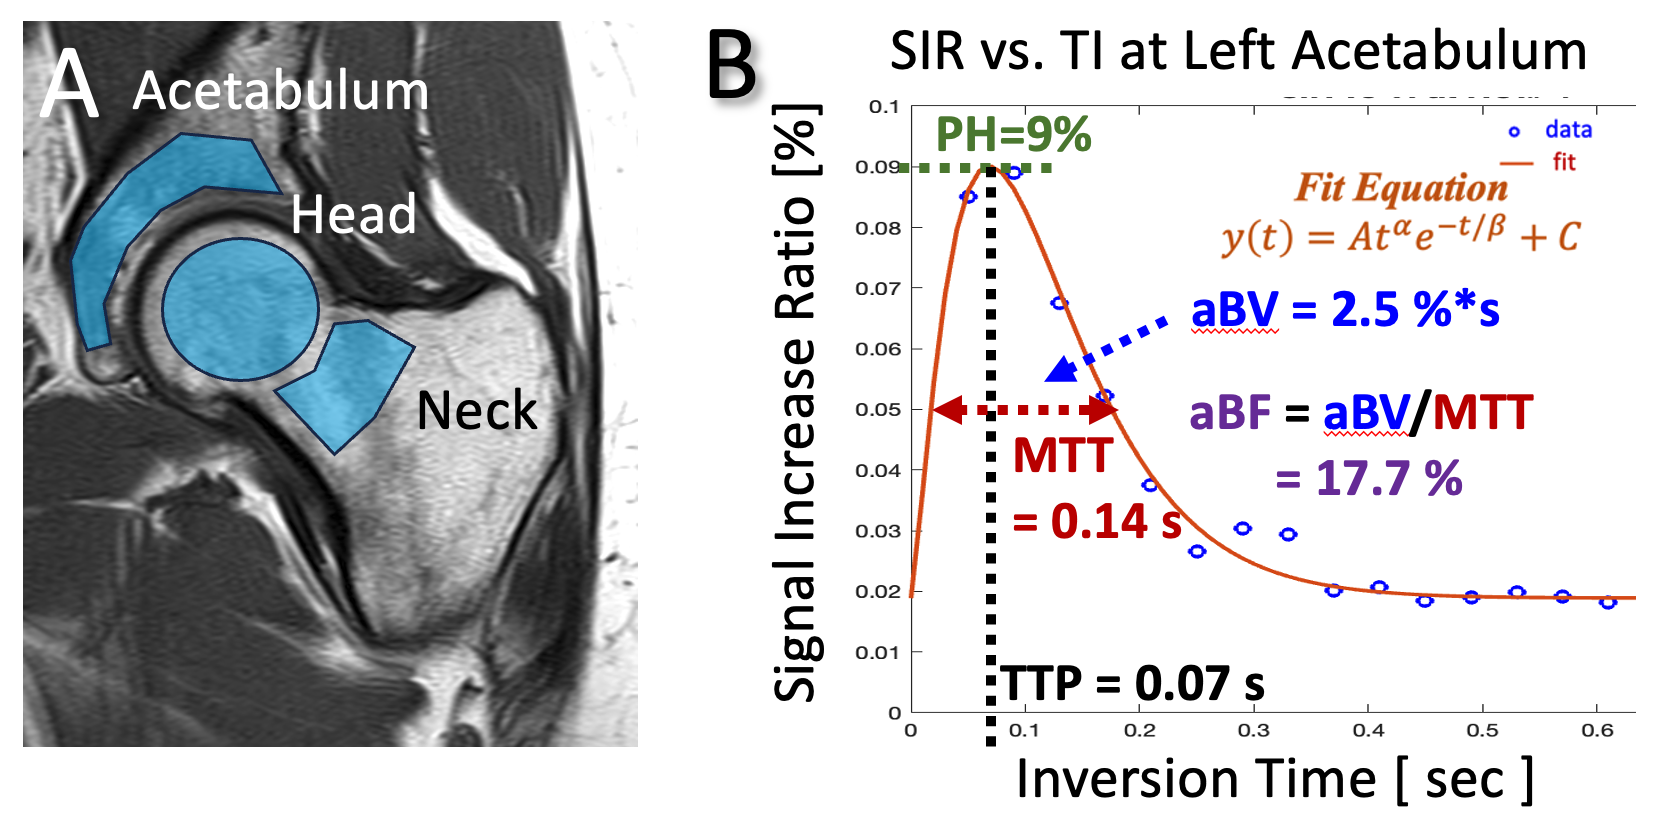
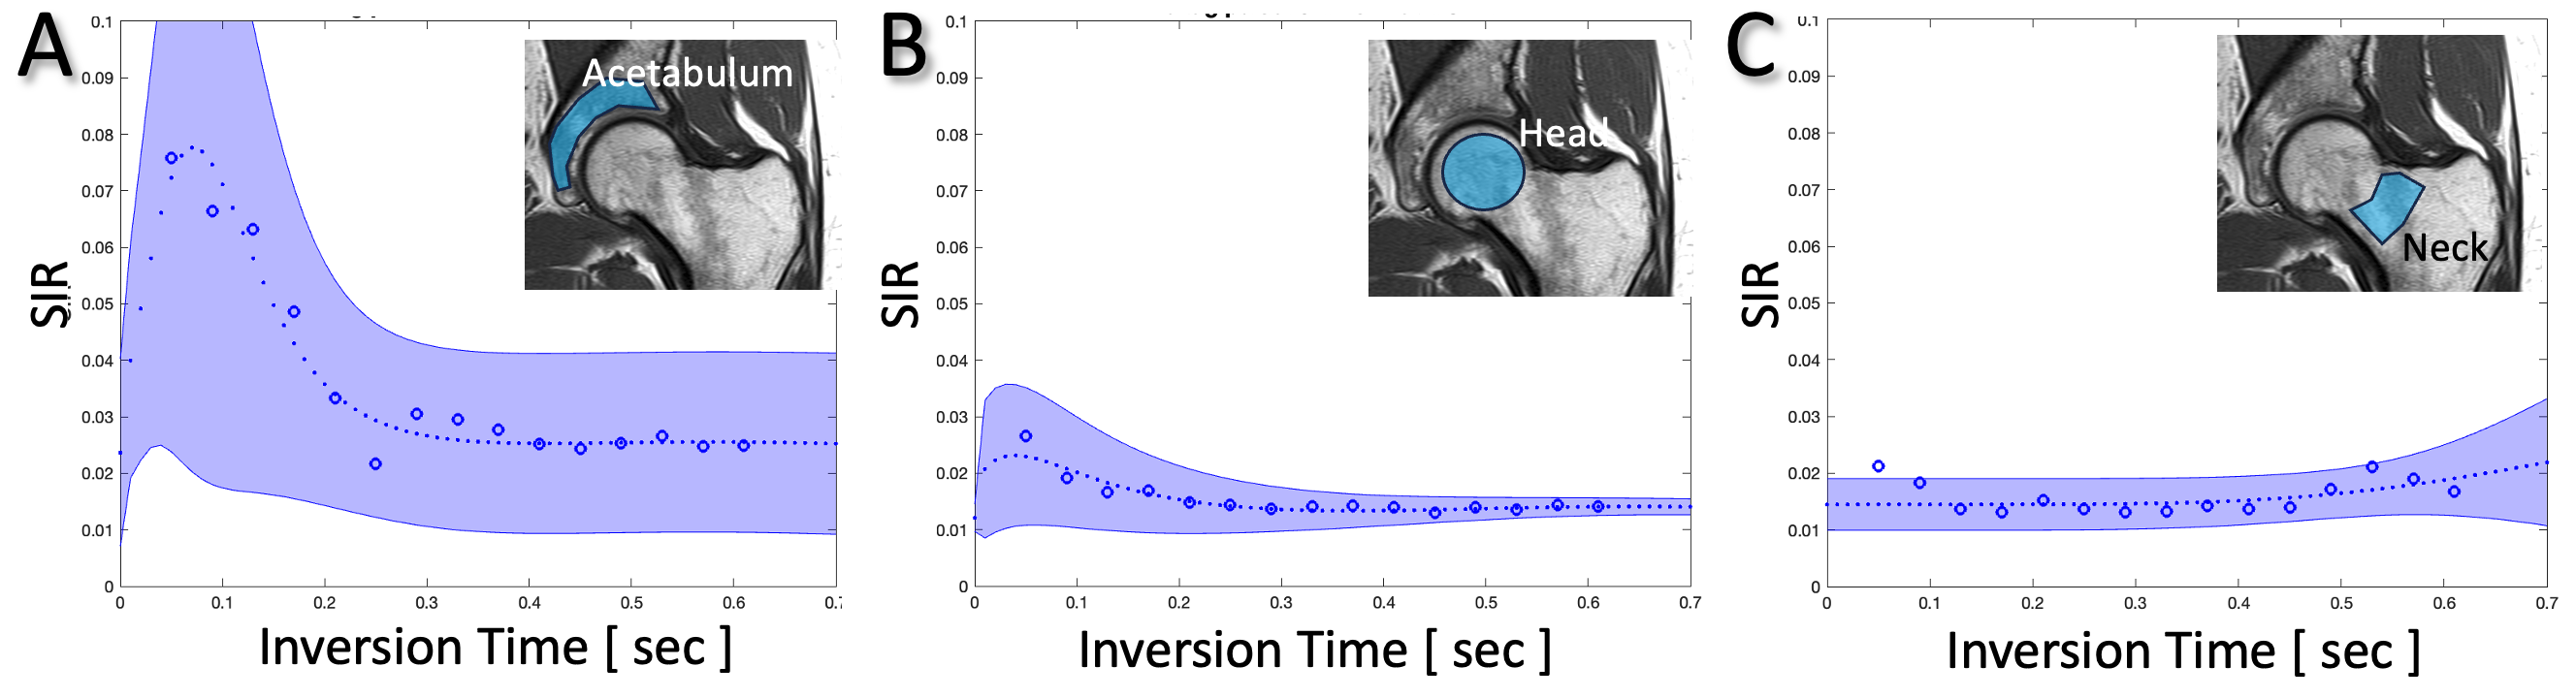
MRI: Bilateral hips of three healthy volunteers (n=3, 1 female, 35.3 ± 12.9 years old) were imaged coronally at 3-T (Canon Galan) with a posterior spine coil and an anterior body coil. One anatomical and a non-contrast perfusion sequence were used: (1) fast spin echo T1 weighted: TR=750 ms, TE=10 ms, FOV=340x226 mm, matrix=384x256, slice=4 mm, ETL=2; (2) The flow-out spin labeling MR perfusion technique uses two-dimensional (2D) single shot fast spin echo (SSFSE) or half-Fourier fast spin echo read-out: TR=4536 ms, TE= 60 ms, TI=50, 90, 130, …, 610 ms, FOV=300x300 mm, matrix=256x256, slice=15 mm, ETL=116. Figure 1A shows the T1 image, overlaid with the location of the tag pulse (Figure 1A red box, chosen to tag the aorta to iliac arteries) consisting of non-selective and a selective IR pulse which inverts the groin region to -Mz. The tag-off acquisition is then performed with a non-selective IR pulse. Perfusion Processing: To determine time-series perfusion signal, the acquisitions at varying TI times (from 50 to 610 ms in 40 ms increments) were normalized by first subtracting tag-on and -off images, then dividing by tag-off image at the maximum TI. This yielded Signal Increase Ratio (SIR) at each voxel at each TI (Figure 1B). We created 3 regions of interest for the acetabulum, femoral head, and femoral neck (Figure 2A) and performed fitting of the mean SIR versus TI data using a gamma variate function4 (Figure 2B) to determine perfusion metrics of peak height (PH), time to peak (TTP), mean transit time (MTT), apparent blood volume (aBV) and apparent blood flow (aBF). The mean and standard deviation values for each ROI was determined (Table 1). Additionally for each ROI, average SIR vs. TI curves were created (Figure 3).RESULTS
Using the non-contrast MR perfusion technique, SIR versus TI data showed different curves for each ROI. For the acetabulum (Figure 2B, 3A) and femoral head (Figure 3B), we observed a quickly rising signal that peaked around 0.05 sec and fell quickly to baseline by 0.3~0.4 sec. While the behavior was similar, acetabulum SIR had a much higher peak than SIR at the femoral head. Femoral neck was similar to femoral head but appeared to have secondary rise in SIR around 0.55 sec (Figure 3C). Perfusion metrics (Table 1) reflected these observations. The mean PH was the highest for acetabulum (9.9%), then femoral head (3.0%), followed by femoral neck (2.2%). TTP values were ~0.05 sec for acetabulum and femoral head, but ~0.7 sec for femoral neck. High PH value also resulted in a high mean aBF value for the acetabulum (24.6%), compared to the head (10.8%) and the neck (11.6%).CONCLUSION
These results demonstrate the feasibility of non-contrast MR perfusion imaging of the human hip. We analyzed different ROI that are of interest clinically. Additional work is needed to find optimal tagging position to determine if all parts of the hip receive the tagged blood. Additional normal subjects are needed to determine normative values, and imaging in AVN patients in varying stages is needed to show clinical applicability. Nonetheless, this study shows a promising alternative to conventional contrast enhanced imaging.Acknowledgements
Research reported in this publication was supported in part by a research grant from the National Institute of Health (P30 AR073761) in support of Dr. Bae and (R01HL154092) in support of Dr. Miyazaki. Dr. Miyazaki also received research grant support from Canon Medical Systems Corp., Japan (35938). The content is solely the responsibility of the authors and does not necessarily represent the official views of the sponsoring institutions.References
1. Wells ME, Dunn JC. Pathophysiology of Avascular Necrosis. Hand Clin 38: 367-376, 2022.
2. Bluemke DA, Zerhouni EA. MRI of avascular necrosis of bone. Top Magn Reson Imaging 8: 231-246, 1996.
Figures