2275
Streaking Artifact Reduction using Edge Detection (SARED) in Ultrashort Echo Time Quantitative Susceptibility Mapping (UTE-QSM)1University Hospital Heidelberg, Heidelberg, Germany, 2Harvard Medical School, Boston, MA, United States, 3University of California San Diego, San Diego, CA, United States
Synopsis
Keywords: Whole Joint, Joints, QSM, UTE, UTE-QSM, artifact reduction
Motivation: Quantitative susceptibility mapping (QSM) in MRI is valuable for characterizing tissue composition in the human body. Ultrashort echo time (UTE) is crucial for QSM of short T2 tissues in the musculoskeletal system.
Goal(s): As UTE-QSM is susceptible to motion-related streaking artifacts, our study aimed at reducing those artifacts.
Approach: A novel approach called Streaking Artifact Reduction using Edge Detection (SARED) is proposed to mitigate such artifacts. The method involves edge detection, exclusion of pixels near edges, and two-step QSM processing.
Results: Experimental results from knee and ankle joint imaging showed that SARED significantly reduces streaking artifacts, improving the accuracy of UTE-QSM.
Impact: The proposed Streaking Artifact Reduction using Edge Detection (SARED) approach significantly reduced motion-induced streaking artifacts in ultrashort echo time quantitative susceptibility mapping (UTE-QSM), enhancing accuracy in characterizing musculoskeletal tissues.
INTRODUCTION
Quantitative susceptibility mapping (QSM) has been investigated as a promising MRI technique for characterizing the biochemical composition of tissues in the human body1–5. To apply QSM to short T2 tissues in the musculoskeletal system, ultrashort echo time (UTE) imaging can be beneficial since it improves sensitivity to signals from tissues, such as tendons, ligaments or bone6–9. Data acquisition for UTE-QSM typically involves multiple repeated scans to achieve short echo spacing between UTE images. The multiple scans may cause unwanted motion between scans, known as inter-scan motion, leading to misregistration between images. This effect can adversely affect the accuracy of UTE-QSM due to streaking artifacts caused by motion-contaminated pixel-wise phase evolution, which becomes more critical near tissue boundaries. While motion registration can be beneficial, achieving perfect motion registration with images at different TEs with various T2-weighting and chemical shift artifacts is challenging. In this study, we demonstrate the feasibility of a novel approach to reduce motion-induced streaking artifacts in UTE-QSM, termed Streaking Artifact Reduction using Edge Detection (SARED), which takes into account information on tissue boundaries.METHODS
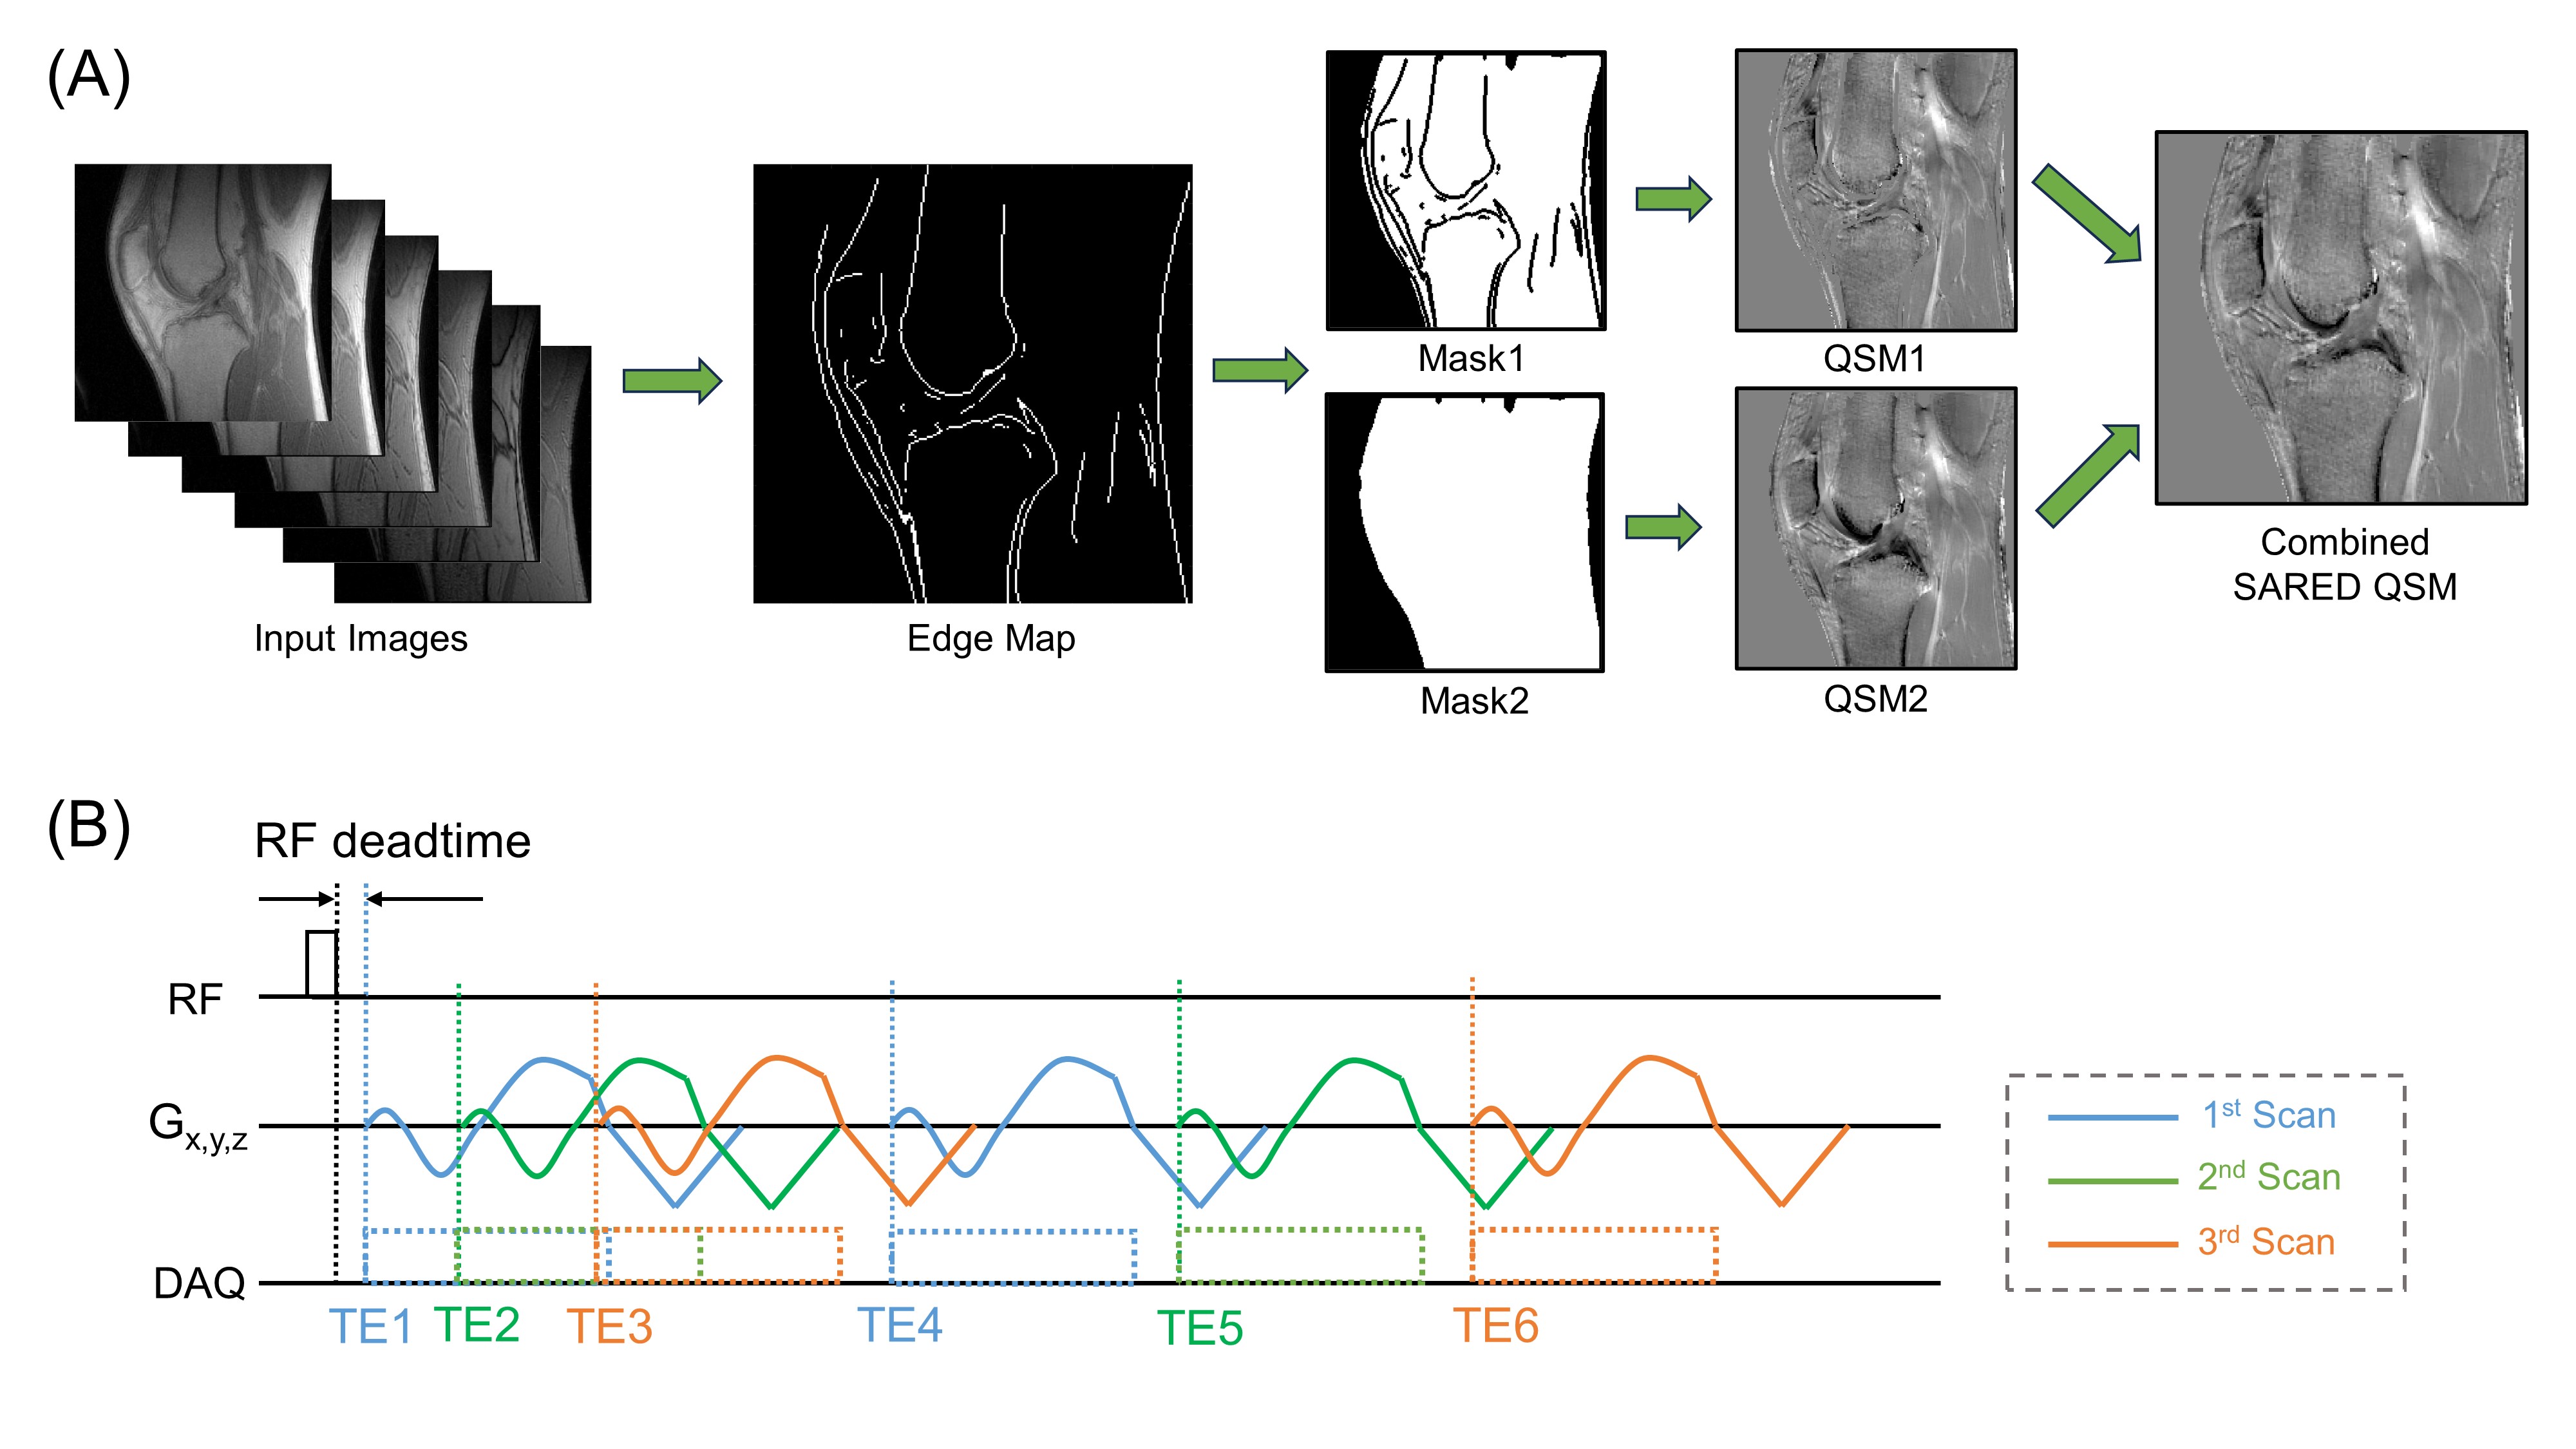
SARED QSM: Figure 1 illustrates the proposed SARED approach based on two-step UTE-QSM. First, image processing-based edge detection is applied to a UTE image to yield a line edge map. Pixels near the detected edge are excluded from the initial QSM process (QSM1) to prevent streaking artifacts caused by residual motions near the tissue boundary. A second QSM processing (QSM2) is conducted, including all tissue regions. Finally, any regions omitted from the initial QSM (i.e., tissue boundaries) are filled with susceptibility values estimated from QSM2.Experimental Setup: Eight healthy volunteers participated in knee joint UTE-QSM, and another seven healthy volunteers participated in ankle joint UTE-QSM. A dual-echo UTE sequence based on 3D cones trajectory (Figure 1B) was used in a 3T clinical MRI scanner (GE Healthcare, Milwaukee, WI, USA). To acquire six input images for UTE-QSM, three scans were performed in the manner of interleaved TEs. The imaging parameters were as follows: 1) Knee UTE-QSM: 8-channel T/R knee coil, FA=10°, TR=10ms, TE=0.032,0.2,0.6,2.7,3.7,4.7 ms, FOV=150x150x86.4 mm3, matrix=220x220x96; 2) Ankle UTE-QSM: 8-channel receive-only ankle coil, parameters matched with knee UTE-QSM. Scan time: 17 min each.
Data Processing: Matlab was used for data processing. First, all images were motion registered utilizing an Affine transform-based rigid registration algorithm. A 3D Canny eddy detection algorithm with a threshold of 0.3 was applied to the images at the last TE (4.7ms). Then, the initial edge map was processed with a morphological 3D dilation algorithm with a spherical structural element with a radius of 2 pixels to include the neighboring pixels. QSM was performed based on homemade Matlab code utilizing both IDEAL10 and MEDI11 algorithms. After completing the two-step QSM, the two susceptibility maps were merged using alpha blending with Gaussian filtering (sigma=1pixel). The estimated susceptibility values were assessed in various regions of interest (ROIs) within the knee and ankle joints, including the patellar and Achilles tendon, posterior cruciate ligament, meniscus, and muscles.
RESULTS
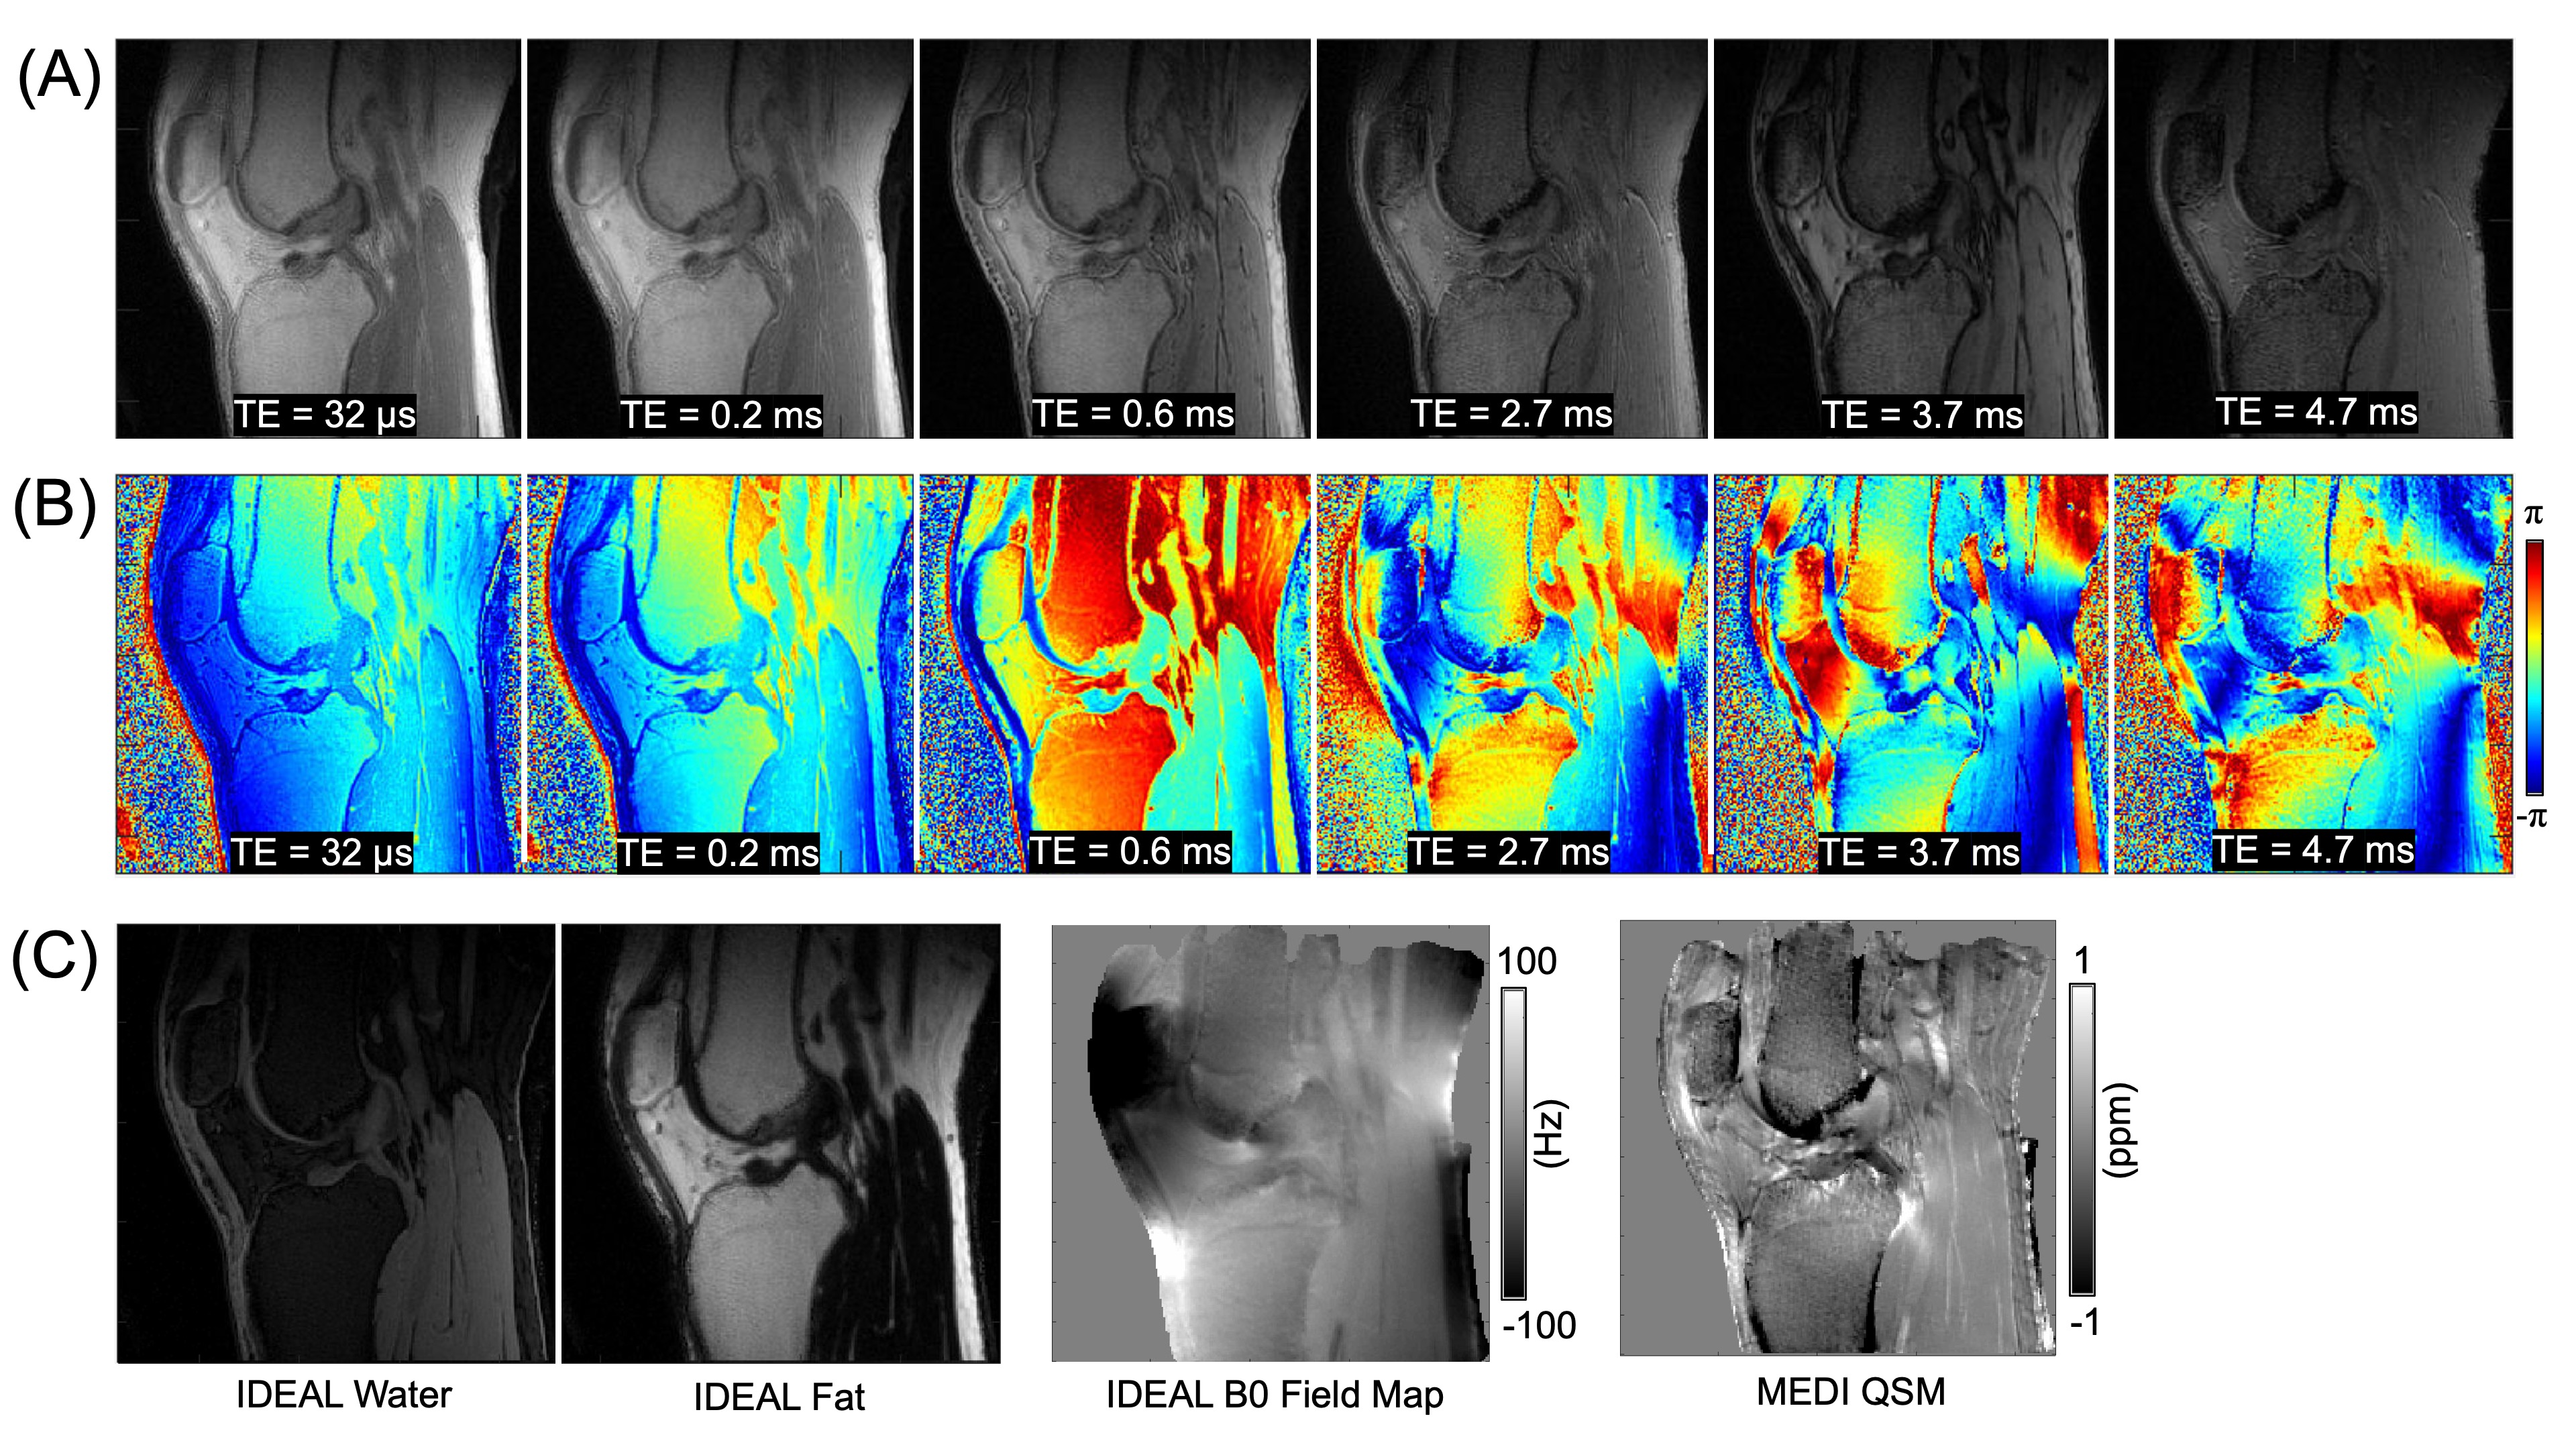
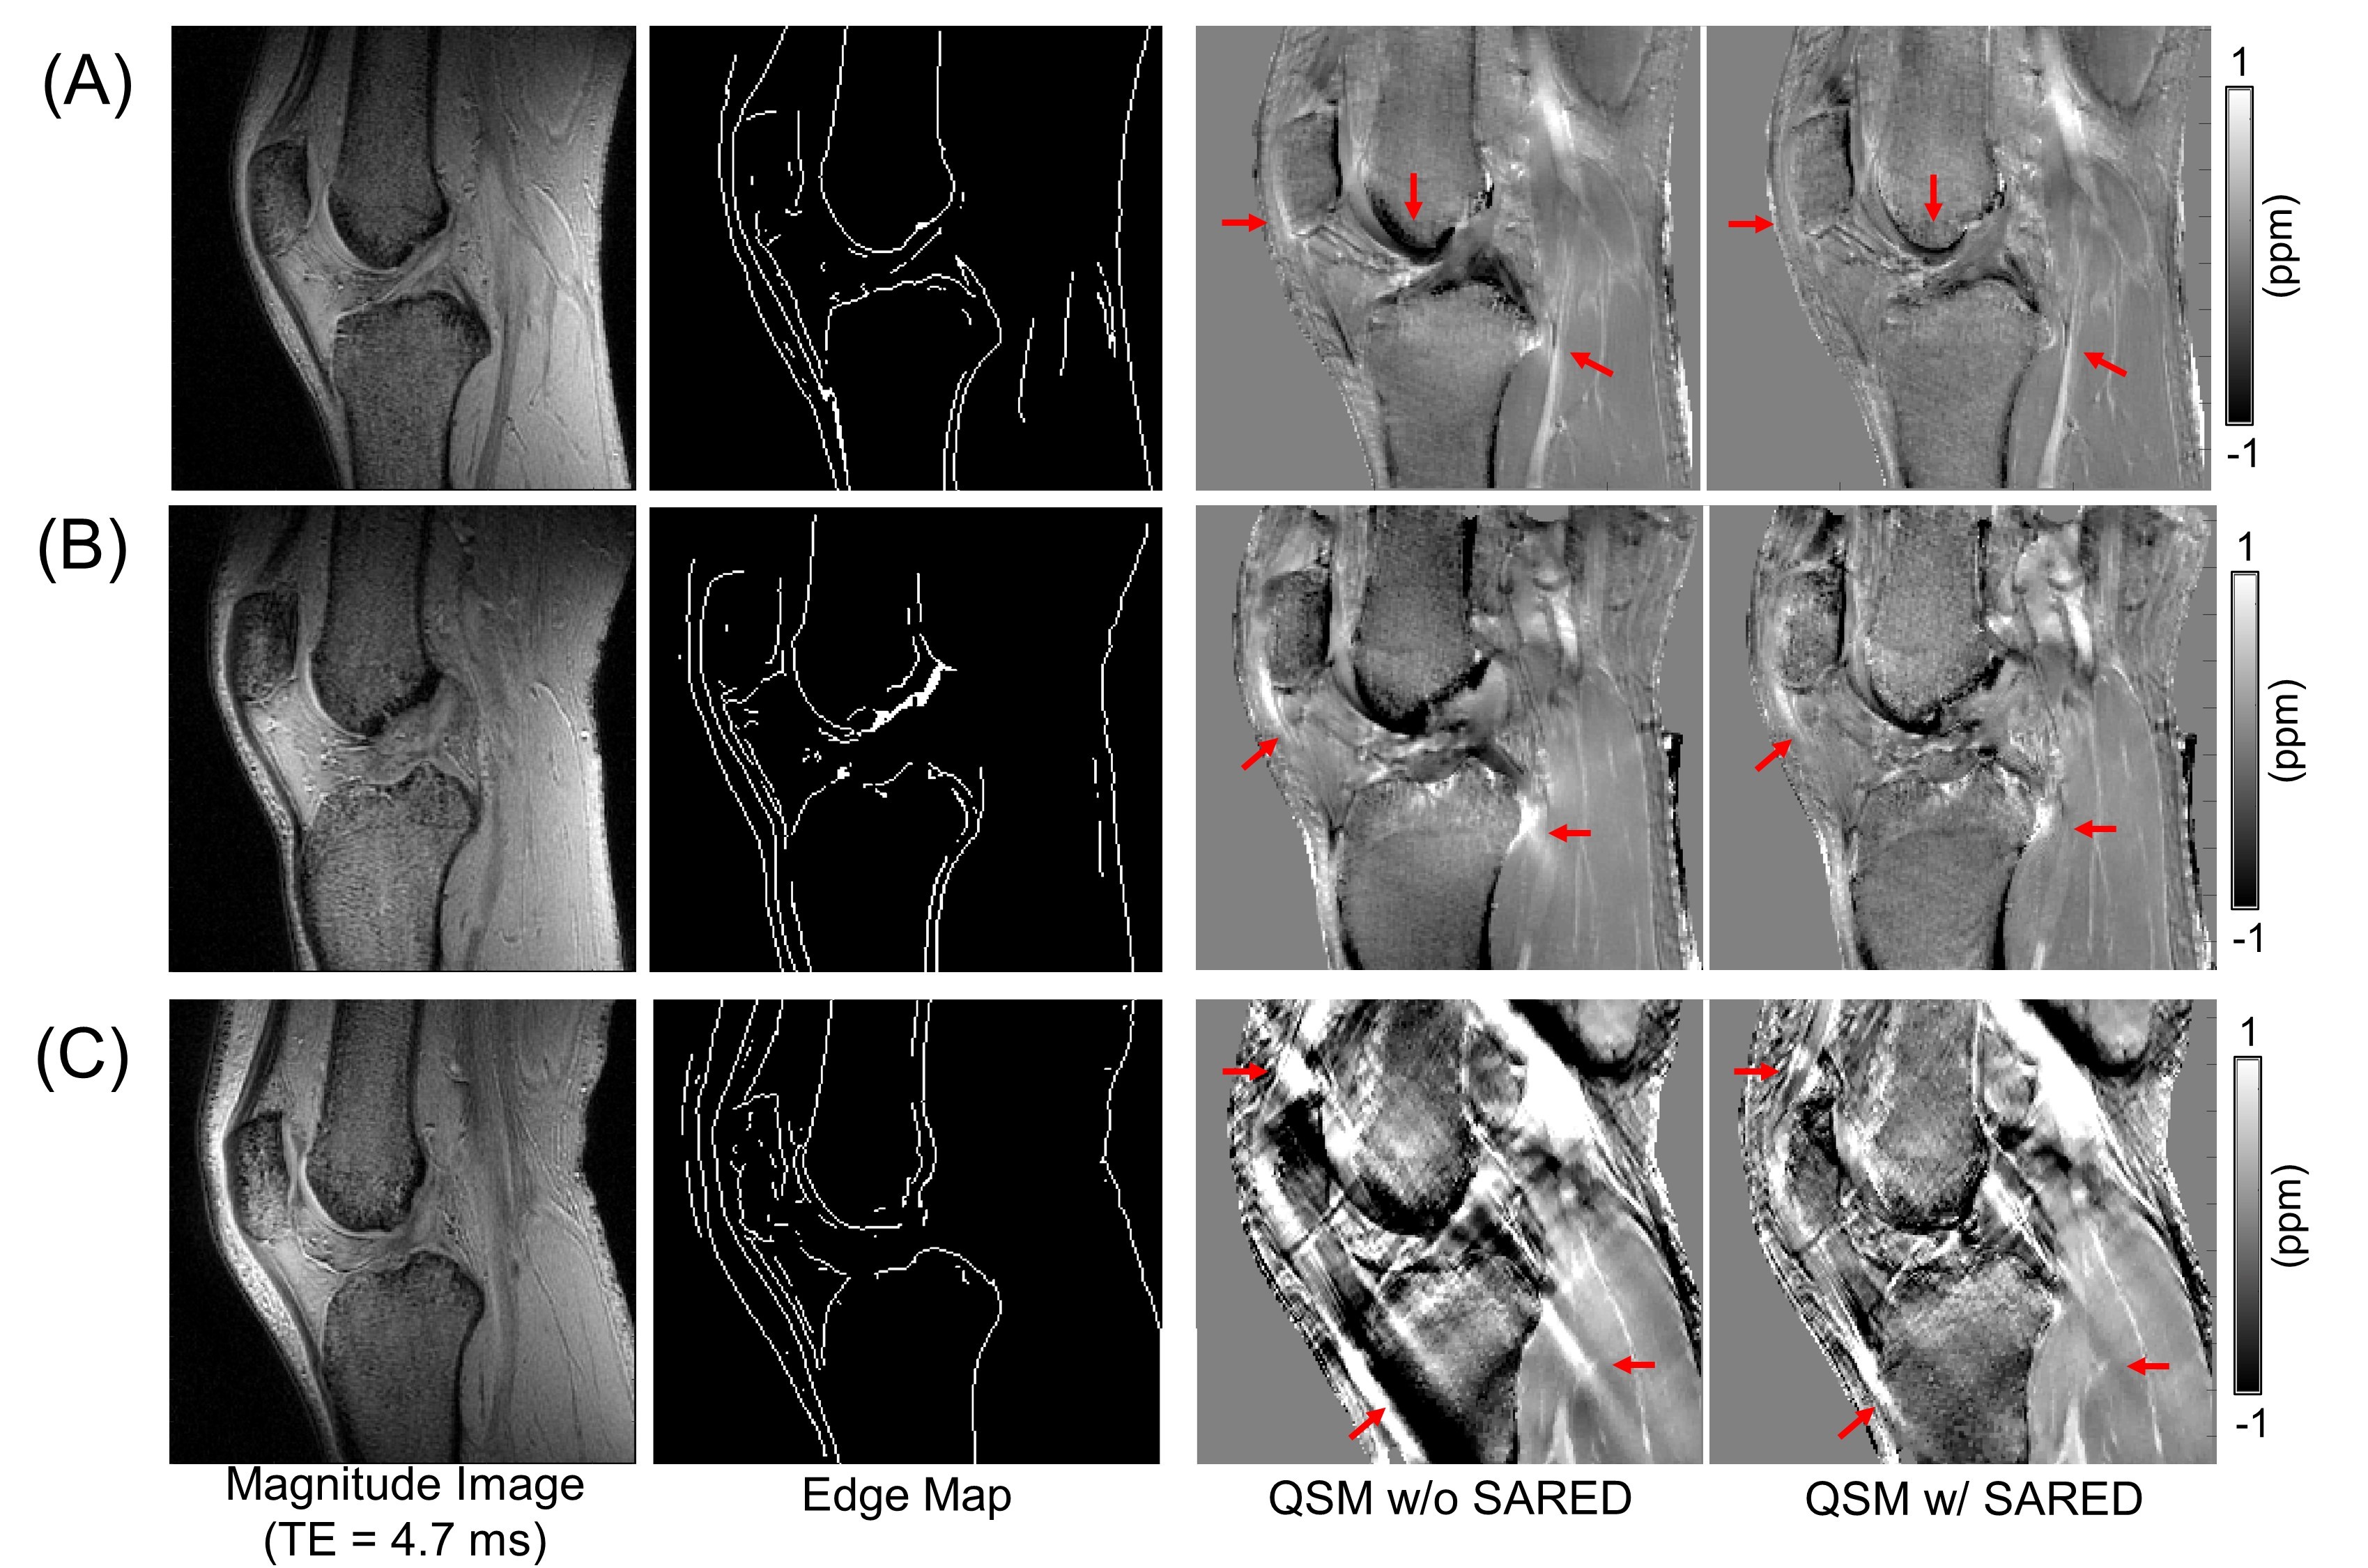
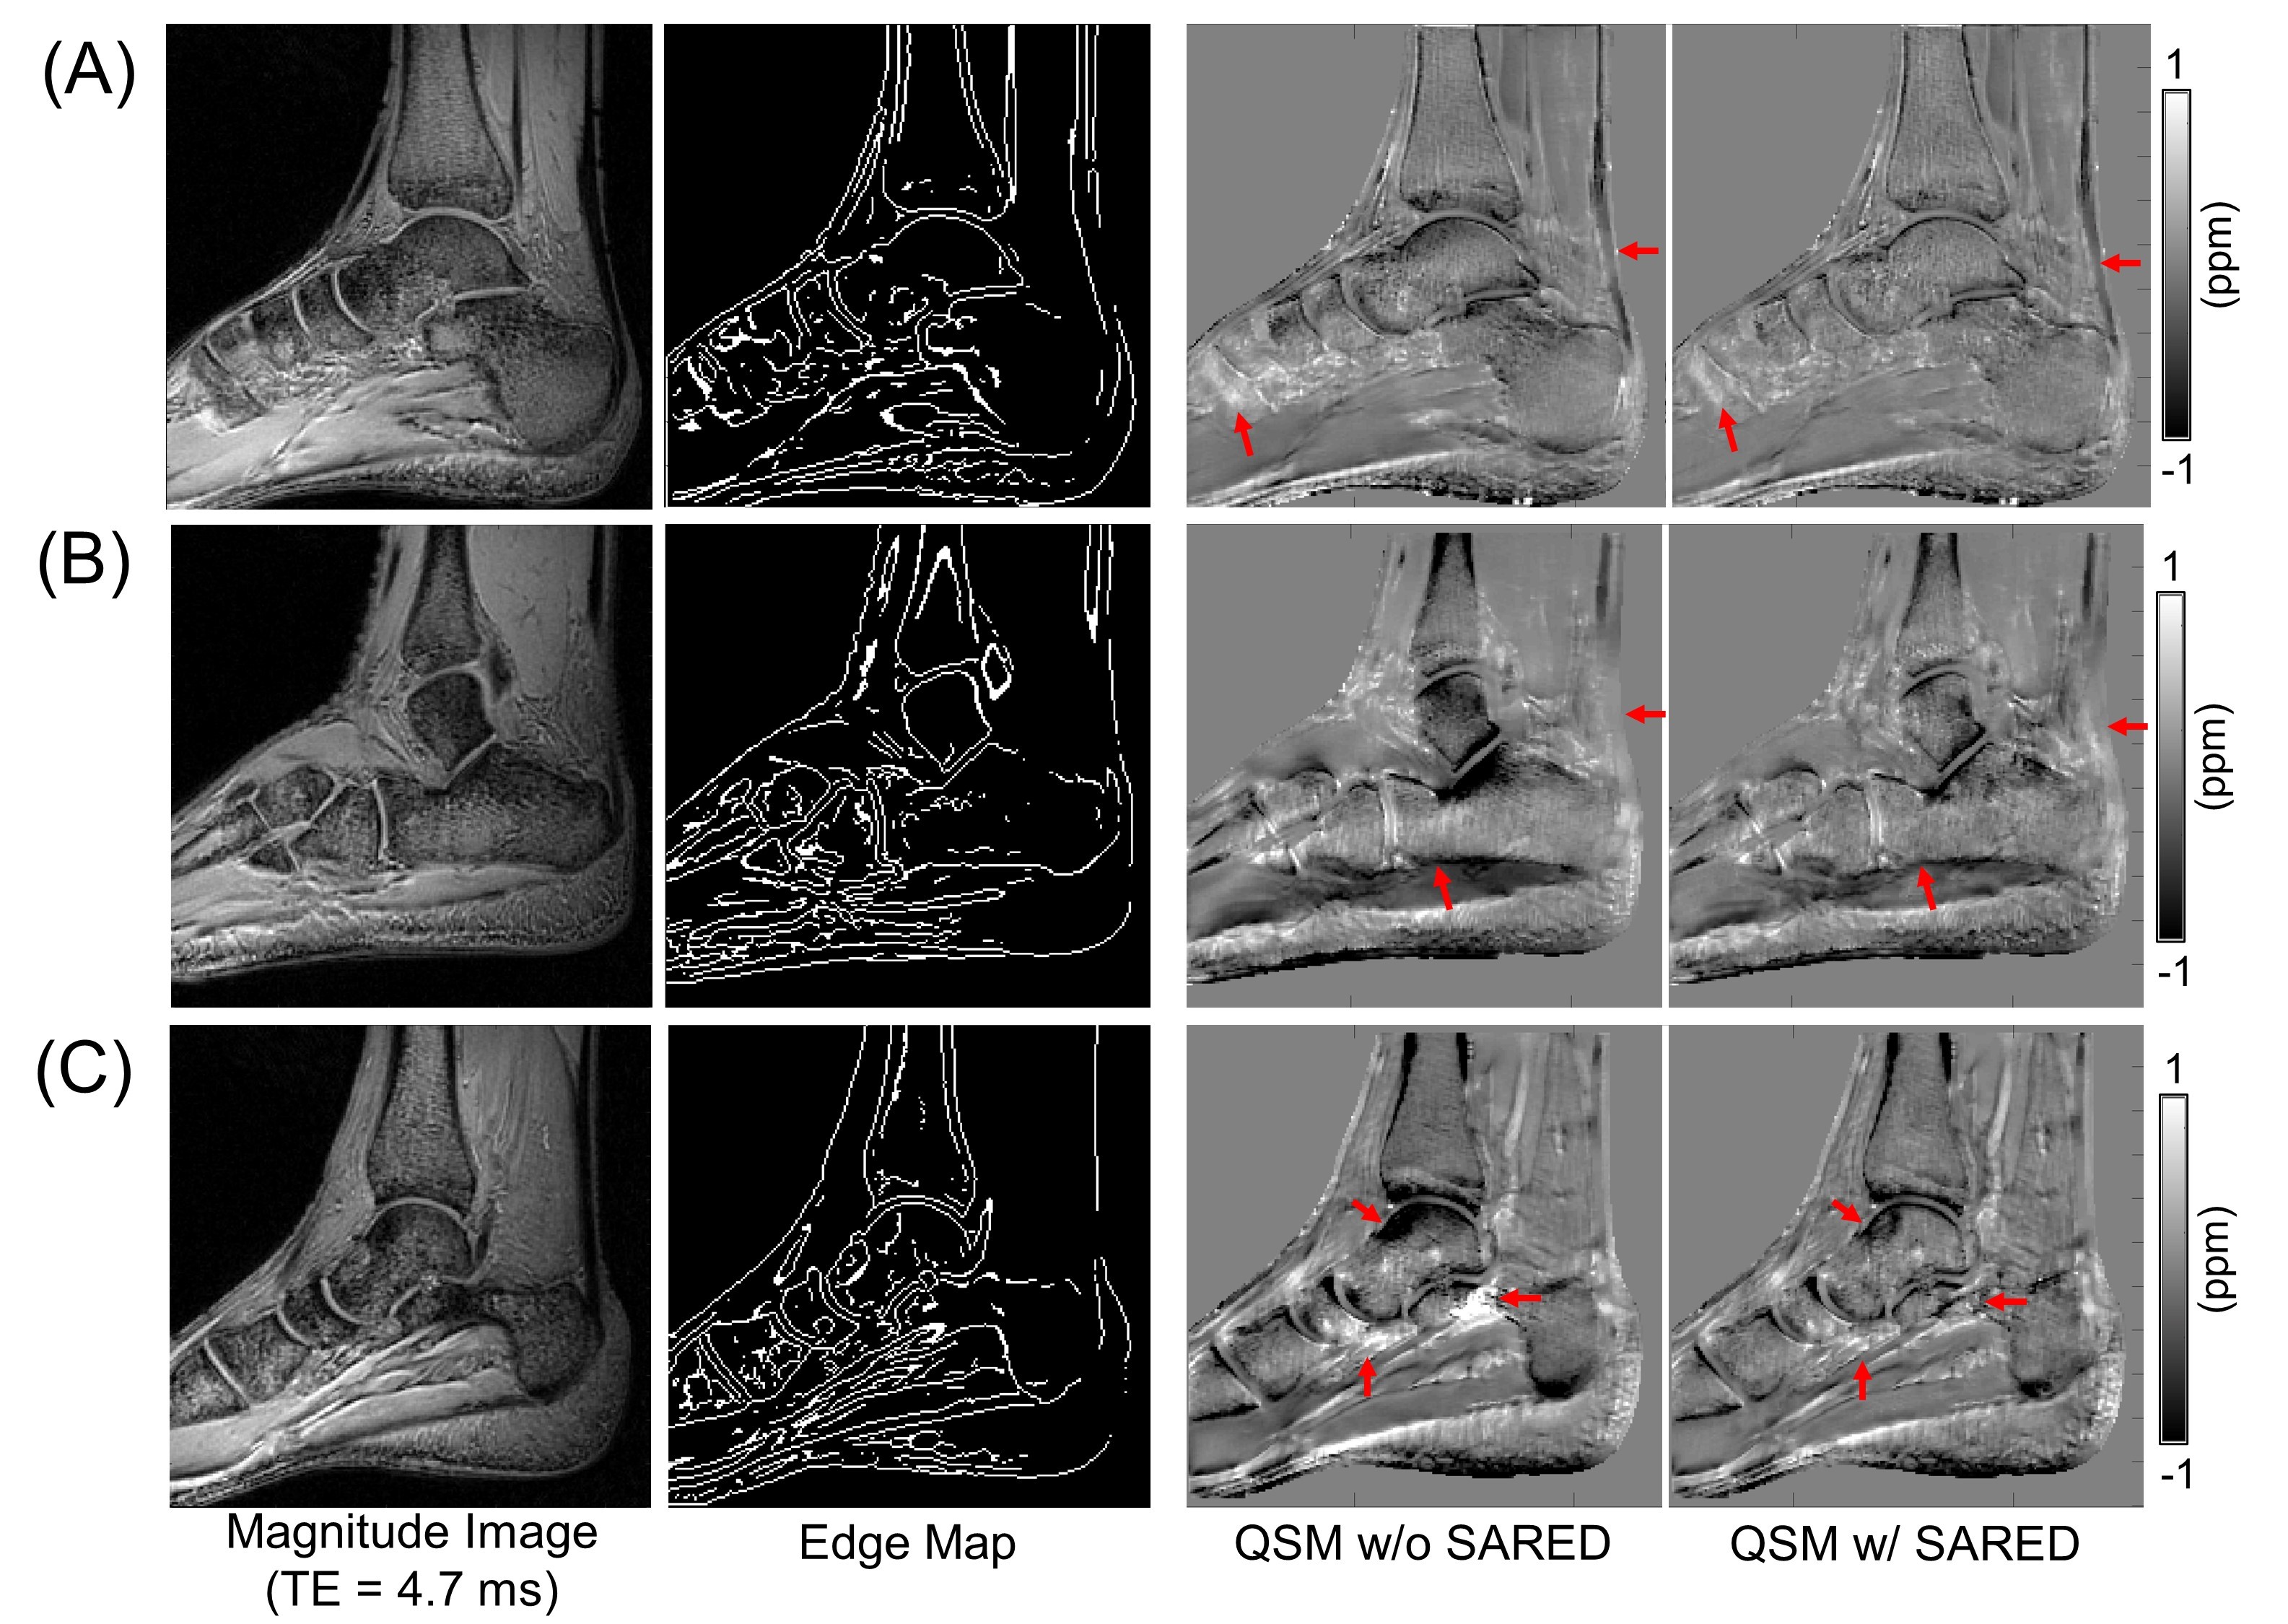
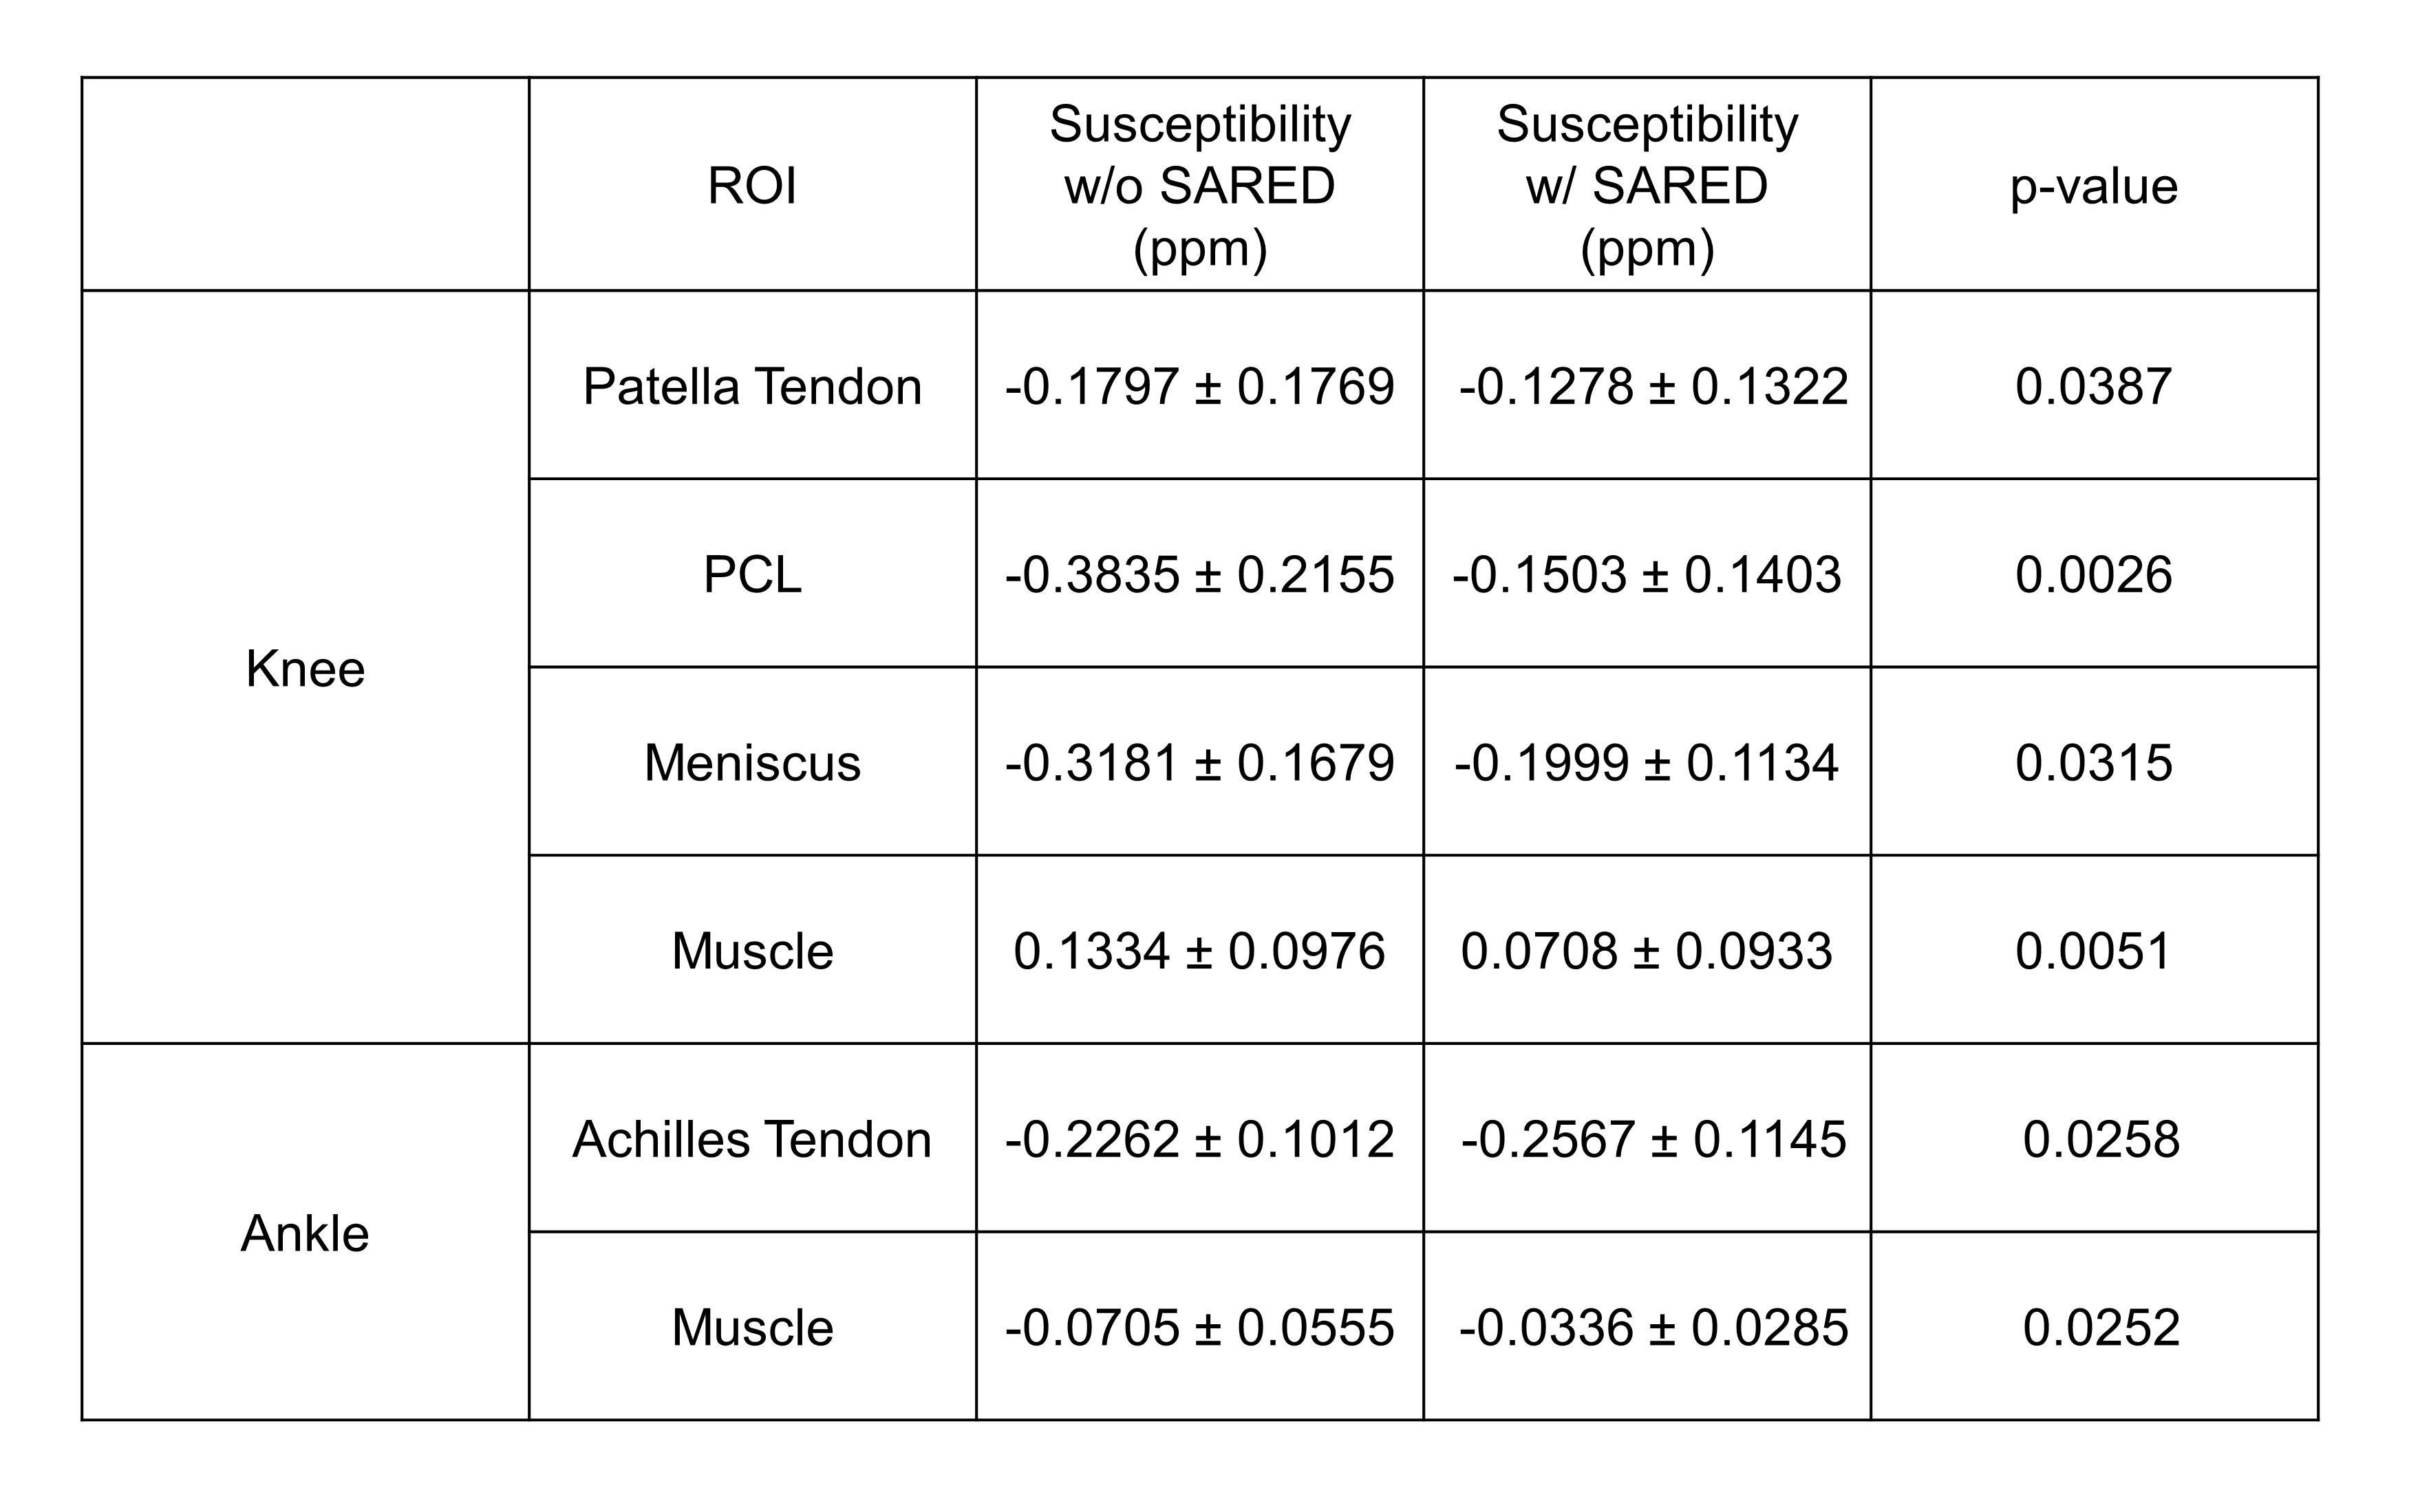
Figure 2 displays the magnitude and phase images obtained at six different TEs, along with the resultant field map from IDEAL and the susceptibility map from MEDI. Figures 3 and 4 illustrate UTE-QSM results with and without SARED in the knee and ankle joints from six representative subjects. SARED effectively reduced the streaking artifacts (highlighted by red arrows). Figure 5 presents susceptibility values estimated in all ROIs. SARED yielded significantly different results in all ROIs (p < 0.05).DISCUSSION AND CONCLUSION
Inter-scan motion is a major challenge in UTE-QSM due to the interleaved echo imaging scheme required for obtaining multiple UTE images with a short echo spacing (~200-300 µs). Unfortunately, achieving precise motion registration is difficult, especially in joints with complex kinetic movement. Non-rigid motion in soft tissues is particularly challenging. The uncorrected rigid and non-rigid motions can introduce critical errors in the phase evolution information, leading to strong streaking artifacts, particularly in pixels near tissue boundaries with strong susceptibility (e.g., bone) or a strong chemical shift (e.g., fat). The proposed SARED approach significantly improved UTE-QSM in musculoskeletal (MSK) imaging by suppressing streaking artifacts, as demonstrated in our study. While SARED effectively reduces the effect of streaking artifacts, it doesn't directly remove the source of error caused by misregistration. Therefore, when combined with more advanced registration methods like Elastix12,13, SARED is expected to deliver even better results. Other sources of errors causing streaking, such as low signal-to-noise ratio (SNR) and errors in the estimated B0 field map from IDEAL, will be further investigated in future studies to enhance UTE-QSM for MSK imaging.Acknowledgements
The authors acknowledge grant support from the NIH (R01AR078877), the DFG (SE 3272/1-1), and GE Healthcare.References
1. Wang Y, Liu T. Quantitative susceptibility mapping (QSM): Decoding MRI data for a tissue magnetic biomarker. Magn. Reson. Med. 2015;73:82–101 doi: 10.1002/mrm.25358.
2. Langkammer C, Liu T, Khalil M, et al. Quantitative Susceptibility Mapping in Multiple Sclerosis. Radiology 2013;267:551–559 doi: 10.1148/radiol.12120707.
3. Acosta-Cabronero J, Betts MJ, Cardenas-Blanco A, Yang S, Nestor PJ. In Vivo MRI Mapping of Brain Iron Deposition across the Adult Lifespan. J. Neurosci. 2016;36:364–374 doi: 10.1523/JNEUROSCI.1907-15.2016.
4. Deistung A, Schweser F, Wiestler B, et al. Quantitative Susceptibility Mapping Differentiates between Blood Depositions and Calcifications in Patients with Glioblastoma Kleinschnitz C, editor. PLoS One 2013;8:e57924 doi: 10.1371/journal.pone.0057924.
5. Liu S, Wang C, Zhang X, et al. Quantification of liver iron concentration using the apparent susceptibility of hepatic vessels. Quant. Imaging Med. Surg. 2018;8:123–134 doi: 10.21037/qims.2018.03.02.
6. Dimov A V., Liu Z, Spincemaille P, Prince MR, Du J, Wang Y. Bone quantitative susceptibility mapping using a chemical species-specific R2* signal model with ultrashort and conventional echo data. Magn. Reson. Med. 2018;79:121–128 doi: 10.1002/mrm.26648.
7. Jerban S, Lu X, Jang H, et al. Significant correlations between human cortical bone mineral density and quantitative susceptibility mapping (QSM) obtained with 3D Cones ultrashort echo time magnetic resonance imaging (UTE-MRI). Magn. Reson. Imaging 2019;62:104–110 doi: 10.1016/j.mri.2019.06.016.
8. Lu X, Jang H, Ma Y, Jerban S, Chang E, Du J. Ultrashort Echo Time Quantitative Susceptibility Mapping (UTE-QSM) of Highly Concentrated Magnetic Nanoparticles: A Comparison Study about Different Sampling Strategies. Molecules 2019;24:1143 doi: 10.3390/molecules24061143.
9. Jang H, Drygalski A, Wong J, et al. Ultrashort echo time quantitative susceptibility mapping (UTE‐QSM) for detection of hemosiderin deposition in hemophilic arthropathy: A feasibility study. Magn. Reson. Med. 2020;84:3246–3255 doi: 10.1002/mrm.28388.
10. Reeder SB, Pineda AR, Wen Z, et al. Iterative decomposition of water and fat with echo asymmetry and least-squares estimation (IDEAL): Application with fast spin-echo imaging. Magn. Reson. Med. 2005;54:636–644 doi: 10.1002/mrm.20624.
11. Liu J, Liu T, De Rochefort L, et al. Morphology enabled dipole inversion for quantitative susceptibility mapping using structural consistency between the magnitude image and the susceptibility map. Neuroimage 2012;59:2560–2568 doi: 10.1016/j.neuroimage.2011.08.082.
12. Klein S, Staring M, Murphy K, Viergever MA, Pluim JPW. Elastix: A toolbox for intensity-based medical image registration. IEEE Trans. Med. Imaging 2010;29:196–205 doi: 10.1109/TMI.2009.2035616.
13. Wu M, Zhao W, Wan L, et al. Quantitative three‐dimensional ultrashort echo time cones imaging of the knee joint with motion correction. NMR Biomed. 2020;33:1–11 doi: 10.1002/nbm.4214.
Figures