2272
Participant-informed finite element models of the tibia-fibula complex from MRI: sensitivity to material property definition1Department of Radiology, Stanford University, Stanford, CA, United States
Synopsis
Keywords: Bone, MSK, Bone stress, finite element modelling
Motivation: Finite element modeling could help us better understand the role of bone strain in stress fractures. MRI, the standard for diagnosis, characterizes geometry but not bone density.
Goal(s): To evaluate the sensitivity of finite element model-estimated strain to the use of generic material properties.
Approach: Finite element models of the tibia-fibula complex were created with heterogeneous (CT referent) or homogeneous (simulating MR) material properties. Errors in strain and percent changes across running stride length conditions were calculated.
Results: Strains were substantially underestimated by models using homogeneous material properties, but relative changes in peak strain between and within individuals illustrated strong agreement.
Impact: MRI can be used to explore relative changes in bone strain in healthy adults when CT is not available. This option improves the feasibility of using finite element modelling to study bone strain and will enable opportunistic studies.
Background
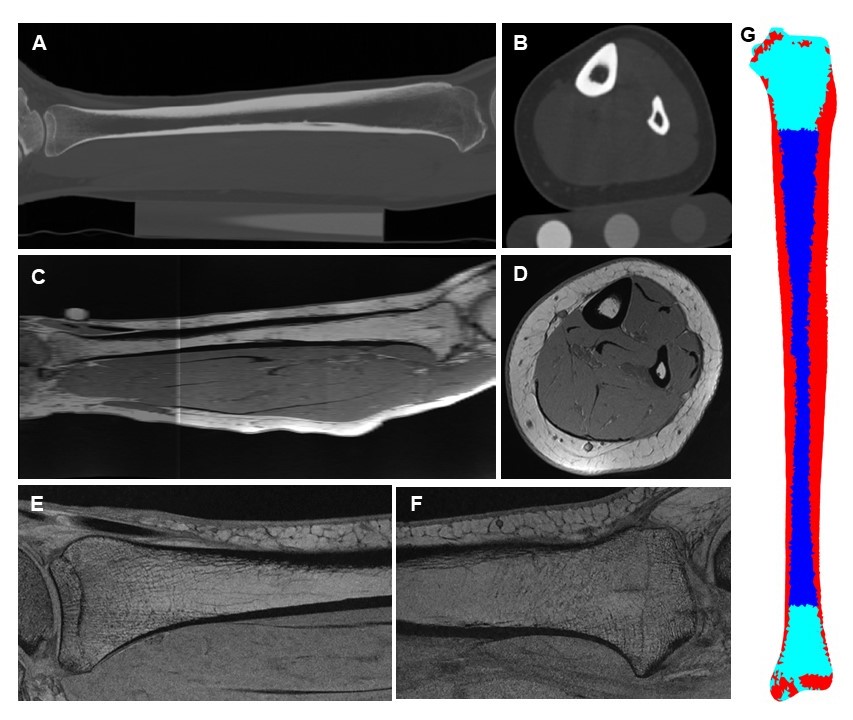
Stress fractures are common injuries among runners1,2. These injuries develop through mechanical fatigue, where repetitive, high magnitude loading with insufficient rest results in the accumulation of microdamage and an eventual fracture3. Strain magnitude, or some consequence thereof, is strongly related to mechanical fatigue4. The current state-of-the-art for estimating bone strain in vivo is participant-specific finite element (FE) analysis. Computed Tomography (CT) is most often used for FE analysis due to its ability to measure bone geometry and density distribution while magnetic resonance imaging (MRI) remains the reference standard for early detection of stress fractures due to its sensitivity to edema at the site of injury5,6. Thus there is interest in whether MRI can be used to study the role of bone strain in stress fractures without the need for CT. MRI enables characterization of three-dimensional bone geometry and cortical thickness, important factors influencing bone strain7, but cannot assess bone density distribution. The purpose of this study was to evaluate the sensitivity of FE model-estimated strain to the use of generic material properties in the tibia-fibula complex. For feasibility of MR bone geometry assessment, an MRI of the whole tibia was acquired using a 3D-SPGR sequence (Axial: 0.4x0.4x4.0mm3 Resolution, TE/TR: 1.8/6.9ms; Sagittal: 0.2x0.2x1.5mm3 resolution, TE/TR: 3.1/10.7ms).Methods
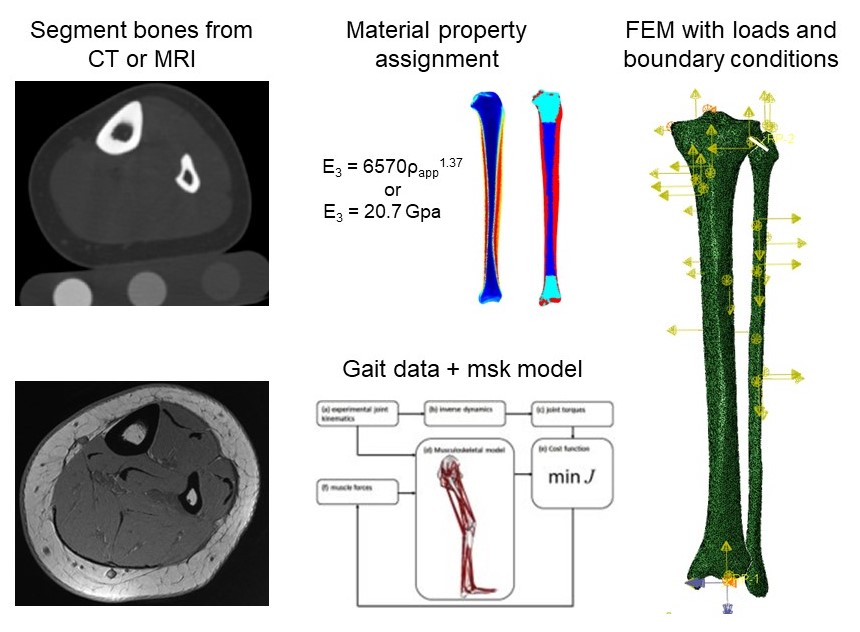
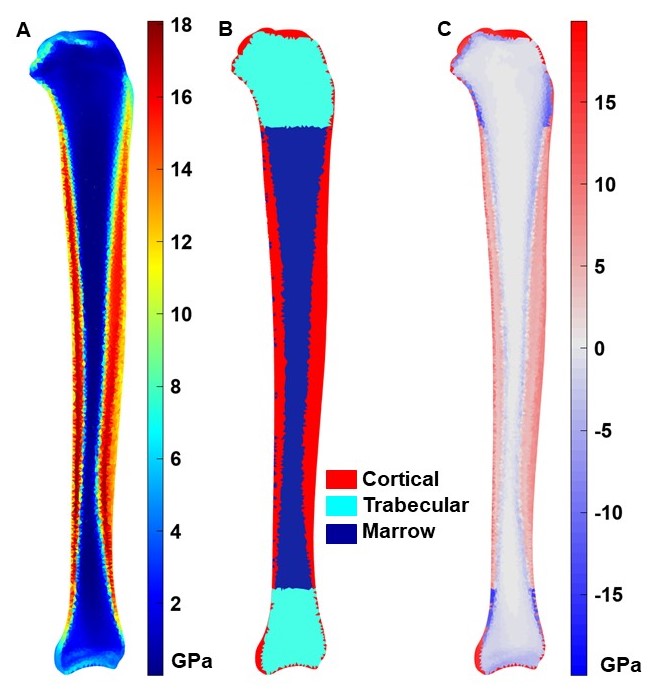
FE models of the tibia and fibula were generated from CT scans (GE Revolution GSI; in-plane: 0.48 × 0.48mm, slice thickness: 0.625mm) of twenty-seven physically active adults (14 female, 13 male, 23.0 ± 3.3 years) (Figure 1)7,8. Two sets of models were created with the same periosteal geometry and either (1) heterogeneous orthotropic material properties based on apparent density, or (2) homogeneous material properties for cortical bone, trabecular bone, and marrow9. The homogeneous property models simulated the information that could be characterized by MRI. Elements were labelled as cortical bone or marrow based on a threshold (1.4g/cm3), which was determined through a sensitivity analysis minimizing Young’s modulus errors. Elements in the proximal and distal 15% of the bones were categorized as trabecular bone, and all surface elements were categorized as cortical bone (Figure 2). Participant-specific ankle joint contact and eighteen muscle forces during running were then applied to the models. These forces were calculated using a musculoskeletal modelling approach and motion capture data of overground running at preferred speed and 0%, and ± 10% stride length conditions. Six models per participant were generated and solved in Abaqus (Dassault Systèmes Simulia Corp., USA). To date, processing for ten participants has been completed. 95th percentile (peak) pressure-modified von Mises strains and root mean square error (RMSE) relative to the heterogeneous material property model were calculated for surface strains on the tibial diaphysis, defined as 20-80% of the tibia’s axial length7.Results
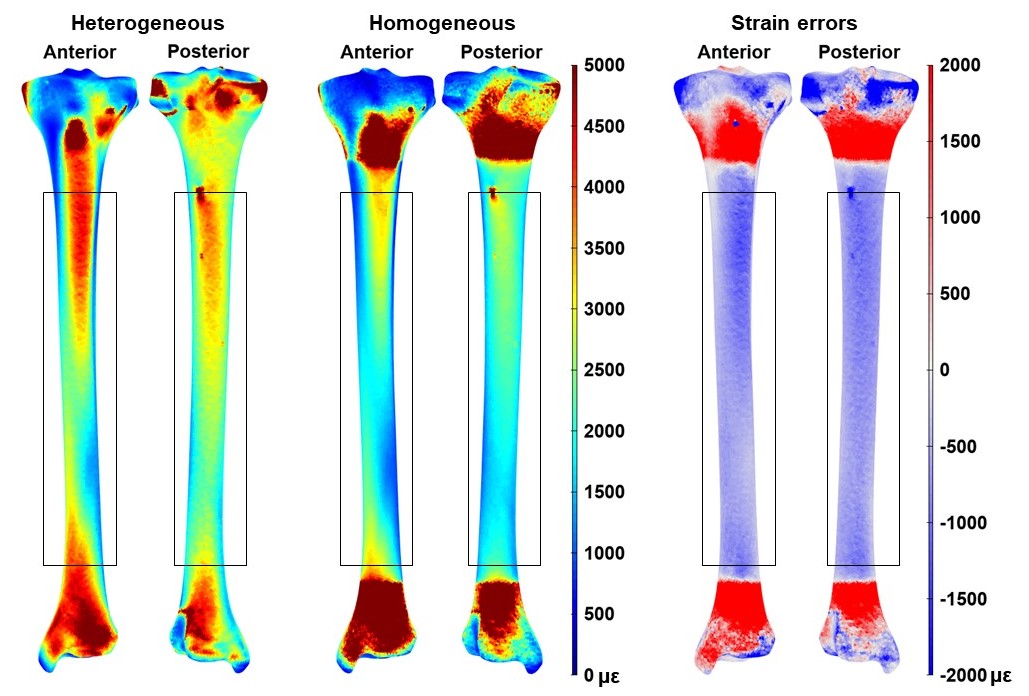
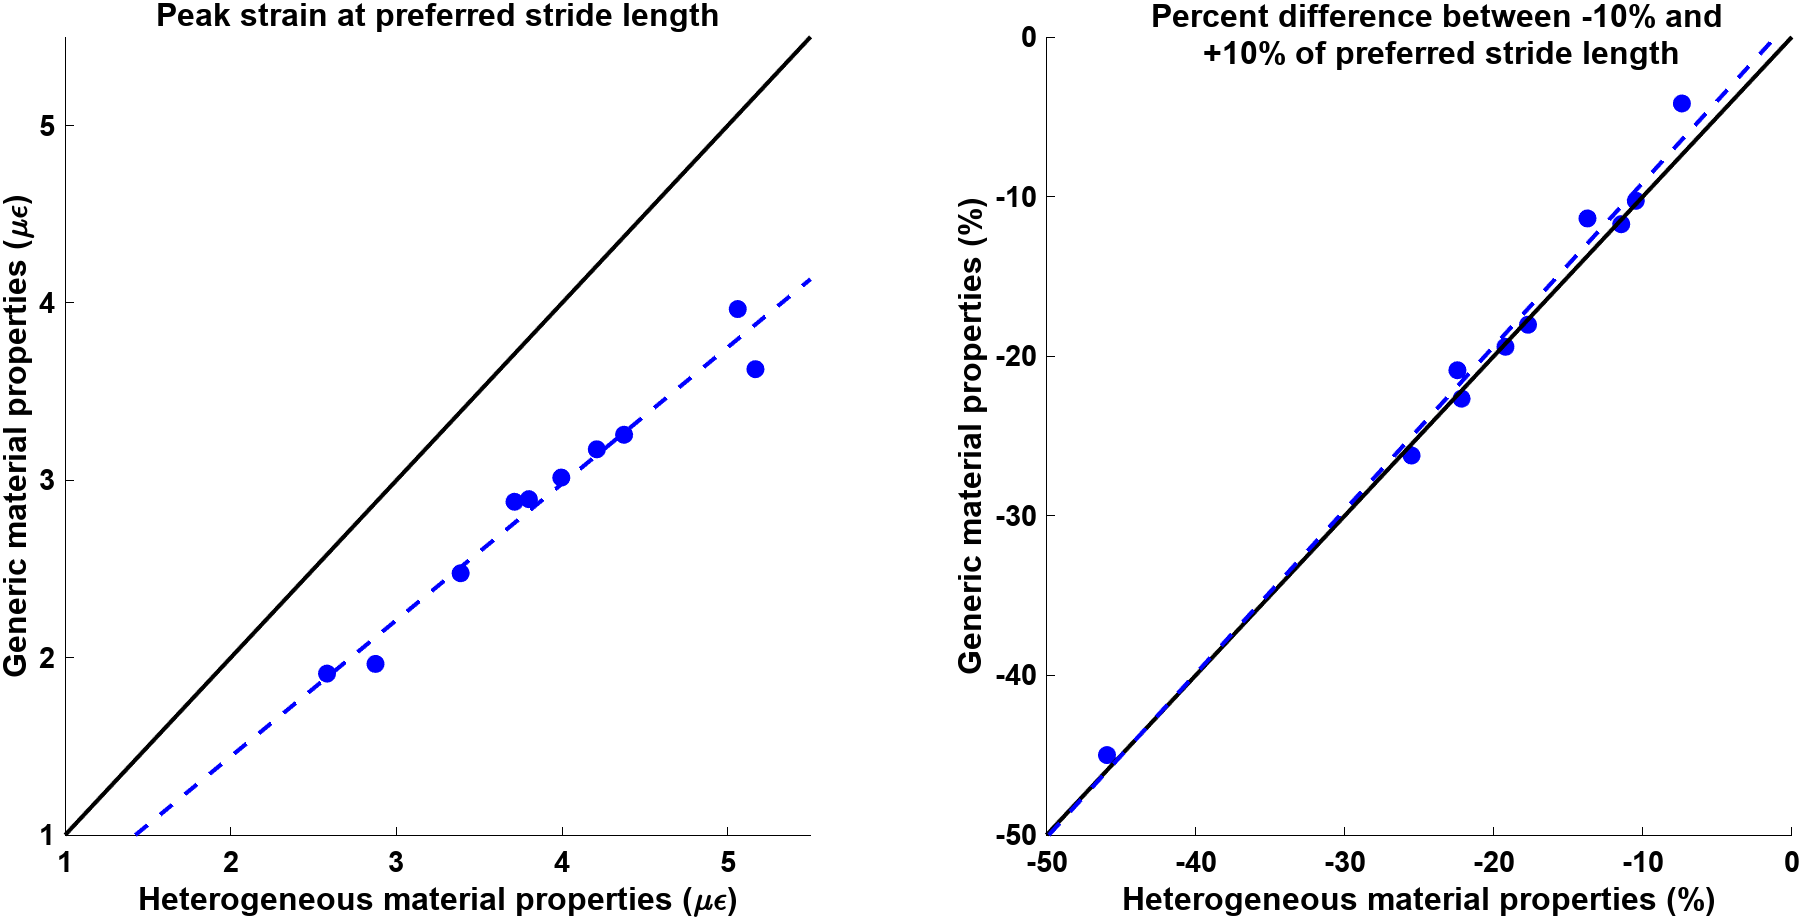
Young’s modulus RMSE was 5.6GPa in the tibia and 7.8GPa in the fibula. In general, the generic material properties overestimated cortical density, except in the cortex of the metaphyses where cortical thickness was underestimated due to partial volume effects (Figure 2). The errors in material properties resulted in large errors in tibial diaphysis surface strains (RMSE = 600µε, Figure 3). The homogeneous material property models underestimated peak strain by an average (σ) of 1000 (219) µε when compared to the heterogeneous models. Despite the large absolute errors, the homogeneous models illustrated strong prediction of relative changes in strain between participants (r=0.98) and within participants across stride length conditions (r=0.99) (Figure 4). Figure 5 shows an MRI acquisition of the tibia which depicts good differentiation of cortical and trabecular bone.Discussion
The excellent prediction of relative changes in strain by models using a three-tissue homogeneous material properties approach indicates that MRI may indeed be useful for evaluating between- and within-participant changes in bone strain in active adults. This analysis represents a best-case scenario, where only material property errors were introduced. While bone changes slowly through the diaphysis, the larger through-plane resolution in MRI when compared to CT may introduce geometry errors at the ends of the bone. Additional sagittal-plane images around the joints could be acquired to minimize this source of error. Finally, low bone density is a known risk factor for bone stress injuries10. Future work will evaluate the feasibility of acquiring a surrogate of bone density such as porosity to account for this risk factor.Conclusion
The use of homogeneous material properties in FE models did not affect the interpretation of relative changes in bone strain between or within participants. MRI can be used to explore between-group and within-participant comparisons of relative changes in bone strain in healthy, active adults.Acknowledgements
This work received research support from NIH R01AR079431.References
- Shaffer RA, Rauh MJ, Brodine SK, et al. Predictors of stress fracture susceptibility in young female recruits. Am J Sports Med. 2006;34(1):108-115.
- Hame SL, LeFemina JM, McAllister DR, et al. Fractures in the collegiate athlete. Am J Sports Med. 2004;32(2):446-451.
- Edwards WB. Modeling overuse injuries in sport as a mechanical fatigue phenomenon. Exerc Sport Sci Rev. 2018;46(4):224-231.
- Carter DR, Caler WE, Spengler DM, et al. Fatigue behaviour of adult cortical bone: the influence of mean strain and strain range. Acta Orthop Scand. 1981;52(5):481-490.
- Poelert S, Valstar E, Weinans H, et al. Patient-specific finite element modeling of bones. Proc Inst Mech Eng Part H, J Eng Med. 2013:227(4):464-478.
- Fredericson M, Bergman AG, Hoffman KL, et al. Tibial stress reaction in runners: Correlation of clinical symptoms and scintigraphy with a new magnetic resonance imaging grading system. Am J Sports Med. 1995;23(4):472-481.
- Bruce OL & Edwards WB. Sex disparities in tibia-fibula geometry and density are associated with elevated bone strain in females: A cross-validation study. Bone 2023;173:116803.
- Khassetarash A, Haider I, Baggaley M, et al. Tibial strains during prolonged downhill running: A finite element analysis. J Biomech Eng. 2023;145(4):041007.
- Rho J. An ultrasonic method for measuring the elastic properties of human tibial cortical and cancellous bone. Ultrasonics. 1996;34(8):777-783.
- Hoenig T, Ackerman KE, Beck BR, et al. Bone stress injuries. Nat. Rev. Dis. Primers. 2022;8:26.
Figures