2271
Application Research of AI-assisted Compressed Sensing Technology in MRI Scanning of the Knee Joint: 3D-MRI Perspective1Radiology, Peking University Third Hospital, BeiJing, China, 2United Imaging Research Institute of Intelligent Imaging, BeiJing, China, 3School of Biomedical Engineering, Capital Medical University, BeiJing, China
Synopsis
Keywords: Whole Joint, Machine Learning/Artificial Intelligence
Motivation: The broad clinical application of knee 3D-MRI has been constrained by scanning time.
Goal(s): To investigate the potential of AI-assisted compressed sensing (ACS) in knee MRI to optimize the scanning process.
Approach: 3D-ACS, 3D compressed sensing (CS), and 2D parallel acquisition technology (PAT) scans were performed. The 3D-ACS images underwent 3.5 mm/2.0 mm multiplanar reconstruction (MPR); radiologists evaluated the quality of images and diagnosed diseases.
Results: 3D-ACS provided poorer bone structure visualization, improved cartilage visualization, and less satisfactory axial images with 3.5 mm/2.0 mm MPR than 2D-PAT. High levels of diagnostic agreement and accuracy were observed across all diagnoses.
Impact: 3D-ACS provided poorer bone structure visualization, improved cartilage visualization, and less satisfactory axial images with 3.5 mm/2.0 mm MPR than 2D-PAT. High levels of diagnostic agreement and accuracy were observed across all diagnoses.
Introduction
MRI is the preferred method for preoperatively evaluating sports-related knee injuries [1,2]. Recent studies have highlighted the advantage of using 3D-MRI in assessing sports-related knee injuries due to its superior diagnostic accuracy compared to 2D-MRI [3,4]. However, this potential is tempered by the longer scan durations required for 3D-MRI. The extended scanning time can prove challenging for some patients, leading to possible image artifacts or even complete scan failure. Given the increasing prevalence of sports-related injuries and the concomitant increase in the number of patients requiring scans. As such, initiatives to reduce the duration of MRI scans, particularly 3D-MRI scans, are of paramount importance. Consequently, this study investigated the application potential of ACS technology in knee MRI, particularly from a 3D-MRI viewpoint, to refine the knee MRI process by integrating ACS technology.Methods
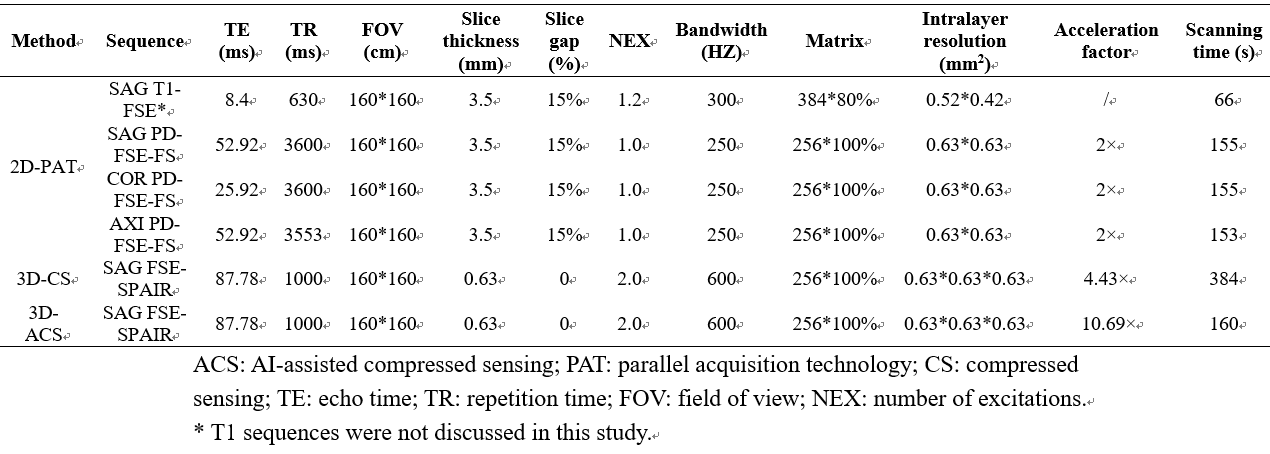
Data AcquisitionFrom April 20-27, 2023, 15 volunteers were recruited to constitute an independent group investigating the acceleration level. Upon ascertaining the optimal acceleration level, clinical and imaging data from patients admitted to our hospital with sports-related knee injuries requiring surgical intervention between May 1st and 14th, 2023, were prospectively collected. Patients received scans on a 3.0 T (uMR880, United Imaging, Shanghai, China) with a 24-channel transceiver knee coil. The protocols for MRI scanning are summarized in Table 1.
Determining the Optimal Acceleration Level
3D-ACS-MRI scans were performed on 15 volunteers using effective acceleration factors ranging from 5.72-16.34×. Two experienced musculoskeletal (MSK) radiologists evaluated and compared different images to determine the most suitable acceleration level per volunteer.
Evaluating the Application of ACS Acceleration Technology
Three MSK radiologists of varying expertise performed a subjective analysis. Each radiologist independently assessed three pairs of datasets: 1) 3D-ACS-MRI and 3D-CS-MRI; 2) 3D-ACS-MRI + 3.5 mm MPR and 2D-MRI; and 3) 3D-ACS-MRI + 2.0 mm MPR and 2D-MRI. The evaluation involved grading each patient's meniscus, ligaments, cartilage, and bone structure using a four-point absolute evaluation scale. The radiologists diagnosed each patient's meniscus lesions, cartilage, ligaments, and bone. The diagnoses were later compared with the results of the arthroscopic surgery. Since BME cannot be found in knee arthroscopy, the diagnosis results of a senior radiologist were used as the reference standard. With 3D-CS-MRI and 2D-PAT-MRI as benchmarks, a relative index evaluation was conducted using measures such as the peak signal-to-noise ratio (PSNR), structural similarity index (SSIM), normalized root mean squared error (NRMSE), universal quality index (UQI), gradient magnitude similarity deviation (GMSD) and feature similarity index measure (FSIM). In addition, an absolute index evaluation was conducted based on image texture and radiomic features.
Result
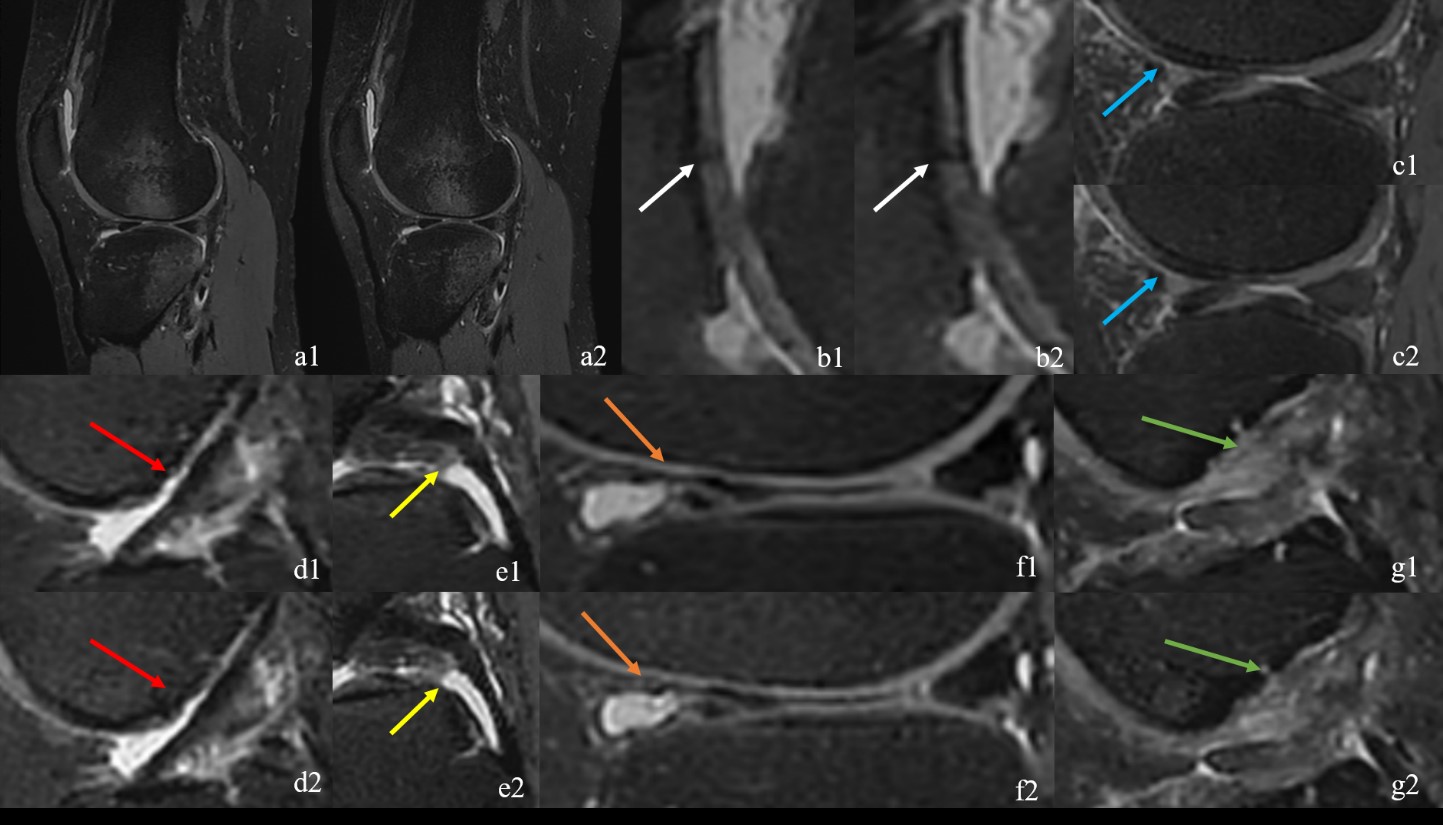
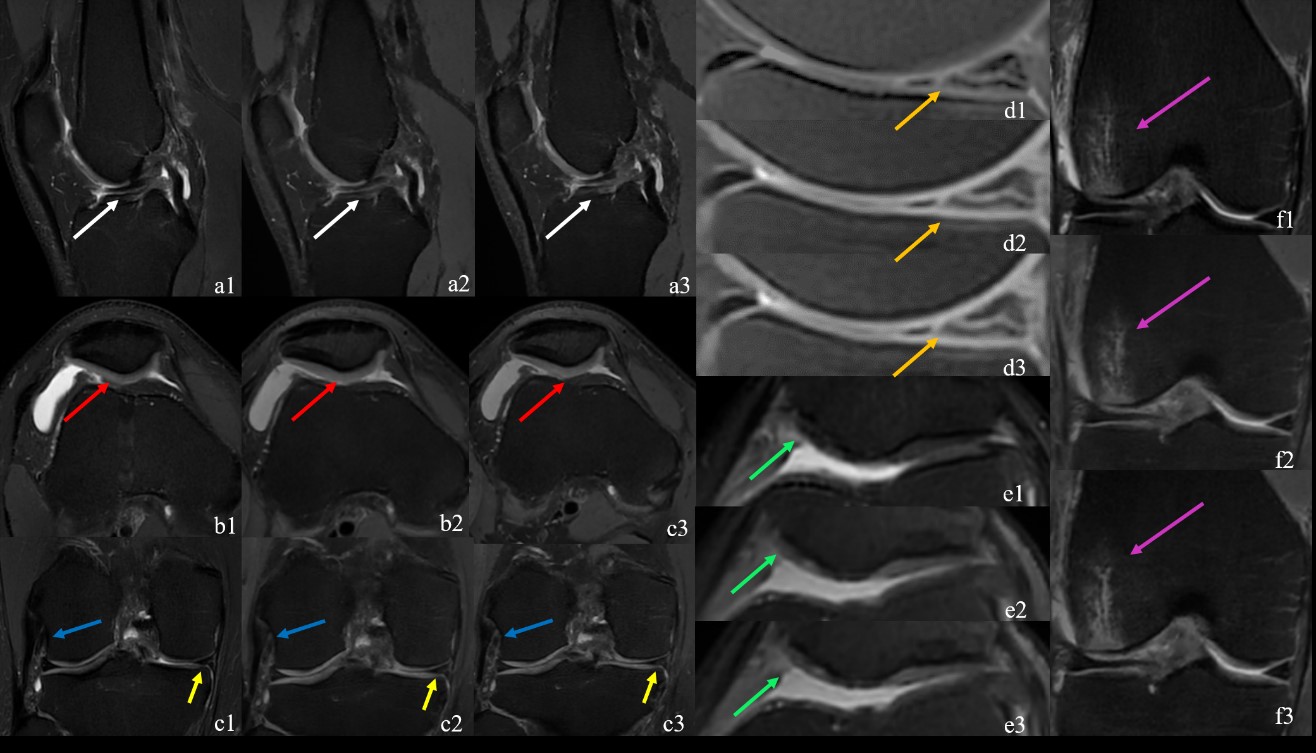
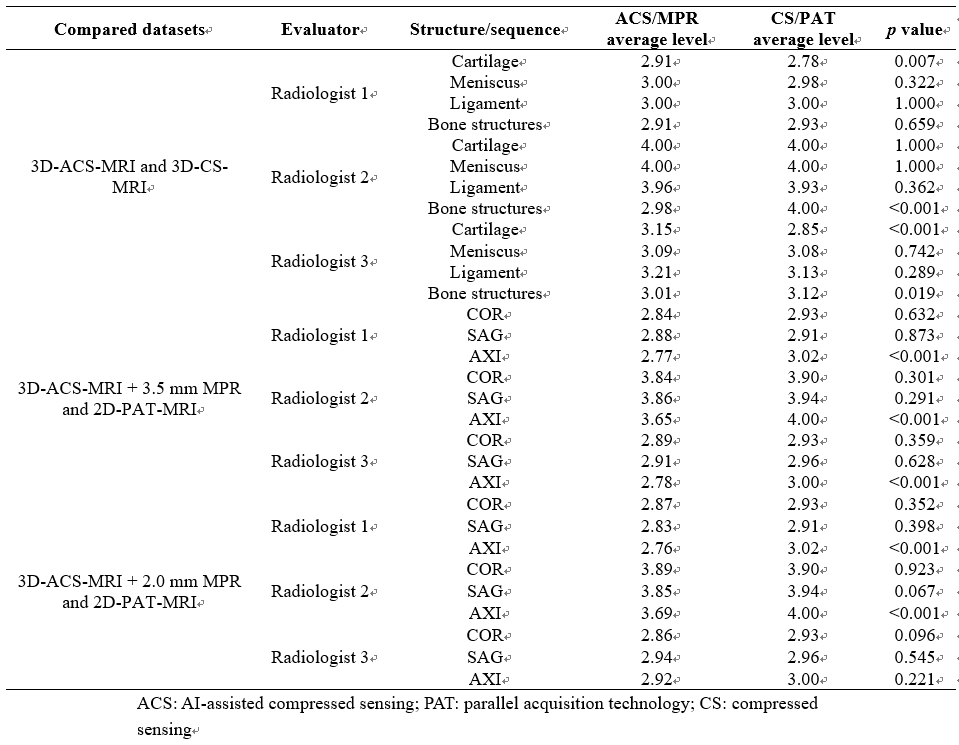
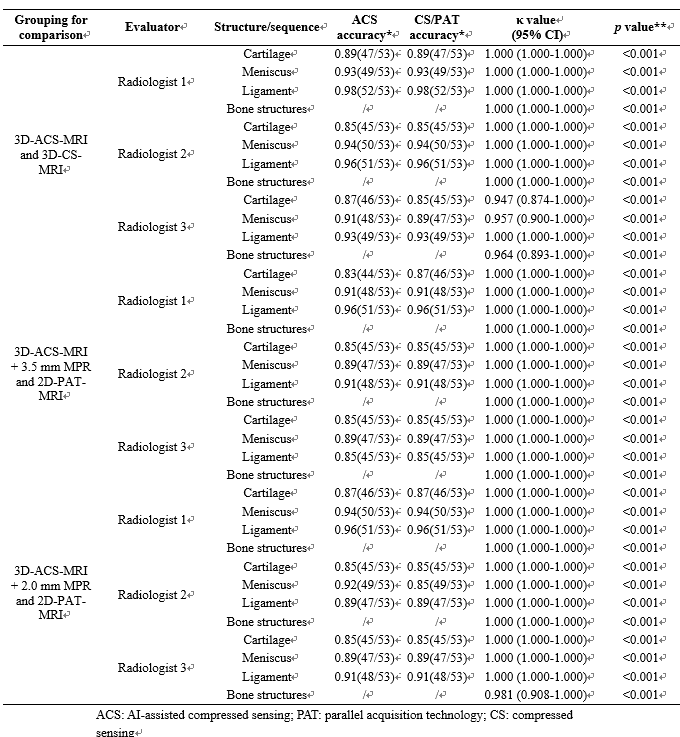
The scanning durations for 3D-ACS-MRI at levels of 5.72-16.34× were 298 s, 262 s, 218 s, 180 s, 160 s, 138 s, 114 s and 106 s. Based on the evaluation results, 10.69× demonstrated the highest acceleration frequency and was thus selected as the optimal level in this study. Figure 1 and 2 show comparisons of images obtained by ACS and 3D-CS-MRI, 3D-ACS-MRI + 3.5 mm MPR, and 2D-PAT-MRI, and 3D-ACS-MRI + 2.00 mm MPR and 2D-PAT-MRI for the same patient. Table 2 displays the results of the three radiologists’ subjective image quality analysis. Radiologists 2 and 3 scored the bone structures lower on 3D-ACS-MRI than 3D-CS-MRI, while radiologists 1 and 3 gave higher scores for cartilage structures. During the comparison between 3D-ACS-MRI + 3.5 mm/2.0 mm MPR and 2D-PAT-MRI, radiologists 1 and 2 observed a difference between the AXI MPR and 2D-PAT-MR images. The three radiologists exhibited very good consistency in the comparison of images among the three groups, achieving high accuracy (0.83-0.98) in the lesion assessments, as shown in Table 3. In the relative index evaluation, the average PSNR based on the entire image and VOI exceeded 65, the average SSIM was above 0.99, the average NRMSE was below 0.50, the average UQI was no more than 0.80, the average GMSD was under 0.25, and the average FSIM exceeded 0.70. In the absolute index evaluation, most texture or radiomic features showed significant differences.Discussion and Conclusion
This study demonstrates that ACS technology can reduce knee MRI scan time by more than 50%, while 3D-ACS-MRI and associated MPR can replace traditional accelerated MRI and produce thinner 2D MPR. The successful application of 3D-ACS-MRI proves that ACS technology shows great promise in replacing traditional knee joint 3D-CS-MRI with the dual advantages of significant time savings and consistent diagnostic accuracy. Despite current limitations, the advantages of ACS technology offer great promise for improving and accelerating MRI procedures.Acknowledgements
National Natural Science Foundation of China (82171927), the Beijing Natural Science Foundation (7212126), and the Beijing New Health Industry Development Foundation (XM2020-02-006).References
[1] MOHANKUMAR R, WHITE L M, NARAGHI A. Pitfalls and pearls in MRI of the knee [J]. AJR American journal of roentgenology, 2014, 203(3): 516-30.
[2] SHAHABPOUR M, HANDELBERG F, CASTELEYN P P, et al. Imaging in sports-medicine--knee [J]. European journal of radiology, 1997, 26(1): 23-45.
[3] SHAKOOR D, GUERMAZI A, KIJOWSKI R, et al. Cruciate ligament injuries of the knee: A meta-analysis of the diagnostic performance of 3D MRI [J]. Journal of magnetic resonance imaging : JMRI, 2019, 50(5): 1545-60.
[4] WEI H, LIN H, QIN L, et al. Quantitative susceptibility mapping of articular cartilage in patients with osteoarthritis at 3T [J]. Journal of magnetic resonance imaging : JMRI, 2019, 49(6): 1665-75.
Figures