2269
Phantom and workflow for validation and quality assurance of musculoskeletal MR intensive-variable biomarkers1Bioxydyn Ltd, MANCHESTER, United Kingdom, 2University of Manchester, MANCHESTER, United Kingdom, 3National Physical Laboratory, Teddington, United Kingdom, 4Leeds Test Objects Ltd, Boroughbridge, United Kingdom, 5The Christie NHS Foundation Trust, MANCHESTER, United Kingdom, 6Institute of Cancer Research, LONDON, United Kingdom, 7University College London, LONDON, United Kingdom
Synopsis
Keywords: Whole Joint, Quantitative Imaging
Motivation: We seek better validation and QA of musculoskeletal intensive-variable MR biomarkers.
Goal(s): We aimed to devise and evaluate a phantom with suitable form factor and composition for practical use in this setting.
Approach: “Expected” temperature- and B0-dependent R1 values were calculated from prior data and verified by inversion recovery (IR). Practical QA use cases for hand and knee trials were exemplified using product-sequence 3D variable flip angle (3DVFA) R1measurements on three vendors’ scanners.
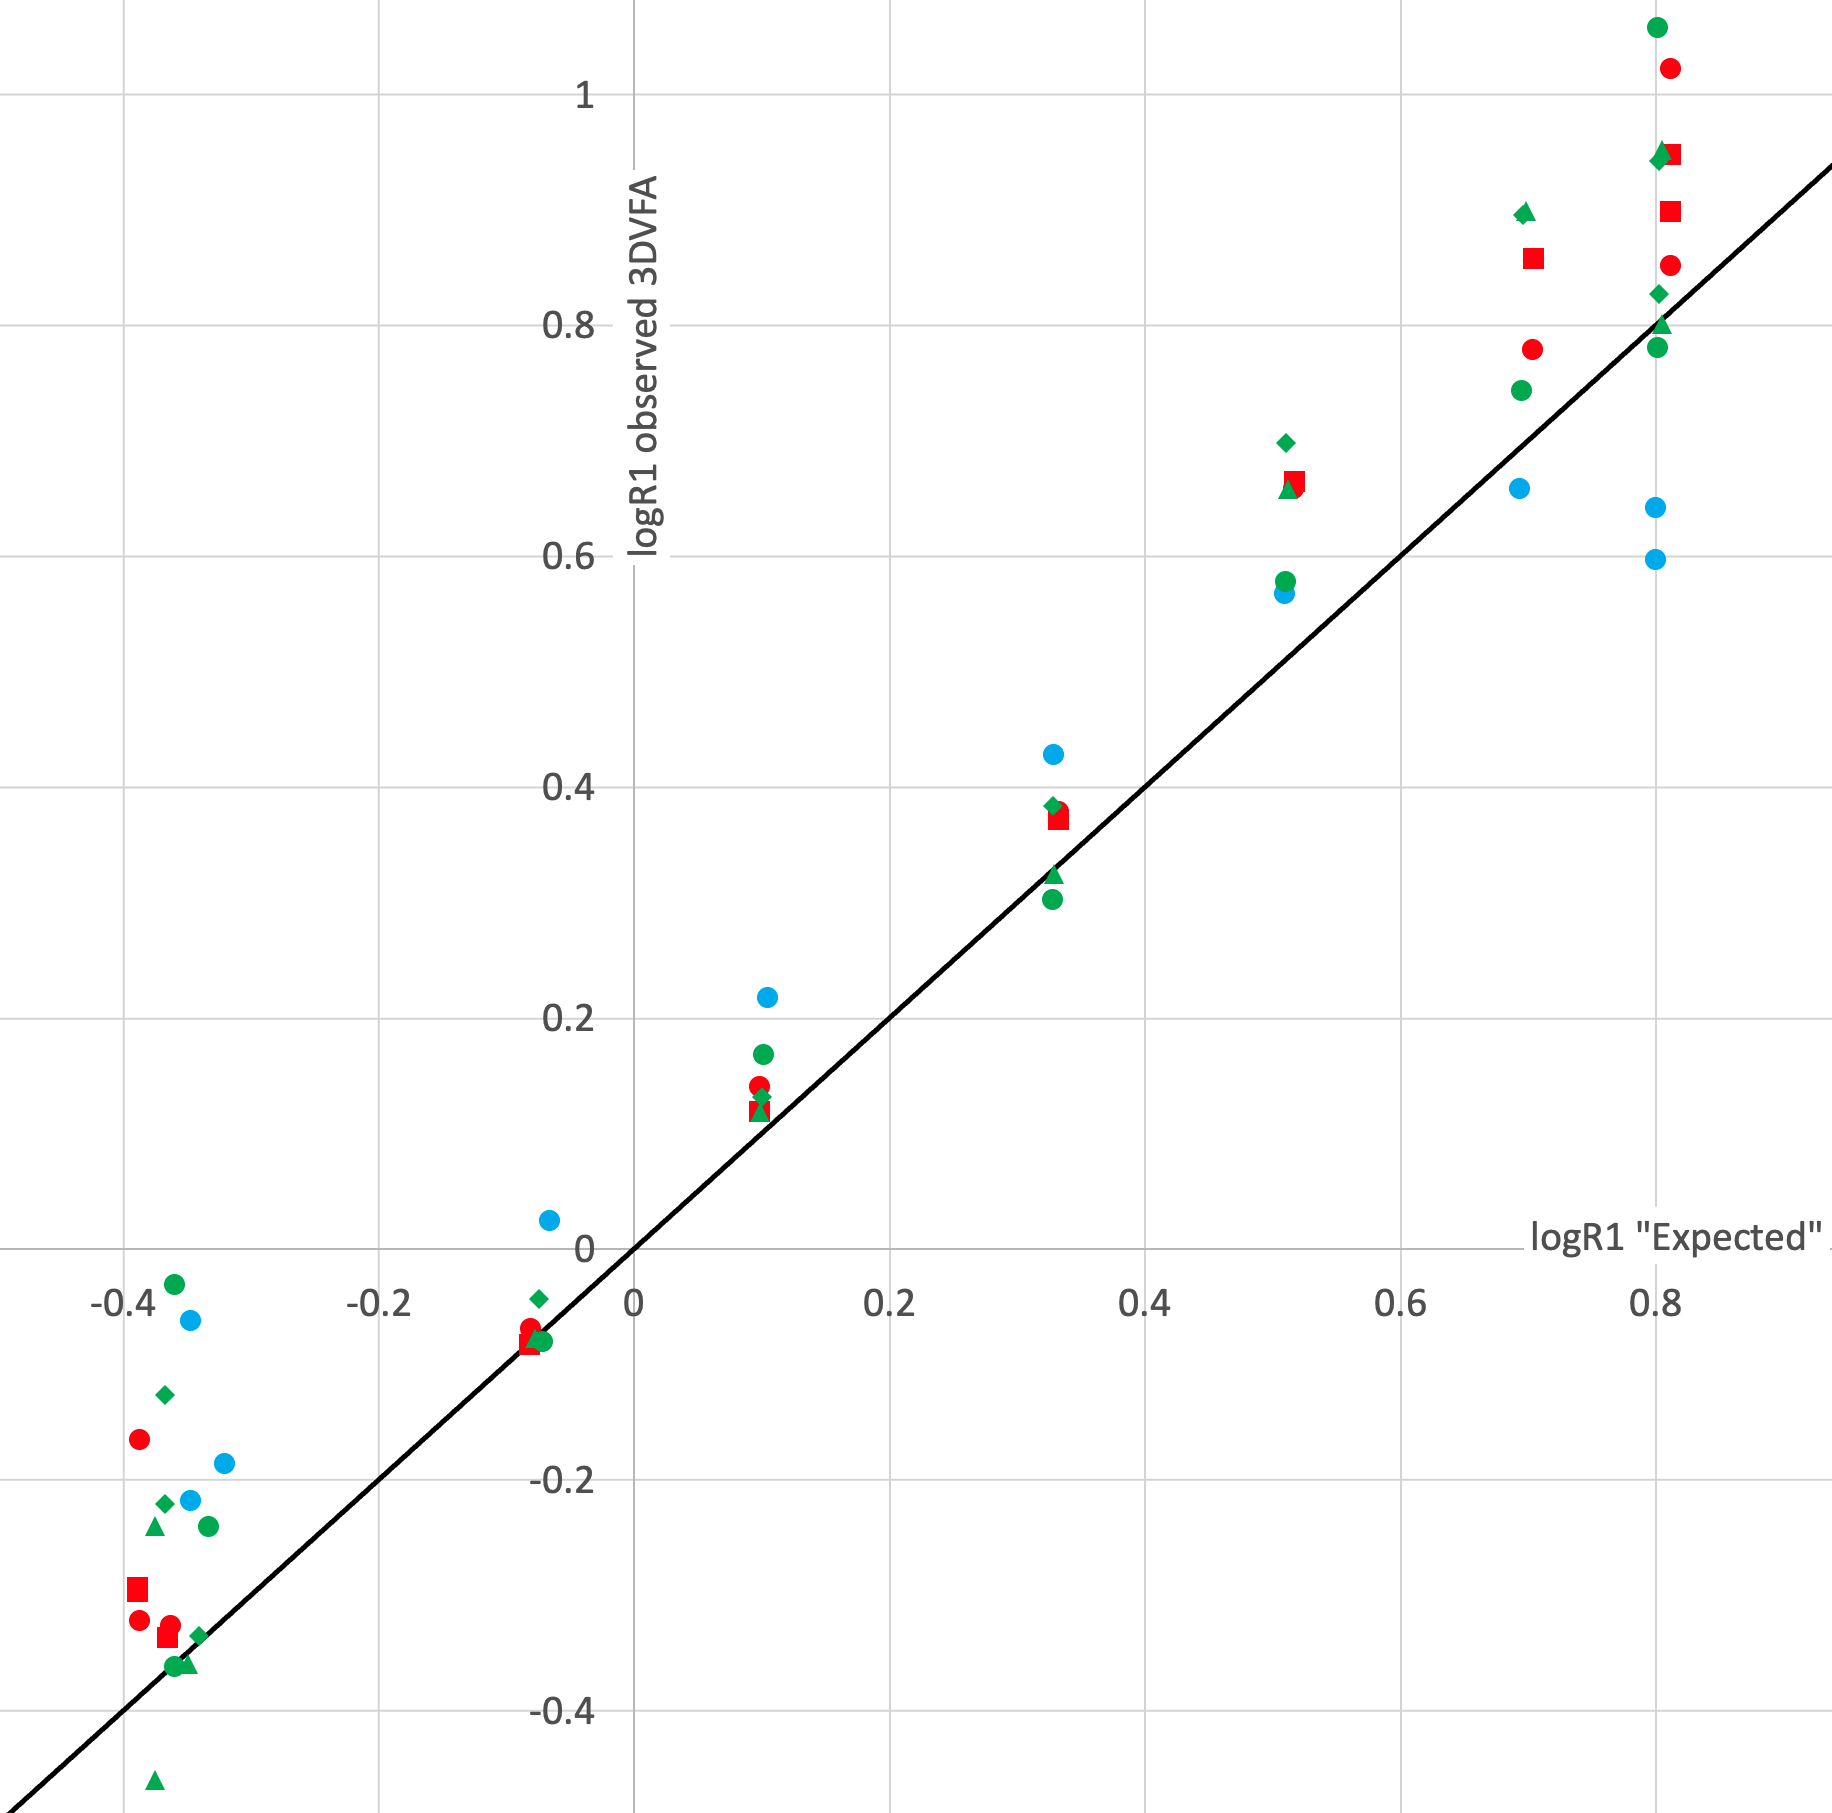
Results: There was little deviation between “Expected” and IR-measured R1 (rms 3.8%). 3DVFA R1 exhibited bias (mean +23%) which must be subtracted during within-study QA.
Impact: This work will improve QA in real-world musculoskeletal clinical trials which use intensive-variable MR biomarkers, and will help validate such biomarkers.
Introduction
Joints exhibit a much wider spread of relaxation rates R1 and R2 than most other organs. These rates may be further increased by contrast media. Important intensive-variable biomarkers of synovial inflammation, cartilage fixed charge density, and osteitis demand phantom-based Quality Assurance (QA). Multicentre studies require phantoms: (a) manufactured consistently within a Quality Management System; (b) exhibiting a suitable range of R1 and R2; and (c) with form factor compatible with typical clinically-used hand and knee coils. Moreover, phantom-based QA in multicentre trials must be practical, employing familiar and compatible product sequences available on all makes and models, and avoiding lengthy acquisitions which disrupt workflow on busy clinical scanners. The aim of this work was to establish a phantom and associated use cases meeting these needs.Methods
Composition: nickel agarose phantoms (Fig.1) were devised with tubes exhibiting target R1 between 0.4 and 6.7 s-1 with R2 between 3.3 and 25 s-1, representative of musculoskeletal MR, and were sealed at ambient temperature and pressure, assumed to be 293 K and 101 kPa (NTP). Oxygen in the phantom was assumed not to equilibrate with room air, and headspace was assumed negligible.Derivation of “Expected” R1 values: we extracted from prior literature the relaxivities of Ni(H2O)62+ 1–6, agarose7–9 and O2 10–15 (including their temperature-dependencies, field dependencies and cross-terms); baseline R1 16 for water R1,0 and its temperature dependence; Henry coefficient17 for O2; Setschenow constants18 for Ni2+ and Cl-; molar volume of agarose; and molecular weight of agarobiose subunits. Also considered were: temperature T; barometric pressure P; purities; and estimated weighing errors. This allowed an “Expected” R1 with uncertainties to be calculated for each composition at each field strength and temperature, for comparison with actual IR measurements:
R1,B0,T = R1,0,T + r1,B0,T,[agb],Ni×[Ni] + r1,B0,T,agb×[agb] + r1,B0,T,O2×[O2]NTP,[agb]
where: B0 is the static field /T; R1,B0,T is the Expected longitudinal relaxation rate at B0 and T /s-1; R1,0,T is the relaxation rate in pure deoxygenated water (independent of B0) at T /s-1; r1,B0,T,[agb],Ni is the relaxivity of Ni(H2O)62+ in the presence of agarose towards water protons at B0 and T /s-1mM-1; r1,B0,T,agb is the relaxivity of agarose (as agarobiose subunits) towards water protons at B0 and T /s-1mM-1; r1,B0,T,O2 is the relaxivity of O2 towards water protons at B0 and T /s-1mM-1; [agb] is the chosen concentration of agarose (as agarobiose subunits) /mM; [O2]NTP,[agb] is the concentration of dissolved O2 in equilibrium with air at the moment of closure after accounting for [agb] /mM; and T is the temperature during scanning /K.
Verification: phantom tubes from multiple batches were verified, with temperature recorded, using inversion recovery (IR) on two trusted scanners at 2.89 T and 3 T (Table 1).Three QA use cases were considered:
A. (re)validation of the phantom itself, employing suitable IR R1 measurements in a trusted scanner;
B. R1 measurements to permit or deny use of a specific scanner in a particular clinical trial, employing any vendor’s product-sequence 3DVFA;
C. regular ongoing QA during a trial to support within-trial decisions such as “accept incoming scans”; “accept incoming scans with correction”; or “remediate scanner before accepting incoming scans”, also using product-sequence 3DVFA.
The 3DVFA-based cases were exemplified on three vendors’ scanners (Table 1).
Results
At each B0, T and P, R1 is the sum of contributions from R1,0, O2, Ni and agarose. In this phantom at 3 T and NTP, “Expected” contributions ranged respectively from 5%-74%, <1%-8%, 7%-94% and <1%-15% of total R1 (Fig 2). “Expected” dR1/dT varied between the tubes from +0.6% K-1 to -2.0% K-1.For use case A, R1 measured by IR was in good agreement with “Expected” values (Fig 3) (mean deviation 2.3%, rms 6.1%). For use cases B and C, R1 measured by 3DVFA exhibited systematic bias from “Expected” values (Fig 4) (respective mean deviation 23%, rms 36%), or over corresponding IR values.
Discussion
We have successfully devised and evaluated a MR phantom with a form factor and composition suitable for important use cases in musculoskeletal clinical trials. Calculated “Expected” R1 values and temperature dependencies gave good agreement with observed IR measurements but 3DVFA R1 showed bias. For use cases B and C this bias must be subtracted during within-study QA.Acknowledgements
This project was resourced through grant-funding from the National Physical Laboratory to the University of Manchester, and through in-kind contributions by Leeds Test Objects Ltd and Bioxydyn Ltd.References
1. Waterton, J. C. et al. Repeatability and reproducibility of longitudinal relaxation rate in 12 small-animal MRI systems. Magn Reson Imaging 59, 121–129 (2019).
2. Captur, G. et al. A medical device-grade T1 and ECV phantom for global T1 mapping quality assurance - the T1 Mapping and ECV Standardization in cardiovascular magnetic resonance (T1MES) program. Journal of Cardiovascular Magnetic Resonance 18, 1–20 (2016).
3. Christoffersson, J. O., Olsson, L. E. & Sjöberg, S. Nickel-doped agarose gel phantoms in MR imaging. Acta radiol 32, 426–431 (1991).
4. Keenan, K. E. et al. Quantitative magnetic resonance imaging phantoms: A review and the need for a system phantom. Magn Reson Med 79, 48–61 (2018).
5. Howe, F. A. Relaxation times in paramagnetically doped agarose gels as a function of temperature and ion concentration. Magn Reson Imaging 6, 263–270 (1988).
6. Walker, P. M., Balmer, C., Ablett, S. & Lerski, R. A. A test material for tissue characterisation and system calibration in MRI. Phys Med Biol 34, 5 (1989).
7. Outhred, R. K. & George, E. P. A Nuclear Magnetic Resonance Study of Hydrated Systems Using the Frequency Dependence of the Relaxation Processes. Biophys J 13, 83 (1973).
8. Portakal, Z. G. et al. Design and characterization of tissue-mimicking gel phantoms for diffusion kurtosis imaging. Med Phys 45, 2476–2485 (2018).
9. Boursianis, T., Kalaitzakis, G., Pappas, E., Karantanas, A. H. & Maris, T. G. MRI diffusion phantoms: ADC and relaxometric measurement comparisons between polyacrylamide and agarose gels. Eur J Radiol 139, (2021).
10. Hausser, R. & Noack, F. Kernmagnetische relaxation und korrelation im system wasser - sauerstoff. Zeitschrift fur Naturforschung - Section A Journal of Physical Sciences 20, 1668–1675 (1965).
11. Eaton, S. S. & Eaton, G. R. EPR Spectra and Electron Spin Relaxation of O2. Appl Magn Reson 52, 1223–1236 (2021).
12. Han, P. & Bartels, D. M. Temperature Dependence of Oxygen Diffusion in H2O and D2O. Journal of Physical Chemistry 100, 5597–5602 (1996).
13. Krynicki, K., Green, C. D. & Sawyer, D. W. Pressure and temperature dependence of self-diffusion in water. Faraday Discuss Chem Soc 66, 199–208 (1978).
14. Teng, C. L., Hong, H., Kiihne, S. & Bryant, R. G. Molecular Oxygen Spin–Lattice Relaxation in Solutions Measured by Proton Magnetic Relaxation Dispersion. Journal of Magnetic Resonance 148, 31–34 (2001).
15. Bluemke, E., Stride, E. & Bulte, D. P. A simplified empirical model to estimate oxygen relaxivity at different magnetic fields. NMR Biomed 35, (2022).
16. Krynicki, K. Proton spin-lattice relaxation in pure water between 0°C and 100°C. Physica 32, 167–178 (1966).
17. Sander, R. Compilation of Henry’s law constants (version 4.0) for water as solvent. Atmos Chem Phys 15, 4399–4981 (2015).
18. Onda, K., Kobayashi, T., Kito, S. & Ito, K. SALTING-OUT PARAMETERS OF GAS SOLUBILITY IN AQUEOUS SALT SOLUTIONS. JOURNAL OF CHEMICAL ENGINEERING OF JAPAN 3, 18–24 (1970).
Figures
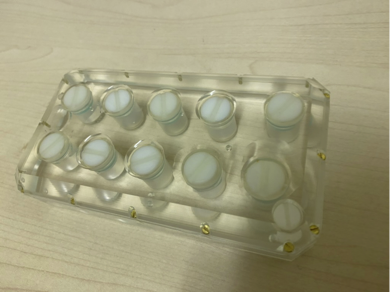
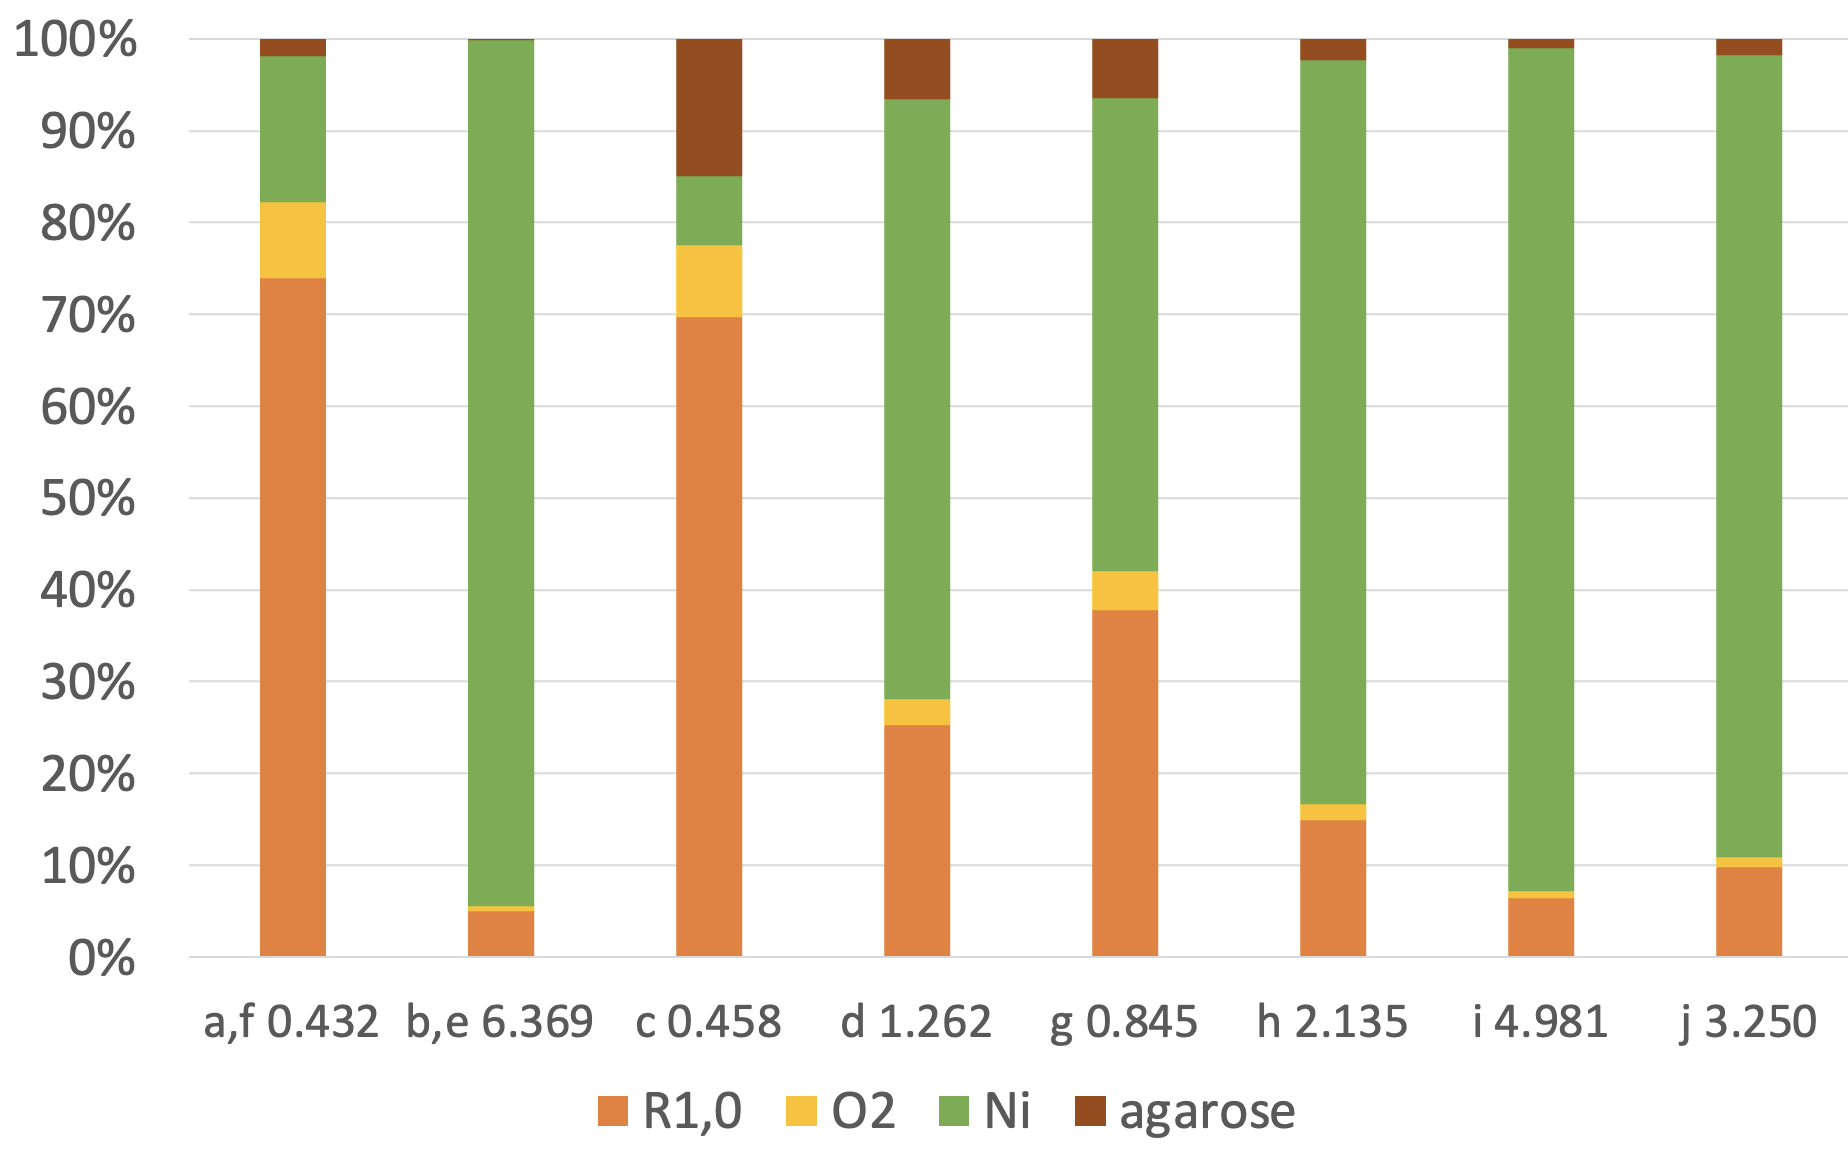
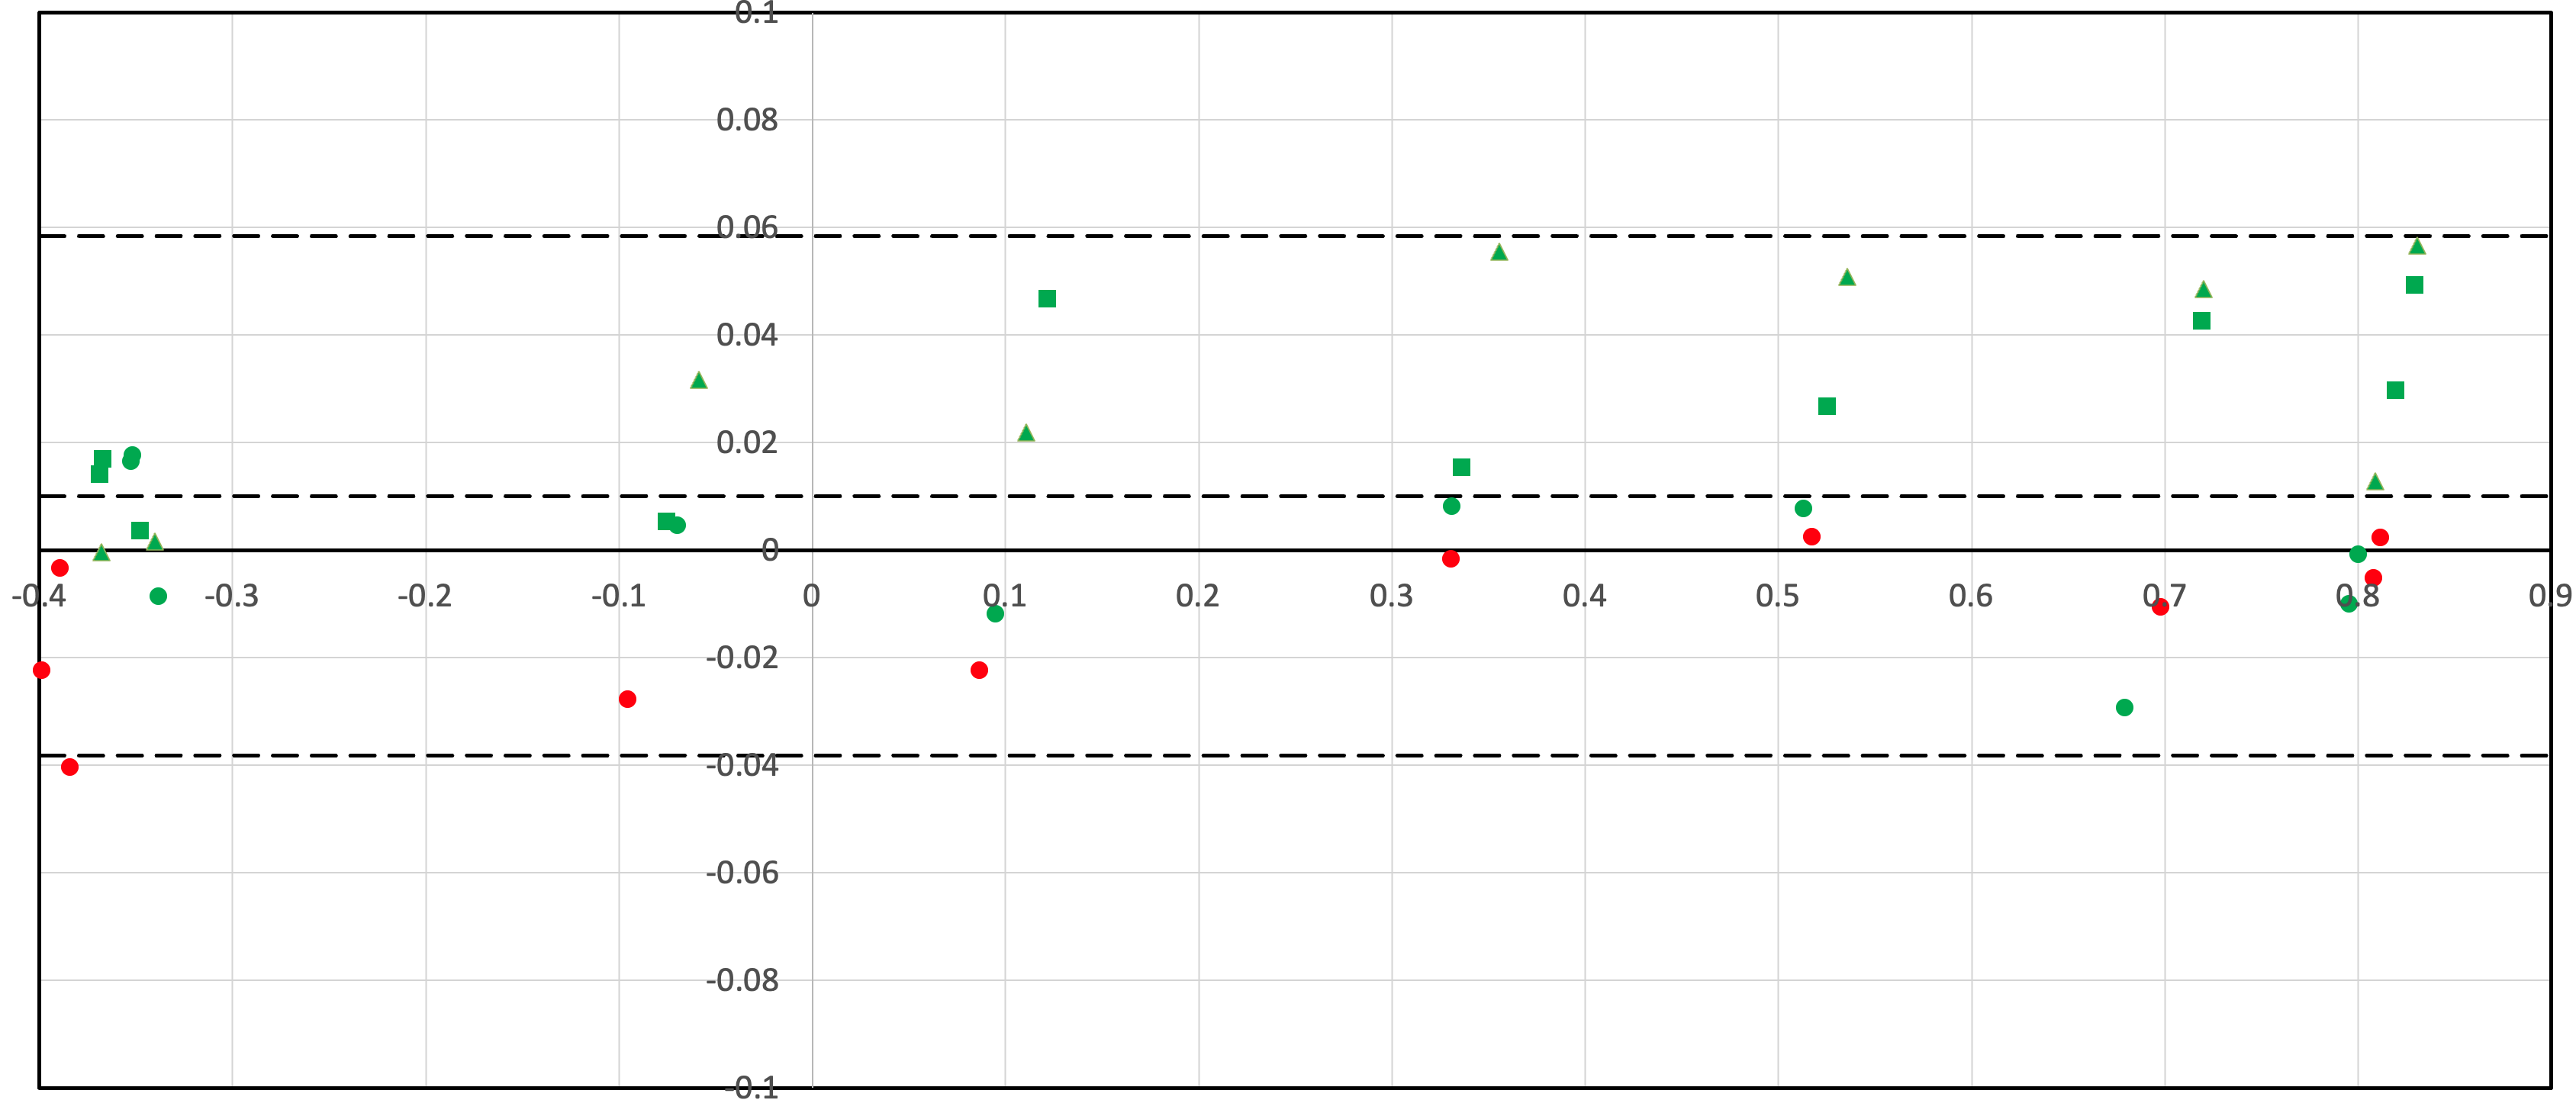
Figure 3: Use Case A. Validation of phantoms in two trusted scanners. Bland-Altman plot of temperature-corrected "Expected" (E) vs IR-measured (M) log(R1) for tubes a-j. Vertical axis: (M - E); horizontal axis: 0.5×(M + E) Each colour represents a different scanner and each shape represents a different phantom manufactured to the same formulations. Dashed lines mean±1.96SD