2268
Comparing Different Deep Learning (DL) Models for Joint Estimation of Proton Density and T1$$$ \rho$$$ Maps in the Knee Joint1Department of Radiology, New York University Grossman School of Medicine, New york, NY, United States, 2Center for Advanced Imaging Innovation and Research (CAI2R), Department of Radiology, New York University Grossman School of Medicine, New york, NY, United States
Synopsis
Keywords: Cartilage, Machine Learning/Artificial Intelligence, Deep Learning, T1rho
Motivation: Estimating proton density (PD) and T1$$$\rho$$$ maps in the knee joint is time-consuming with nonlinear least squares (NLS) algorithms. Deep learning (DL) methods can do it faster.
Goal(s): Find the best DL model for this task, comparing different DL models.
Approach: We compared UNet, DenseNet, Encoder-Decoder, and Convolutional Neural Network (CNN). The proposed models directly transform k-space data into T1$$$\rho$$$ and PD maps, eliminating the need for traditional exponential fitting.
Results: UNet and Encoder-Decoder-based models obtained the best performance, using short training and prediction times and minimal memory requirements. The proposed models are 129 times faster than the benchmark NLS method.
Impact: This study compared different aspects of four DL models for joint PD and T1$$$\rho$$$ maps in the knee cartilage, indicating the most recommended models for this task.
Introduction
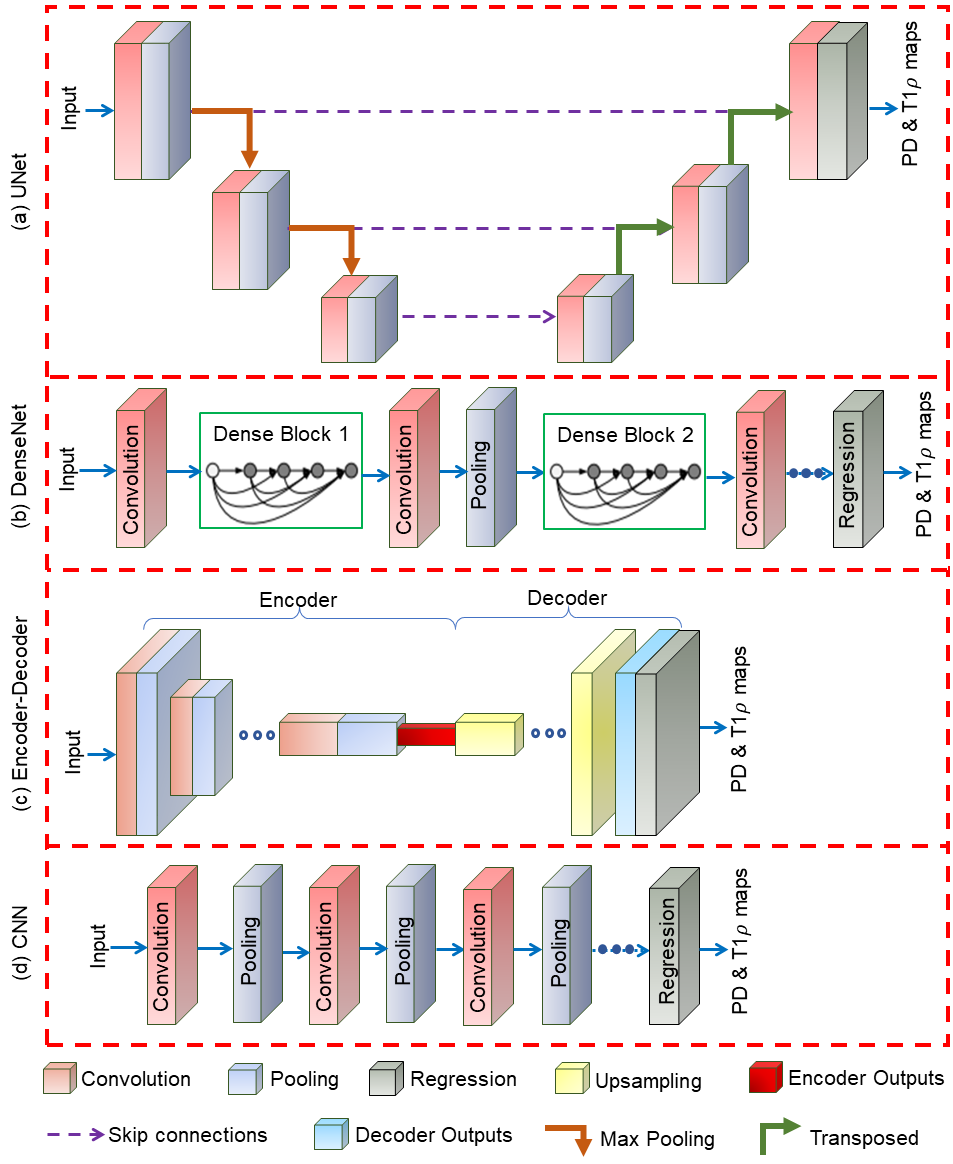
T1$$${\rho}$$$ mapping in musculoskeletal MRI offers a non-invasive and quantitative approach for early detection of osteoarthritis (OA) (1). Its sensitivity to early biochemical changes and ability to identify cartilage degeneration makes it a valuable tool (2). Typically, the nonlinear least squares (NLS) approach is used for fitting T1$$${\rho}$$$ parameters in a sequence of T1$$${\rho}$$$-weighted images at various spin-lock times (2). However, since NLS is computationally demanding, T1$$${\rho}$$$ mapping is only done in a few voxels in the cartilage, usually after segmentation.Recently, the need to evaluate the whole knee joint, since several studies indicated OA is not only a cartilage disease, has forced researchers to look for faster tools for this task (3,4). Some well-known models are presented in (5,6,7,8). This paper compare four deep learning (DL) models, i.e., UNet, DenseNet, Encoder-Decoder, and CNN for jointly predicting T1$$${\rho}$$$ and proton density (PD) maps (see Figure 1). Image-to-k-Space transforms, and its adjoint can be directly incorporated in the model, eliminating the need for a traditional two-step approach (image reconstruction and model fitting). The proposed models exhibit efficient computation with shorter training and prediction times, with minimal memory requirements. Overall, the proposed models significantly reduce processing time compared to the conventional NLS approach.
Methods
This section describes the methodology for joint prediction using DL models (see Figure 1). The input data is the images, denoted as $$$\mathbf{x}$$$. The goal is to jointly predict T1$$$\rho$$$ maps ($$$\tau$$$) and PD ($$$\kappa$$$) maps from $$$\mathbf{x}$$$. For balanced training, the target variable $$$\tau$$$ is normalized to align with the range of $$$\kappa$$$. During the testing phase, the predicted $$$\tau$$$ values are re-scaled to restore them to their original range.A common approach for fitting T1$$$\rho$$$ maps involves using the mono-exponential model, which can be expressed as $$x(\mathbf{r},t)=M(\kappa(\mathbf{r}),\tau(\mathbf{r}))+\eta(\mathbf{r},t)$$ Here, $$$M(\kappa(\mathbf{r}),\tau(\mathbf{r}))=\kappa(\mathbf{r})e^{-t/\tau(\mathbf{r})}$$$ is the mono-exponential model, $$$x(\mathbf{r},t)$$$ is the image voxel at spatial position $$$\mathbf{r}$$$, and spin-lock time $$$t$$$, $$$\kappa(\mathbf{r})$$$ is the PD, and $$$\tau(\mathbf{r})$$$ is T1$$$\rho$$$ relaxation time at voxel $$$\mathbf{r}$$$.
Reference values are usually obtained with NLS, minimizing $$L_{NLS}(\kappa(\mathbf{r}),\tau(\mathbf{r}))= \sum_{t=i}^T |x(\mathbf{r},t) -M(\kappa(\mathbf{r}),\tau(\mathbf{r}))|^2.$$ Here, $$$T$$$ represents the number of spin-lock times (TSLs).
The training of the network $$$ U_{\theta}$$$, with learned parameters $$$\theta$$$, is done by minimizing the Mean Squared Error (MSE) as $$L(\theta) = \frac{1}{N}\sum_{n=1}^{N} (U_{\theta }(\mathbf{x}_n) - \mathbf{p}_{n})^2$$ where $$$N$$$ is the number of samples in the dataset, $$$\mathbf{x}_n$$$ is the input image sequence (all voxels and spin-lick times) and $$$\mathbf{p}_{n}$$$ is the reference parameter maps ($$$\kappa$$$ and $$$\tau$$$) obtained with NLS, all indexed by $$$n$$$ in the dataset.
Models are trained using Adam optimizer, using a maximum of 500 epochs, and each epoch processes mini-batches of 16 samples. The initial learning rate $$$\alpha$$$ is set to 1.4e-3. A total of 768 MRI slices are included in the dataset, with each slice representing two TSLs.
The data is structured into two arrays, namely real and imaginary, resulting in an overall input data size of [256, 256, 4, 768]. Each slice corresponds to its respective fully sampled reference T1$$$\rho$$$ and PD maps obtained through the NLS approach. 75% of the slices (576 slices) are used for training, 15% (115 slices) are reserved for validation, and the remaining 10% (77 slices) are utilized for testing.
Results and Discussion
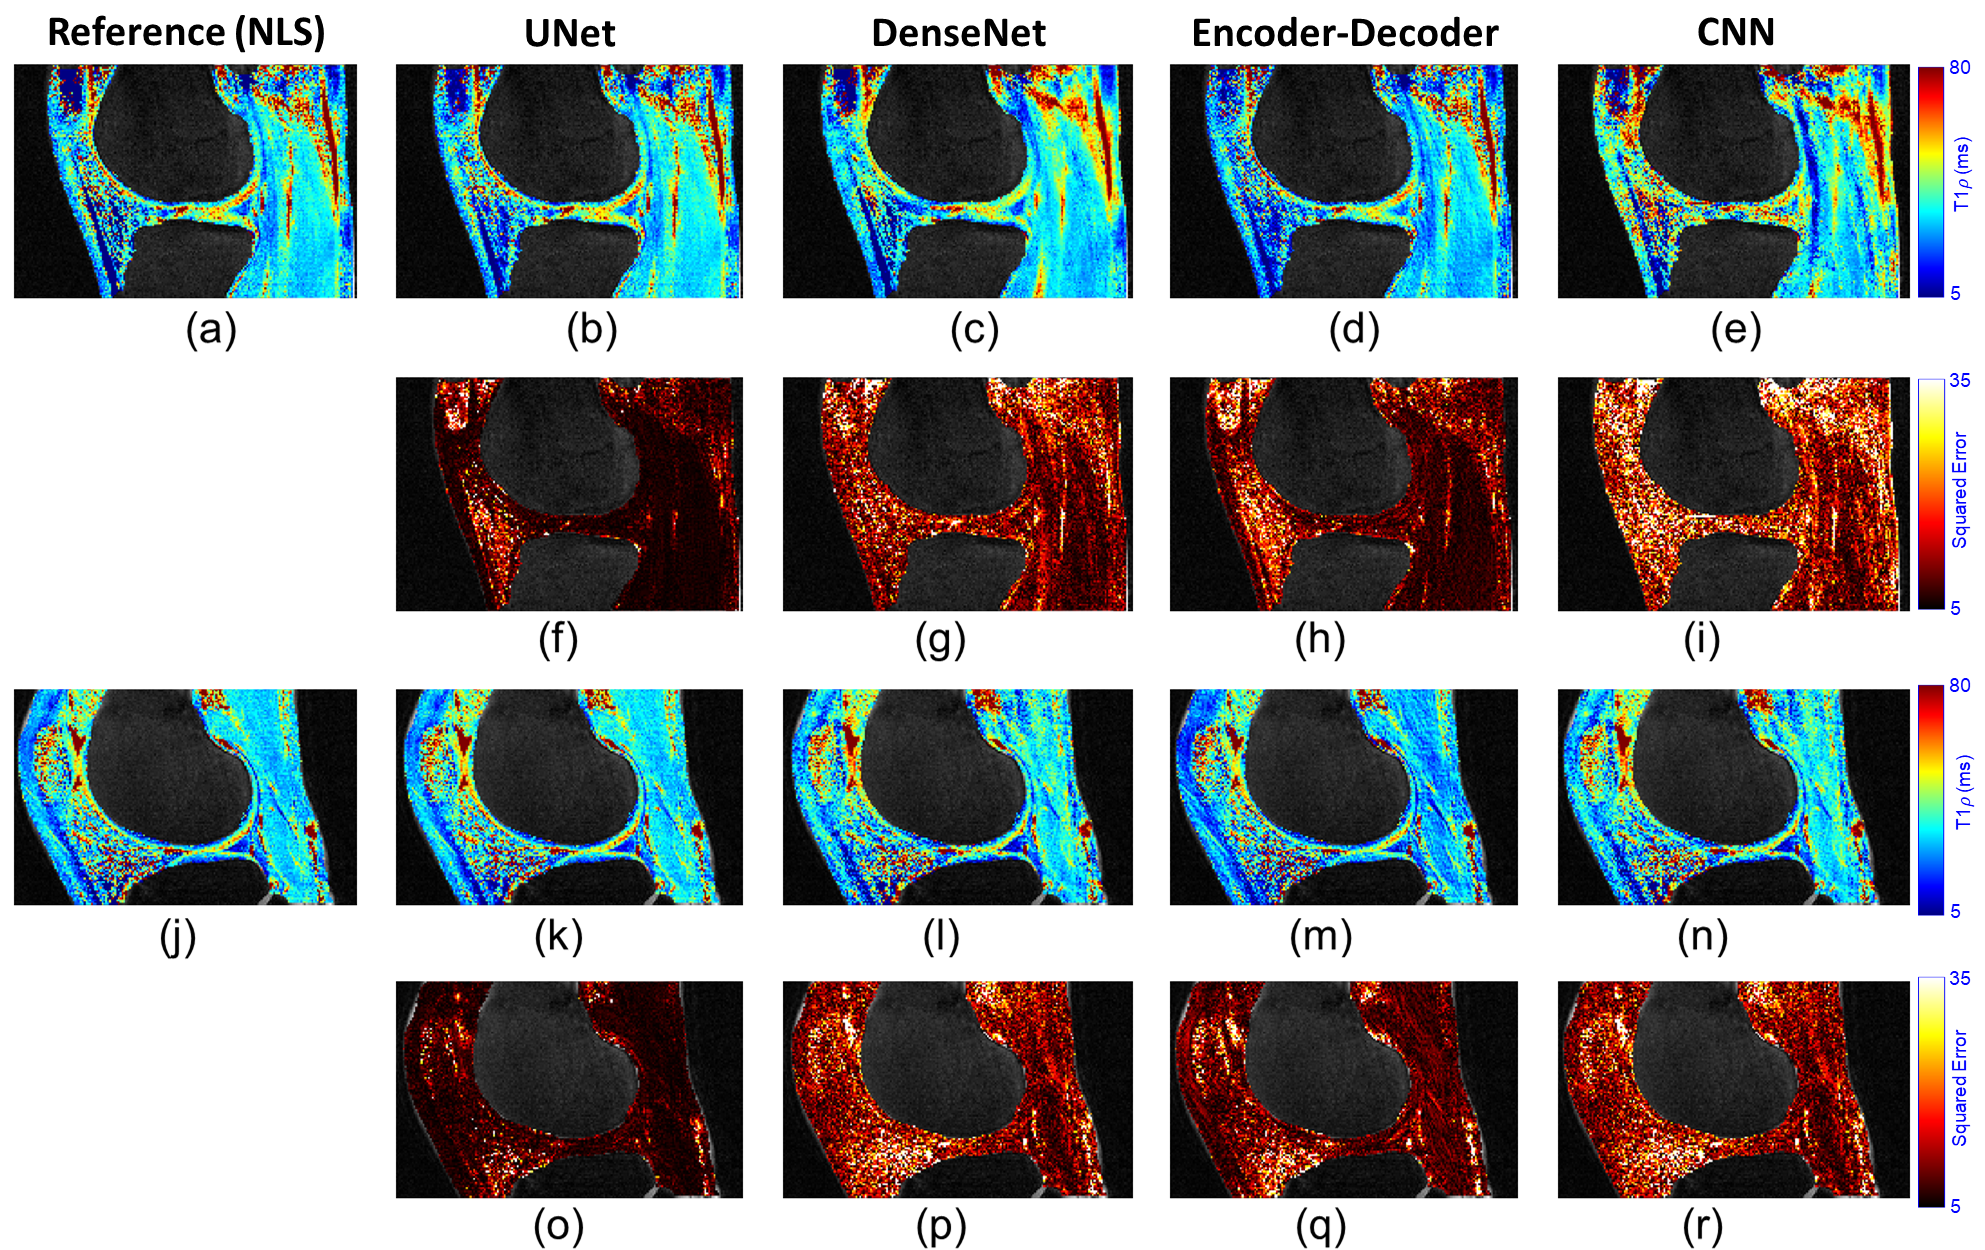
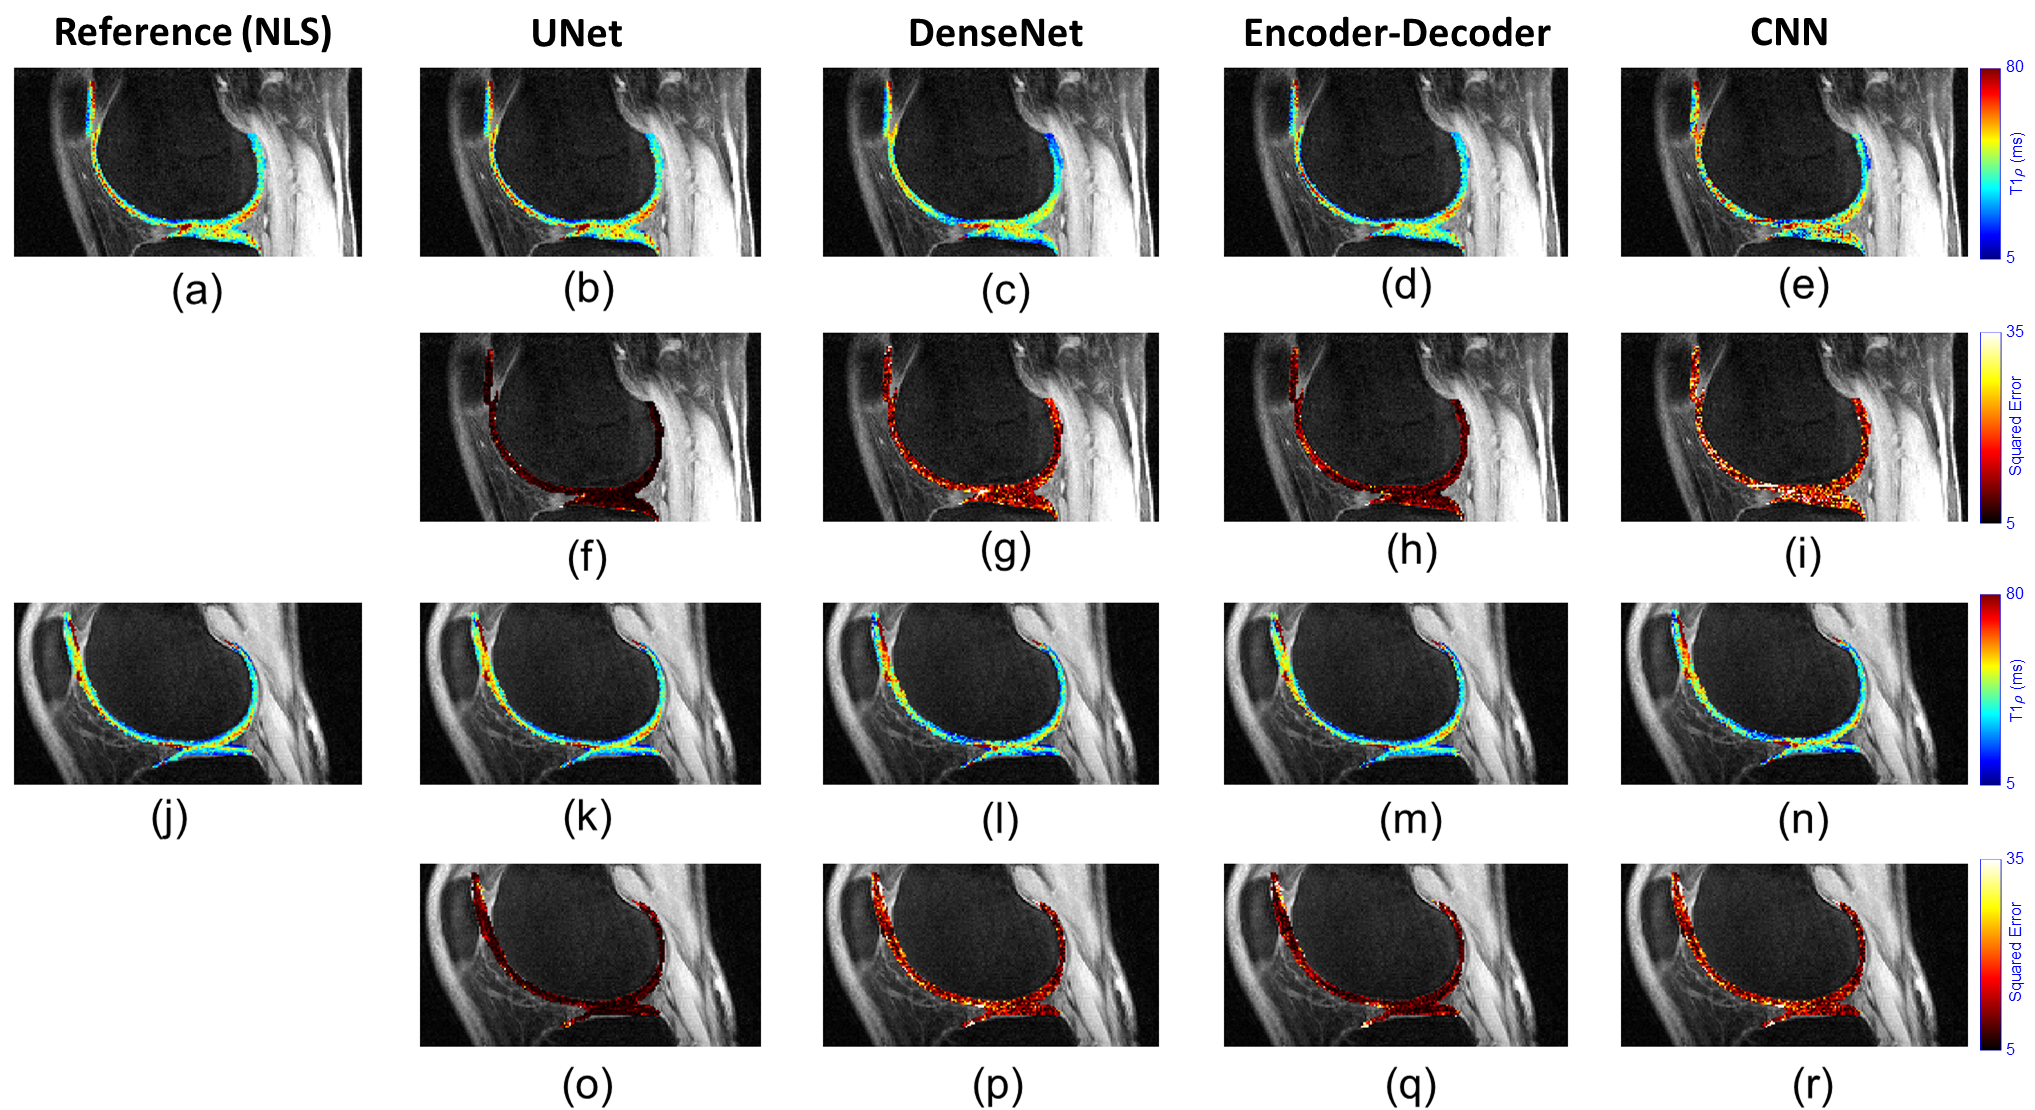
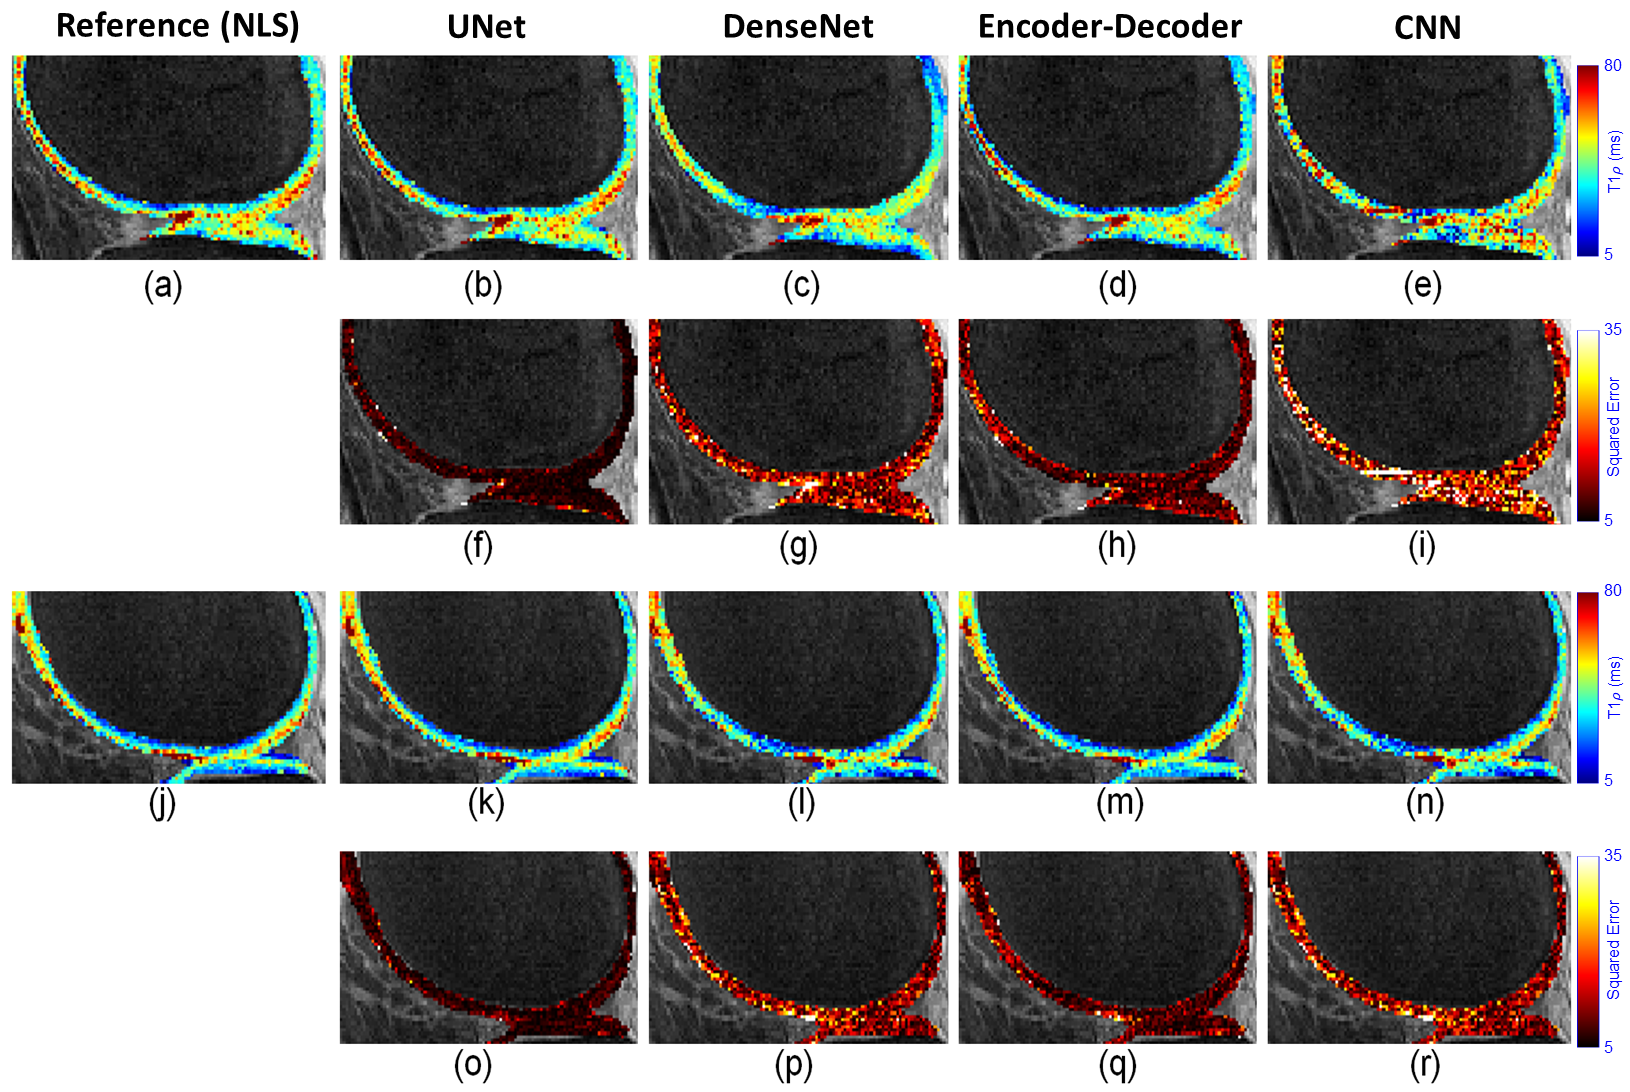
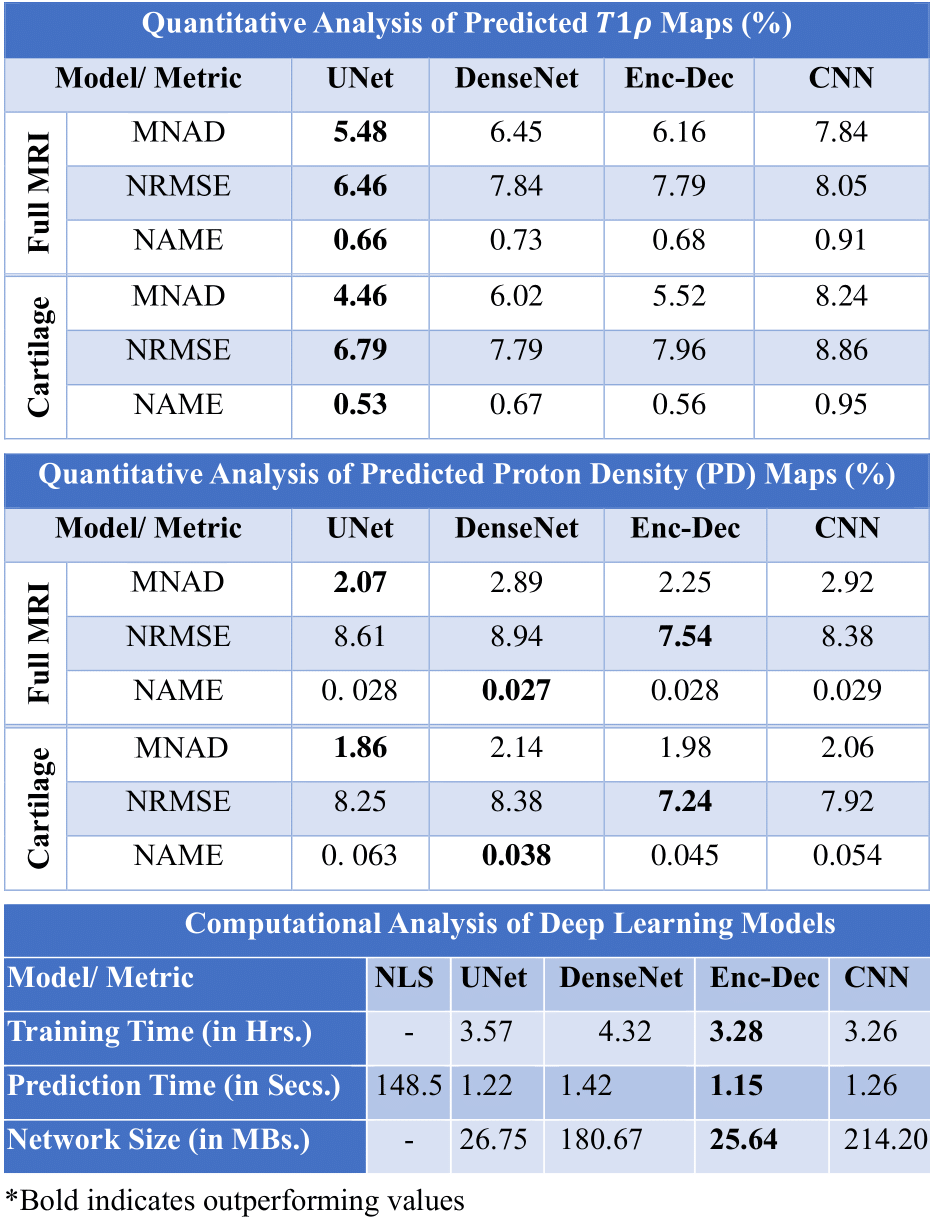
Figures 2 to 4 present a visual analysis (full knee joint, cartilage only, and zoom-in cartilage) of predicted T1$$$\rho$$$ maps obtained from the proposed DL models. The analysis reveals that UNet outperforms the others, as its predicted T1$$$\rho$$$ maps closely matched with the reference maps, and the corresponding errors are lower.Table 1 shows the quantitative analysis among proposed DL models in terms of median of normalized absolute deviation (MNAD), normalized root mean squared error (NRMSE), and normalized absolute mean error (NAME) across full knee joint and cartilage-only ROIs. Other metrics such as training time (in hours), prediction time (in seconds), and model size (in MBs) were also compared among four different DL models.
Conclusion
An efficient model for the joint prediction of T1$$$\rho$$$ and PD maps was introduced, employing four DL models. Experimental results underscored the superior performance of UNet-based model in predicting T1$$$\rho$$$ maps, both visually and quantitatively. While all models improved PD mapping, CNN exhibited a slight advantage. Moreover, in terms of computational efficiency, UNet, and Encoder-Decoder-based models distinguished themselves with shorter training and prediction times, along with minimal memory requirements. Overall, the proposed models are 129 times faster than the benchmark NLS method. In the near future, we plan to extend the proposed DL models to handle undersampled k-space data.Acknowledgements
This study was supported by NIH grants, R01-AR076328-01A1, R01-AR076985-01A1, and R01-AR078308-01A1 and was performed under the rubric of the Center of Advanced Imaging Innovation and Research (CAI2R), an NIBIB Biomedical Technology Resource Center (NIH P41-EB017183).References
1. Ehmig, Jonathan, Günther Engel, Joachim Lotz, Wolfgang Lehmann, Shahed Taheri, Arndt F. Schilling, Ali Seif Amir Hosseini, and Babak Panahi. "MR-Imaging in Osteoarthritis: Current Standard of Practice and Future Outlook." Diagnostics 13, no. 15 (2023): 2586.
2. de Moura, Hector L., Rajiv G. Menon, Marcelo VW Zibetti, and Ravinder R. Regatte. "Optimization of spin-lock times for T1$$$\rho$$$ mapping of human knee cartilage with bi-and stretched-exponential models." Scientific Reports 12, no. 1 (2022): 16829.
3. Li, Hongyu, Mingrui Yang, Jeehun Kim, Ruiying Liu, Chaoyi Zhang, Peizhou Huang, Sunil Kumar Gaire, Dong Liang, Xiaojuan Li, and Leslie Ying. "Ultra-fast simultaneous T1$$$\rho$$$ and T2 mapping using deep learning." In Proceedings of the 28th Annual Meeting of ISMRM, Virtual Conference and Exhibition, vol. 2669. 2020.
4. Zibetti, Marcelo VW, Azadeh Sharafi, and Ravinder R. Regatte. "Optimization of spin‐lock times in T1$$$\rho$$$ mapping of knee cartilage: Cramér‐Rao bounds versus matched sampling‐fitting." Magnetic Resonance in Medicine 87, no. 3 (2022): 1418-1434.
5. Li, Hongyu, Mingrui Yang, Jee Hun Kim, Chaoyi Zhang, Ruiying Liu, Peizhou Huang, Dong Liang, Xiaoliang Zhang, Xiaojuan Li, and Leslie Ying. "SuperMAP: Deep ultrafast MR relaxometry with joint spatiotemporal undersampling." Magnetic Resonance in Medicine 89, no. 1 (2023): 64-76.
6. Fu, Zhiyang, Sagar Mandava, Mahesh B. Keerthivasan, Zhitao Li, Kevin Johnson, Diego R. Martin, Maria I. Altbach, and Ali Bilgin. "A multi-scale residual network for accelerated radial MR parameter mapping." Magnetic resonance imaging 73 (2020): 152-162.
7. Liu, Fang, Alexey Samsonov, Lihua Chen, Richard Kijowski, and Li Feng. "SANTIS: sampling‐augmented neural network with incoherent structure for MR image reconstruction." Magnetic resonance in medicine 82, no. 5 (2019): 1890-1904.
8. Liu, Fang, Richard Kijowski, Georges El Fakhri, and Li Feng. "Magnetic resonance parameter mapping using model‐guided self‐supervised deep learning." Magnetic resonance in medicine 85, no. 6 (2021): 3211-3226.
Figures