2263
Graph Analysis of MRI-Derived Radiomics in Articular Knee Cartilage: Differentiating Healthy from Osteoarthritic Joints1Department of Cybernetics and Biomedical Engineering, VSB Technical University of Ostrava, Ostrava, Czech Republic, 2Department of Biomedical Imaging and Image-guided Therapy, High Field MR Centre, Medical University of Vienna, Vienna, Austria, 3CD Laboratory fo MR Imaging Biomarkers (BIOMAK), Vienna, Austria, 4Department of Imaging Methods, Faculty of Medicine, University of Ostrava, Ostrava, Czech Republic, 5Department of Imaging Method, University Hospital Ostrava, Ostrava, Czech Republic, 6Austrian Cluster for Tissue Regeneration, Ludwig Boltzmann Institute for Experimental and Clinical Traumatology, Vienna, Austria, 7Institute for Clinical Molecular MRI in the Musculoskeletal System, Karl Landsteiner Society, Vienna, Austria
Synopsis
Keywords: Cartilage, Radiomics
Motivation: Our study examines the utility of graph-based analyses in revealing the interplay of radiomic features in knee osteoarthritis (OA), specifically to discover patterns that are hidden in traditional analyses.
Goal(s): To differentiate radiomic profiles of healthy individuals from OA patients using graph-based methodologies and identify key features associated with OA progression.
Approach: We analyze feature interconnections within knee joint compartments using MRI-based radiomics and cosine similarity graphs to evaluate features from 20 subjects.
Results: Clustering coefficients and path lengths within the graphs revealed a distinct, pathology-driven convergence of radiomic features in OA patients compared to controls.
Impact: The graph analysis revealed a convergence of radiomic features in OA, potentially contributing to a better understanding of the disease and therefore opening the path to novel analysis strategies.
Introduction
The rapidly developing field of radiomics has opened up another frontier in medical imaging. As a result, itis possible to extract a wide range of quantitative features from standard clinical images in a high-dimensional manner. These features, which capture the underlying pathophysiology of tissues, have shown promise for improving diagnosis, prognosis, and treatment stratification in a variety of diseases, including OA1,2,3. Radiomics offers tens of features, such as shape, texture, and intensity, that provide a comprehensive understanding of the image4,5. However, other methodologies are needed to understand not just the individual features but also their interactions. Thus, in this study, we use graph-based methods to visualize and analyze complex interconnections between MRI-based radiomic features, providing a system-level perspective that is often obscured in traditional analysis. This graph-based methodology not only enhances our understanding of the radiomic landscape in knee OA but also sets the stage for developing predictive models that could transform patient management by providing a nuanced, data-driven view of the disease.Methods
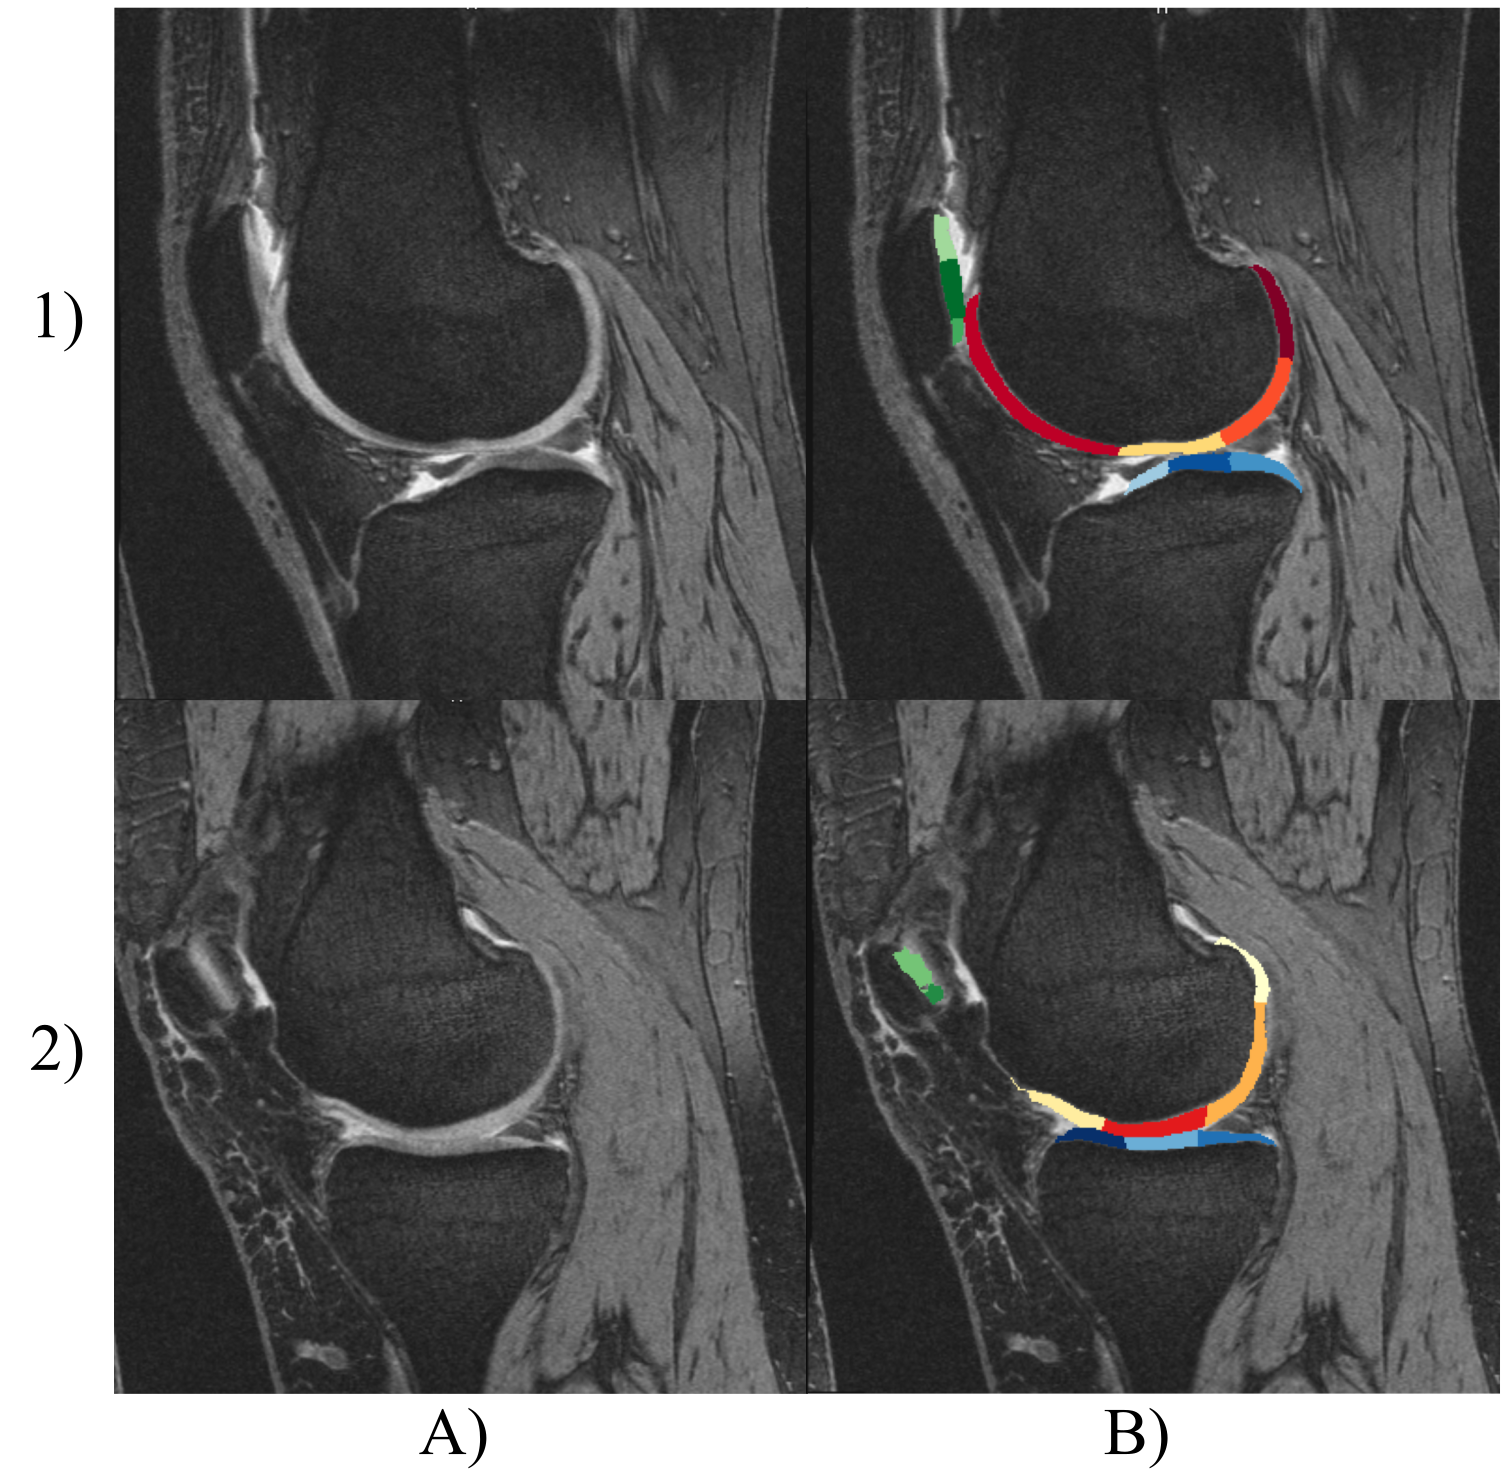
Analysed cohort consisted of 20 subjects from the baseline measurement of the Osteoarthritis Initiative (OAI) study. Selected subjects did not have knee injury or surgery prior to the baseline measurements. Ten subjects (5 males, 5 females, 49.8±1.7 years, BMI 32.0±1.4, KL (Kellgren and Lawrence system) =0) served as controls. Other ten subjects (4 males, 6 females, 51.2±2.6 years, BMI 32.3±1.1, 5x KL=2, 5x KL=3) were considered as patients with OA.The automatic segmentation was performed on the Double Echo Steady State images (3D DESS) using the MR ChondralHealth version 3.1 research application software (Siemens Healthineers AG, Forchheim, Germany, segmentation algorithm based on the work from6,7) obtaining 9 anatomical regions for the femoral cartilage: medial anterior (MaF)/central (McF)/posterior (MpF); trochlear lateral (TL)/central (TC)/medial (TM) and lateral anterior (LaF)/central (LcF)/posterior (LpF), see Figure 1.
Utilizing the PyRadiomics library4, we extracted a suite of twenty features including shape, size, texture, and intensity-based parameters for each segmented label. Feature extraction was parameterized to include a comprehensive set of Gray Level Co-occurrence Matrix (GLCM) features, capturing the textural patterns within the cartilage that may correlate with early degenerative changes (e.g. autocorrelation, contrast or entropy).
Then, we grouped the radiomic features based on their corresponding anatomical regions within the knee joint: medial, lateral, and patellofemoral compartments. We normalized the features to account for inter-patient variability and employed cosine similarity to construct graphs, with nodes representing individual patients and edges weighted by feature vector similarities. Community detection algorithms and centrality measures were employed to discern the structure, aiming to identify patterns indicative of healthy versus pathological states. The Girvan-Newman algorithm was used for community detection, while degree, closeness, and betweenness centrality metrics provided insights into the connectivity and importance of individual nodes.
Results
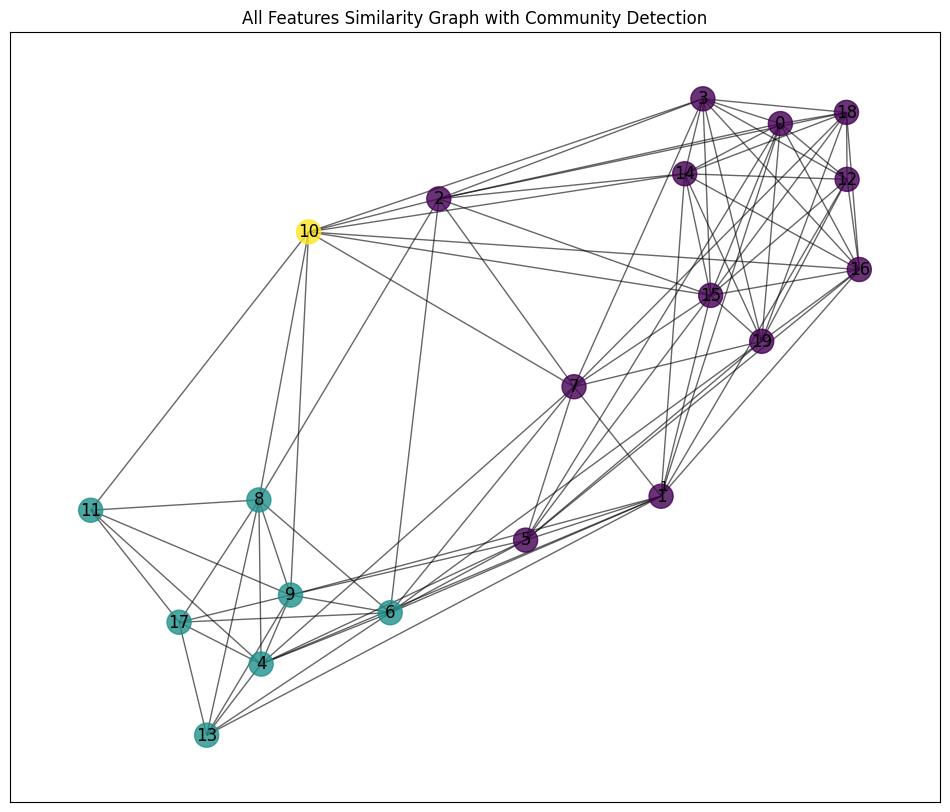
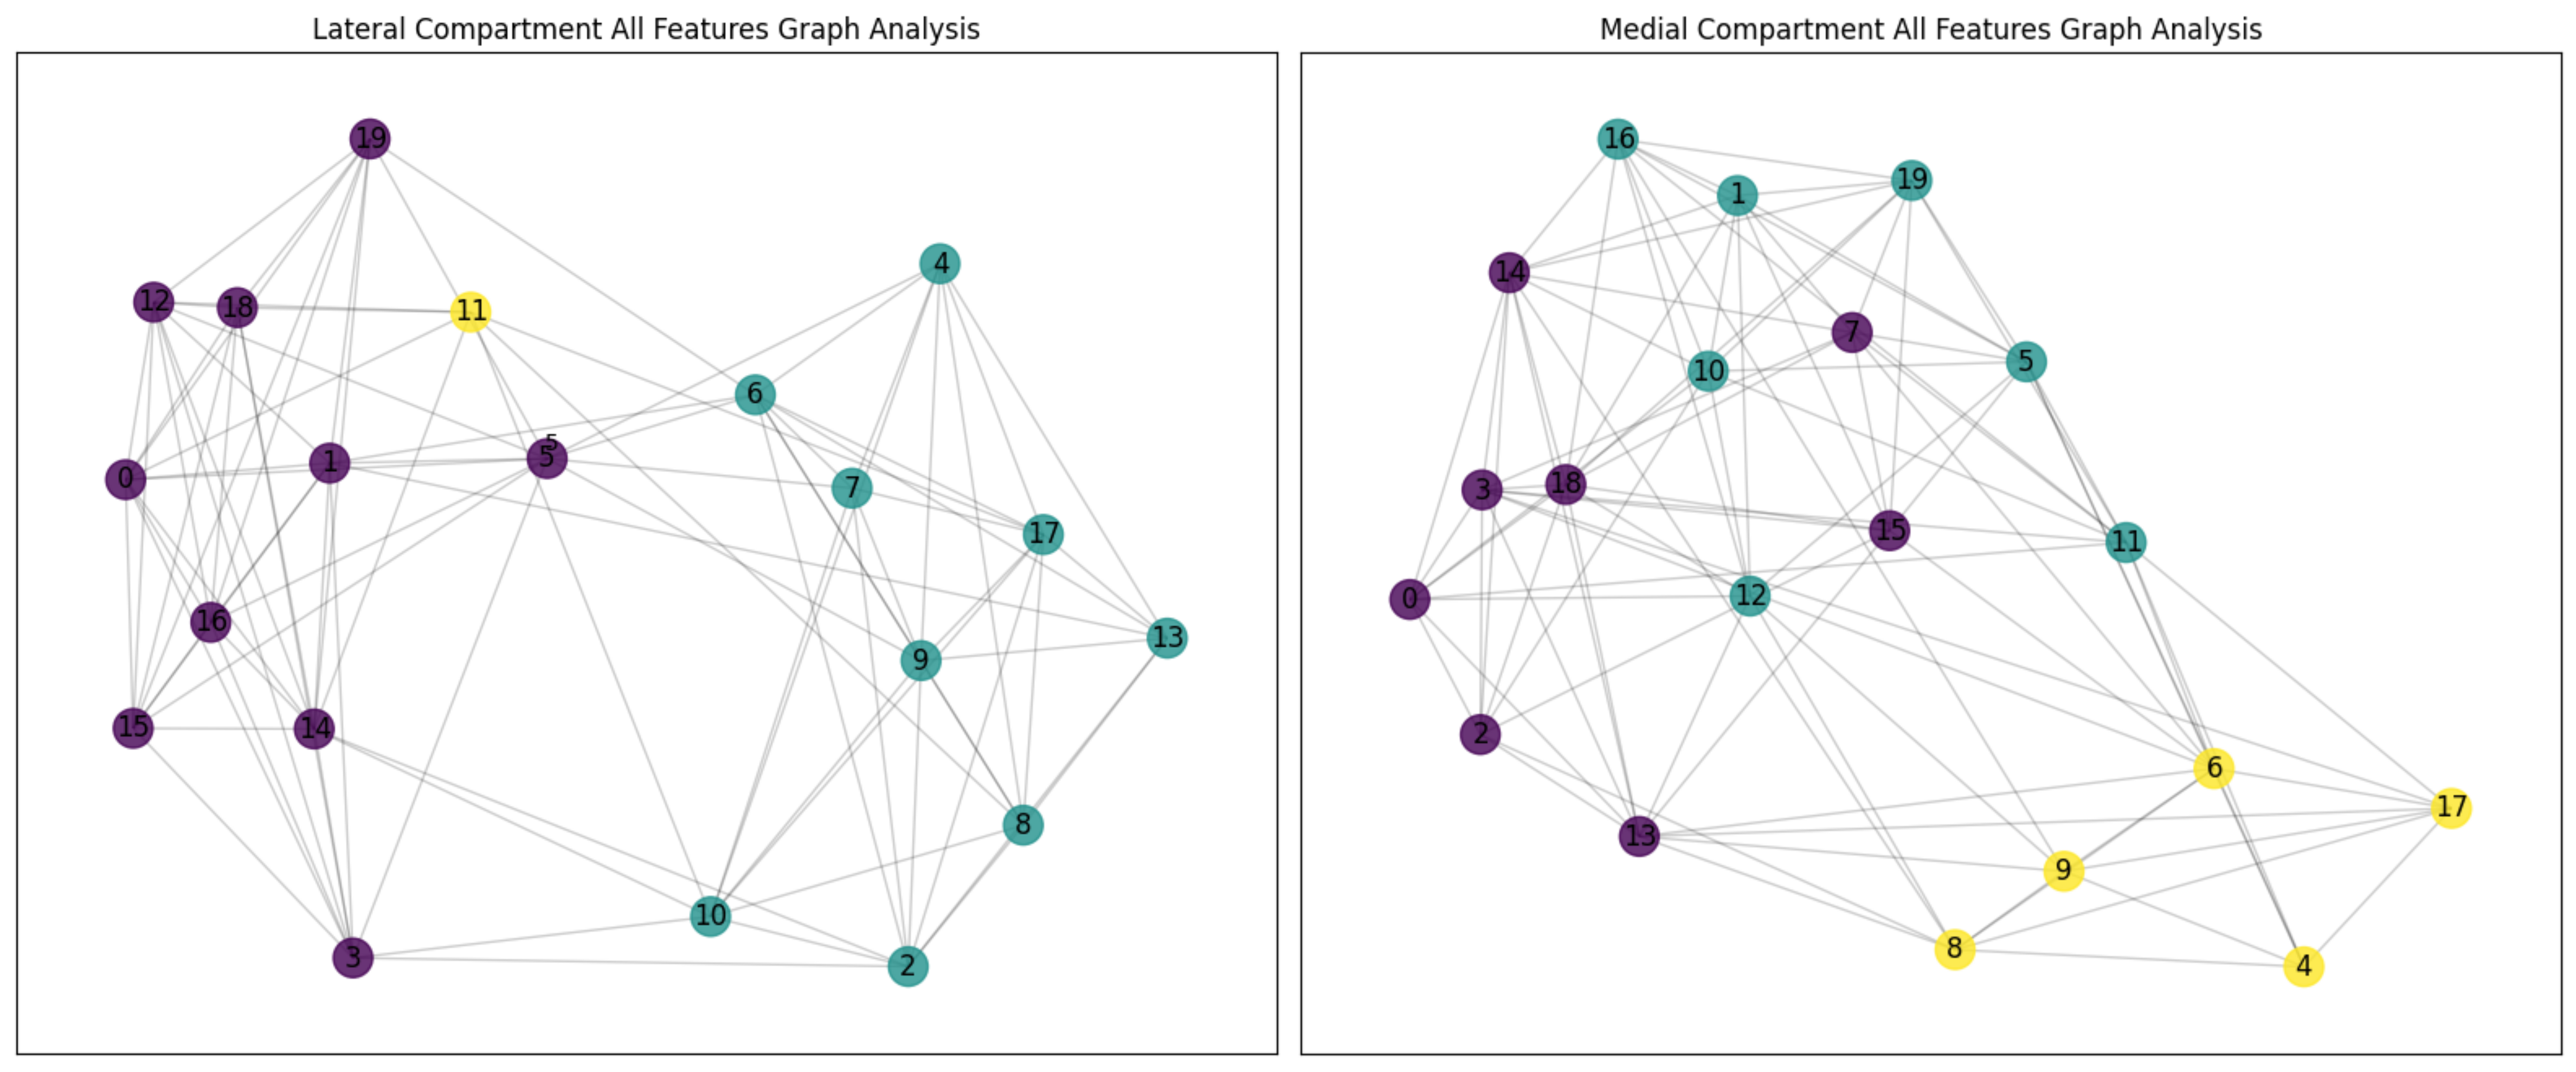
The similarity graphs revealed distinct clustering patterns between control and OA group. In the control, the graph had sparser connections, reflecting a more diverse radiomic feature set. Conversely, the patient group graph was characterized by denser connectivity, suggesting a mutual convergence of features due to pathological changes, see Figure 2. Interestingly, the Girvan-Newman method identified three communities within the graph.There were pronounced differences in the lateral and medial compartments between the groups, with the patient graphs showing greater clustering coefficients and shorter average path lengths, see Figure 3.
The graph properties reveal the average clustering = 0.523 and 0.713 for control and patient group, respectively. There was a slight increase in the average shortest path length in the patient group (1.956) compared with the control group (1.667). A higher global clustering coefficient is found in the patient group (0.692) than in the control group (0.484). The centrality analysis identified several nodes with a high betweenness centrality in the patient group; these may represent pivotal patterns in the radiomics associated with OA progression.
Discussion and Conclusion
In our study, a graph-based analysis of radiomic features in knee OA revealed a nuanced picture of the disease's impact on the knee's properties. The observation of denser connectivity in the patient group compared to controls suggests that OA induces a mutual convergence of radiomic features, reflecting underlying pathophysiological changes. Therefore, graph-based methods can enhance our understanding of OA. The study has several limitations, such as the limited number of patients and the limited number of features. Further research should investigate the use of graph-based methods for other prominent quantitative MRI techniques such as T2 mapping or dGEMRIC. Besides investigating the therapeutic implications of the detected patterns, these potential biomarkers require further validation. Thus, as radiomics advances, graph-based analyses will be more important for interpreting high-dimensional imaging data.Acknowledgements
This article was co-funded by the European Union under the REFRESH – Research Excellence For Region Sustainability and High-tech Industries project number CZ.10.03.01/00/22 003/0000048 via the Operational Programme Just Transition and by the Ministry of Education of the Czech Republic under project SP2023/042.References
- Janacova, V., Szomolanyi, P., Kirner, A., Trattnig, S., & Juras, V. (2022). Adjacent cartilage tissue structure after successful transplantation: a quantitative MRI study using T2 mapping and texture analysis. European Radiology, 32(12), 8364-8375.
- Hirvasniemi, J., Klein, S., Bierma-Zeinstra, S., Vernooij, M. W., Schiphof, D., & Oei, E. H. (2021). A machine learning approach to distinguish between knees without and with osteoarthritis using MRI-based radiomic features from tibial bone. European radiology, 31, 8513-8521.
- Lin, T., Peng, S., Lu, S., Fu, S., Zeng, D., Li, J., ... & Ding, C. (2023). Prediction of knee pain improvement over two years for knee osteoarthritis using a dynamic nomogram based on MRI-derived radiomics: a proof-of-concept study. Osteoarthritis and Cartilage, 31(2), 267-278.
- Van Griethuysen, J. J., Fedorov, A., Parmar, C., Hosny, A., Aucoin, N., Narayan, V., ... & Aerts, H. J. (2017). Computational radiomics system to decode the radiographic phenotype. Cancer research, 77(21), e104-e107.
- Rizzo, S., Botta, F., Raimondi, S., Origgi, D., Fanciullo, C., Morganti, A. G., & Bellomi, M. (2018). Radiomics: the facts and the challenges of image analysis. European radiology experimental, 2(1), 1-8.
- Fripp, J., Crozier, S., Warfield, S. K., & Ourselin, S. (2009). Automatic segmentation and quantitative analysis of the articular cartilages from magnetic resonance images of the knee. IEEE transactions on medical imaging, 29(1), 55-64.
- Chandra, S. S., Xia, Y., Engstrom, C., Crozier, S., Schwarz, R., & Fripp, J. (2014). Focused shape models for hip joint segmentation in 3D magnetic resonance images. Medical image analysis, 18(3), 567-578.
Figures