2262
Healthy Knee Cartilage T2 Relaxation properties at 0.55T using Radial TSE approach: A comparison with 3.0T MAPSS1Department of Radiology & Biomedical Imaging, University of California, San Francisco (UCSF), San Francisco, CA, United States, 2Siemens Medical Solutions USA Inc., Malvern, PA, United States
Synopsis
Keywords: Cartilage, Low-Field MRI
Motivation: Baseline healthy-knee-cartilage reference comparisons across 0.55T and 3.0T can be utilized for comparing healthy to diseased cartilage in early-to-moderate OA at 0.55T.
Goal(s): To compute and compare T2-baseline relaxation time measurements of healthy knee cartilage obtained at 0.55T using Radial-TSE approach with 3.0T using MAPSS, paired with DL-based cartilage segmentation.
Approach: Phantom and Healthy Knee-cartilage-compartmental T2 relaxation values are compared using Exp2 and Sepg3 approaches with Radial TSE at 0.55T and 3.0T MAPSS.
Results: We demonstrated healthy knee cartilage reference T2-values at 0.55T using Radial-TSE. Average T2-increase from 3.0T to 0.55T yields a wider range for detecting voxel-by-voxel granular changes of the cartilage.
Impact: Baseline healthy-knee-cartilage reference Radial-TSE-T2 at 0.55T and T2-MAPSS-3.0T comparisons can be utilized for assessing healthy and diseased cartilage in early-to-moderate OA at 0.55T. Research findings at 3.0T could be translated at low-field economic scanners with a wider range of early-detection.
Introduction
Characterizing cartilage quality in degenerative-joint diseases has heavily relied on T2 relaxation properties of cartilage compartments, which is well-established at 3.0T via Magnetization-Prepared-Angle-Modulated Partitioned-k-Space-Spoiled-Gradient-Echo-Snapshots (MAPSS)(1)(2)(3)(4). Low-field MRIs (0.55T) have recently undergone a period of marked developments making the systems suitable for clinical adoption(5). T2 relaxation times at 0.55T estimated using 2D-multi-echo-spin-echo (MESE) techniques and dictionary-based fitting approaches were reportedly similar to that of 1.5T for cartilage(6). However, multiple confounding variables (B1, RF-profile, refocusing flip-angle, choice of TEs, and imaging artifacts) can generate distorted signals and inaccurate T2 quantification in addition to longer scan times and thicker slice acquisitions in such approaches(7).Radially-sampled techniques combined with turbo-spin-echo (TSE) with stimulated-echo-compensation, have been proven useful in overcoming long acquisition times in MESE, previously at 3.0T(8). This study computes and compares T2 baseline relaxation time measurements of healthy-knee cartilage obtained at 0.55T using automated and time-efficient Radial-TSE (having smaller slice-thickness than MESE) with 3.0T using MAPSS, paired with DL-based cartilage segmentation.Methodolgy
Phantom Validation: A phantom of falcon tubes with 3 varying agarose solutions [2%, 3%, 4%] (9) was scanned at a 3.0T and 0.55T scanner.Healthy Subjects: In this prospective study approved by the local Institutional Review Board (IRB), seven healthy subjects (Age: 29.57 ± 5.25 years, BMI: 23.47 ± 2.74, 3 females), without clinical symptoms of knee OA and no history of surgery/ trauma, provided written informed consents, and underwent two consecutive MRI scans on a 3.0T and a 0.55T with an hour of rest in between.
MRI Acquisition: For the healthy subjects, additional morphological sequences (3D-Space at 0.55T and 3D-Cube at 3.0T) were acquired. For T2relaxation mapping, a Radial-TSE sequence(8) was acquired at 0.55T, and a MAPSS sequence at 3.0T(10). Further details of the scanning sequence, parameters, scan times, and coils are provided in Table-1. For Radial-TSE at 0.55T, two T2 relaxation maps were generated inline using: (i) 2-parameter exponential model: Exp2(M0, T2) applied in the least-square fitting using the Levenberg-Marquardt algorithm, and (ii) 3-parameter SEPG model: SEPG3(M0, T2, B1) by generating dictionaries to enable fitting parameters by maximizing the normalized dot product of the measured and simulated signals(7). For MAPSS at 3.0T, the T2 maps were obtained on a per-voxel basis using a pre-validated approach(11).
Analysis: Three cartilages(Femur, Tibia, Patella) and five sub-compartments (Medial-Femoral/MF, Lateral-Femoral/LF, Medial-Tibial/MT, Lateral-Tibial/LT, Trochlear) were segmented using a pre-validated 3D V-Net architecture(12), from the morphological images. The first-echo images of the relaxometry sequences and T2 maps were geometrically resampled from their respective Dicom-based-anatomical-coordinate-spaces to the voxel-spaces and co-registered (Elastix) with the morphological images. T2 relaxation values were extracted for the three compartments and five sub-compartments for 0.55T and 3.0T. The process flowchart is demonstrated in Figure-1. All analyses were performed using an in-house program developed in MATLAB (version R2021a, The MathWorks Inc., Natick, MA, USA) and RStudio (version 12.0+353; https://www.r-project.org/).
Results and Discussion
Figure-2 summarizes the phantom experimental results. Mean T2 relaxation values with Standard Errors (SE), and the percentage increases from 3.0T to 0.55T for the three major compartments (Femoral, Tibial, and Patellar cartilage) and five sub-compartments (MF, LF, MT, LT, Trochlear), are summarized in Figure 3. Bland-Altman plots in Figure-4, show T2 relaxation values estimated by both the Exp2 and Sepg3 quantitative approaches with Radial TSE at 0.55T are within agreeable limits for all the cartilage compartments compared to 3T MAPSS. The technical feasibility of translating existing quantitative DL-enabled knee tissue segmentation techniques on 0.55T Space sequences, has already been reported to be usable-to-good(13). The intent of this study was to establish baseline healthy cartilage values from faster, less artifactual, working state-of-the-art methods, which can accommodate the needs of smaller slice thickness, i.e., 3 mm, similar or lesser than MAPSS. Wide acceptance of MAPSS enabled by QIBA(14), has yielded a series of OA-focused research findings proven useful for clinicians. The Radial-TSE T2 mapping approach is promising thus far to be utilized for translating similar research findings at 0.55T. Moreover, the average 50% and 73% increase in T2 values from 3.0T to 0.55T Exp2 and Sepg3 respectively, yields a wider range for detecting voxel-by-voxel granular changes of the cartilage, which is narrower and limited at 3.0T.Conclusion
We present one of the first exploratory studies comparing healthy-knee cartilage T2 properties at 0.55T estimated by Radial-TSE, and 3.0T estimated by MAPSS. The baseline reference values for three major and five sub-compartments of healthy cartilages are within agreeable limits between 0.55T and 3.0T. The average percentage increase of T2 values at 0.55T enables a wider range to detect smaller changes in the cartilage areas.Acknowledgements
The work was supported by the UCSF Departmental Seed Grant.References
1. Li X, Han ET, Busse RF, Majumdar S: In vivo T(1rho) mapping in cartilage using 3D magnetization-prepared angle-modulated partitioned k-space spoiled gradient echo snapshots (3D MAPSS). Magn Reson Med 2008; 59:298–307.
2. Morales AG, Lee JJ, Caliva F, et al.: Uncovering associations between data-driven learned qMRI biomarkers and chronic pain. Sci Rep 2021; 11:1–14.
3. Apprich S, Mamisch TC, Welsch GH, et al.: Quantitative T2 mapping of the patella at 3.0 T is sensitive to early cartilage degeneration, but also to loading of the knee. Eur J Radiol 2012; 81:e438–e443.
4. Using Cartilage MRI T2-Mapping to Analyze Early Cartilage Degeneration in the Knee Joint of Young Professional Soccer Players - Leonie Waldenmeier, Christoph Evers, Michael Uder, Rolf Janka, Frank Friedrich Hennig, Milena L. Pachowsky, Götz Hannes Welsch, 2019 [https://journals.sagepub.com/doi/10.1177/1947603518756986]
5. Campbell-Washburn AE, Keenan KE, Hu P, et al.: Low-field MRI: A report on the 2022 ISMRM workshop. Magn Reson Med ; n/a(n/a).
6. Khodarahmi I, Bruno M, Brown R, Fritz J, Keerthivasan MB: Relaxation Times of the Musculoskeletal Tissues at 0.55 T. In Proc Intl Soc Mag Reson Med 31 2023. Toronto, Canada; :1594.
7. Han F, Keerthivasan MB, Deshpande V: Improved T2 Quantification using Noise Corrected Stimulated Echo Compensation. In Proc Intl Soc Mag Reson Med 28 2020; :3803.
8. Bencikova D, Han F, Kannengieser S, et al.: Evaluation of a single-breath-hold radial turbo-spin-echo sequence for T2 mapping of the liver at 3T. Eur Radiol 2022; 32:3388–3397.
9. Gao KT, Pedoia V, Young KA, et al.: Multiparametric MRI characterization of knee articular cartilage and subchondral bone shape in collegiate basketball players. J Orthop Res 2021; 39:1512–1522.
10. Han M, Tibrewala R, Bahroos E, Pedoia V, Majumdar S: Magnetization-prepared spoiled gradient-echo snapshot imaging for efficient measurement of R2-R1ρ in knee cartilage. Magn Reson Med 2022; 87:733–745.
11. Gallo MC, Wyatt C, Pedoia V, et al.: T1ρ and T2 Relaxation Times are Associated with Progression of Hip Osteoarthritis. Osteoarthr Cartil OARS Osteoarthr Res Soc 2016; 24:1399–1407.
12. Astuto B, Flament I, Namiri NK, et al.: Automatic deep learning–assisted detection and grading of abnormalities in knee MRI studies. Radiol Artif Intell 2021; 3.
13. Bhattacharjee R, Akkaya Z, Luitjens J, et al.: Technical Note: Feasibility of translating 3.0T-trained Deep-Learning Segmentation Models Out-of-the-Box on Low-Field MRI 0.55T Knee-MRI of Healthy Controls. 2023.
14. The QIBA Profile for MRI-based Compositional Imaging of Knee Cartilage | Radiology [https://pubs.rsna.org/doi/full/10.1148/radiol.2021204587]
Figures
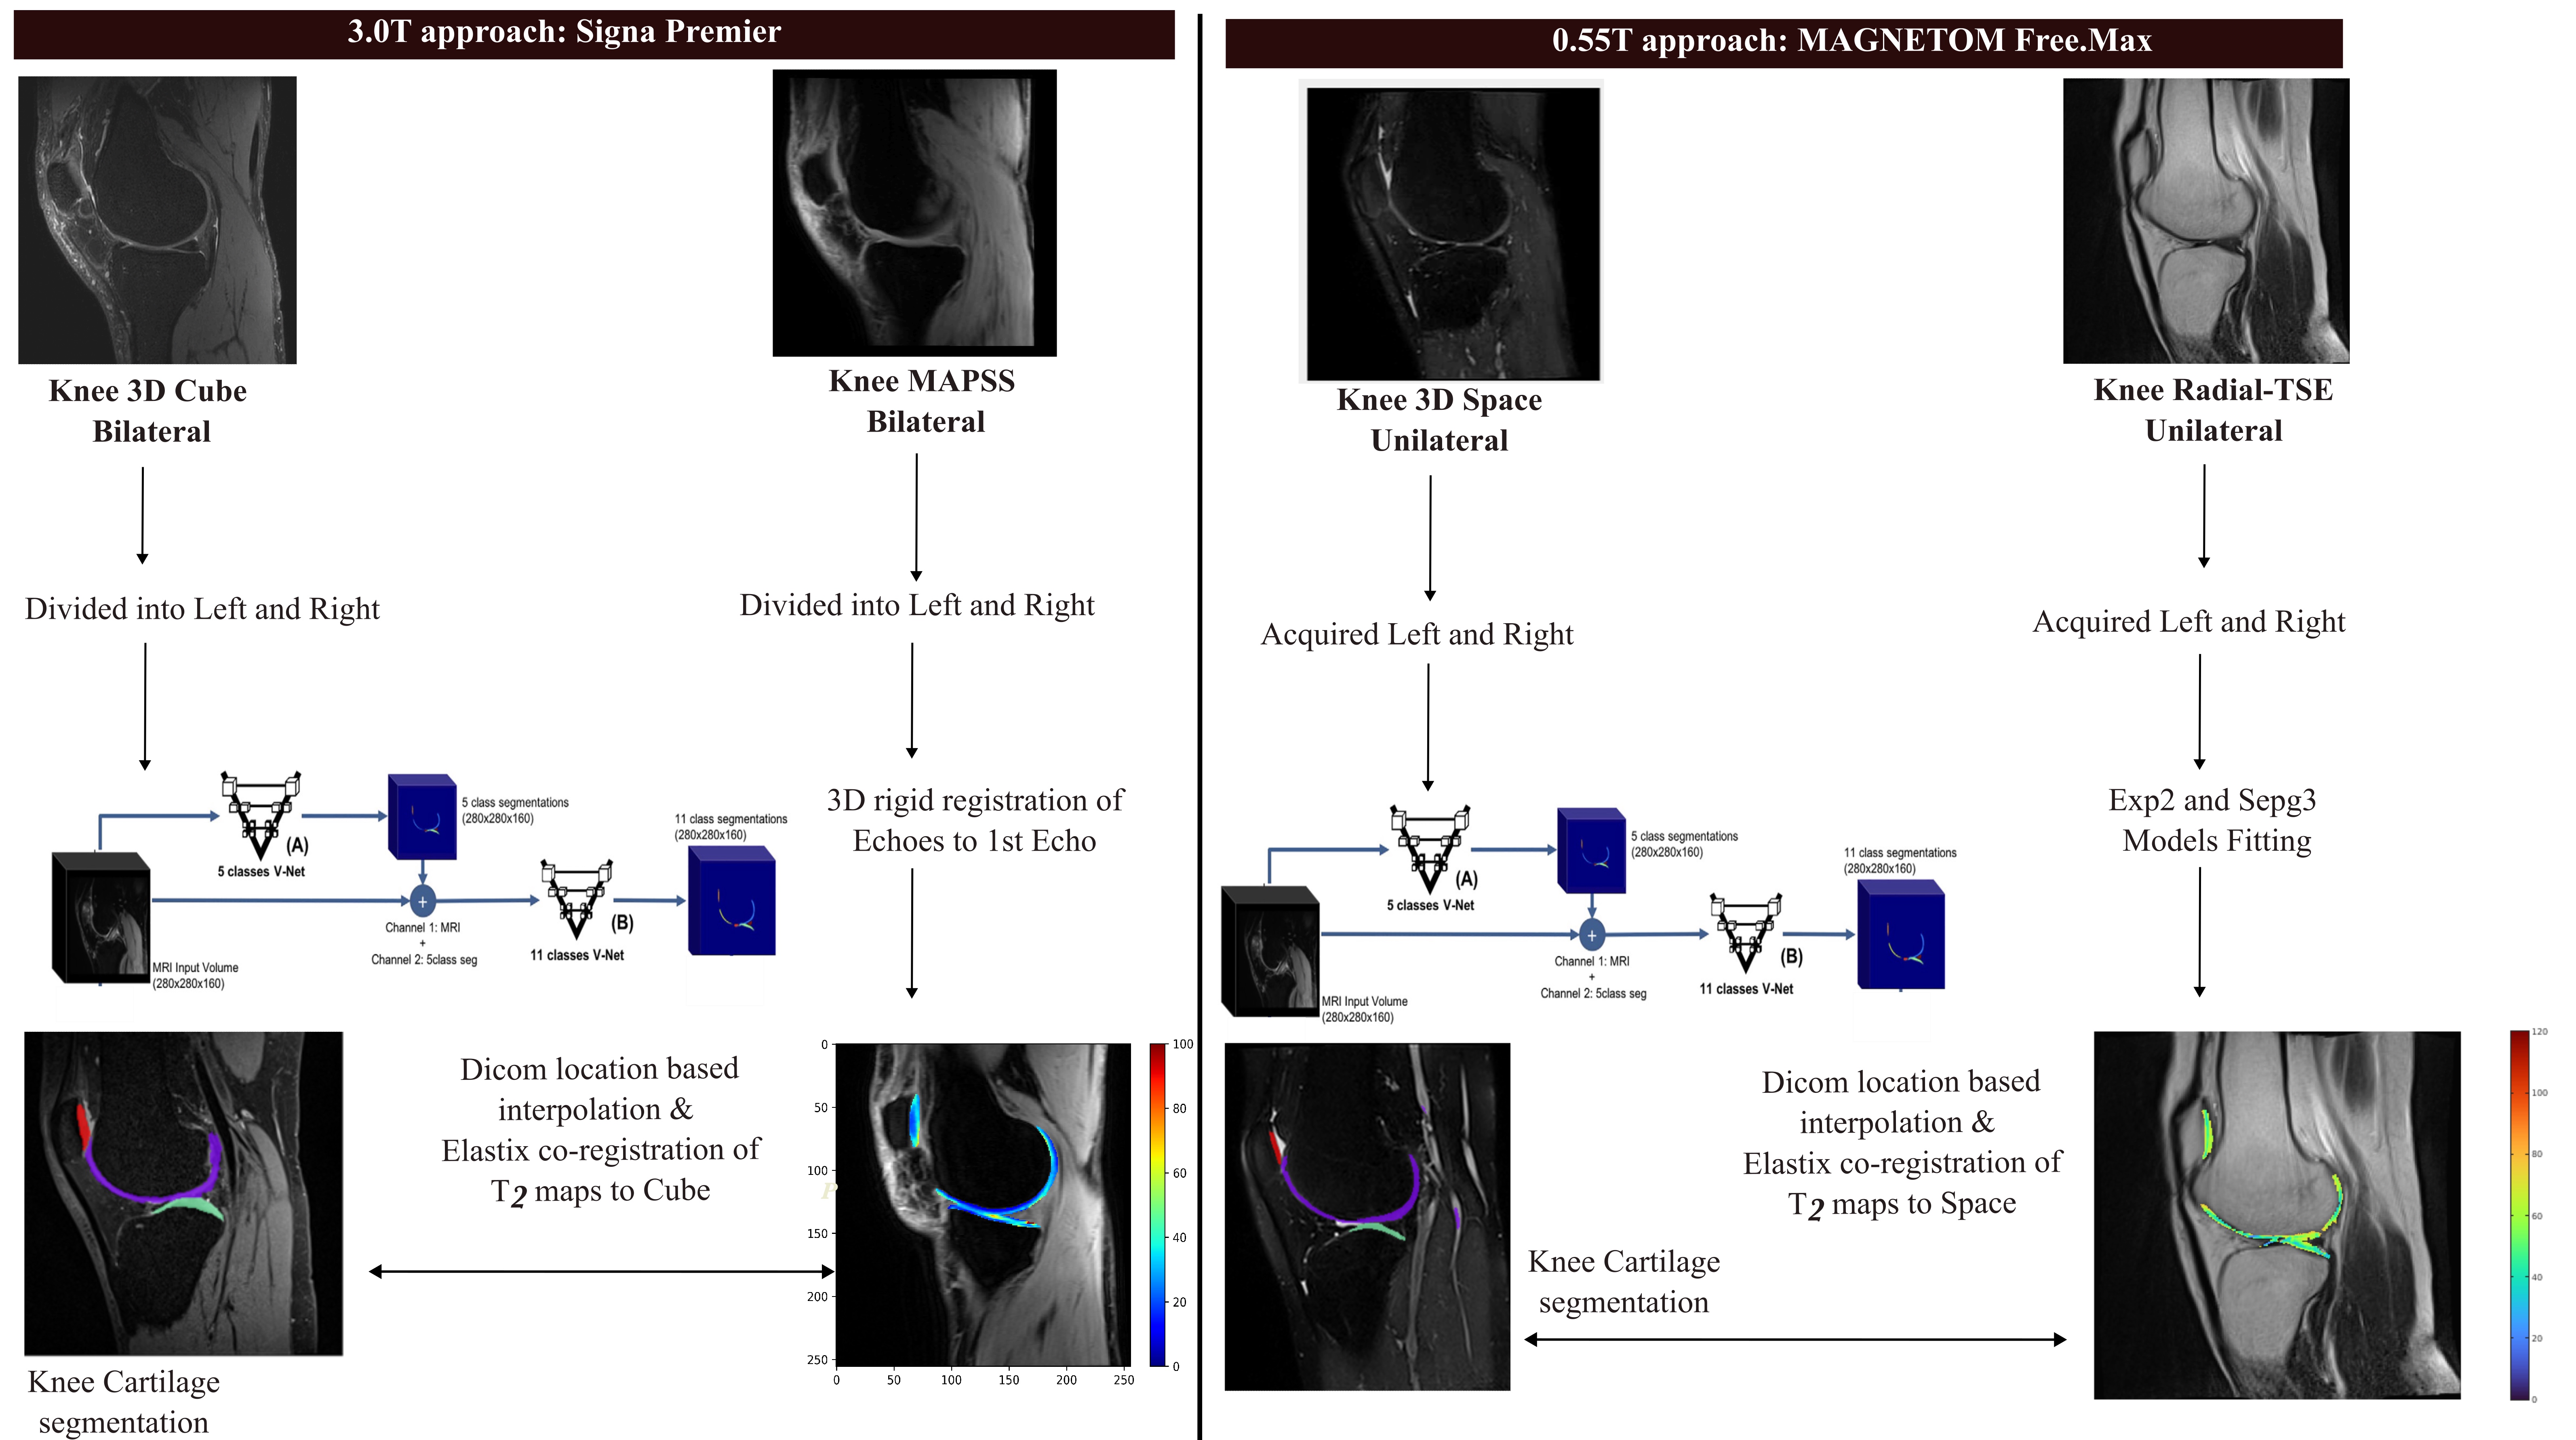
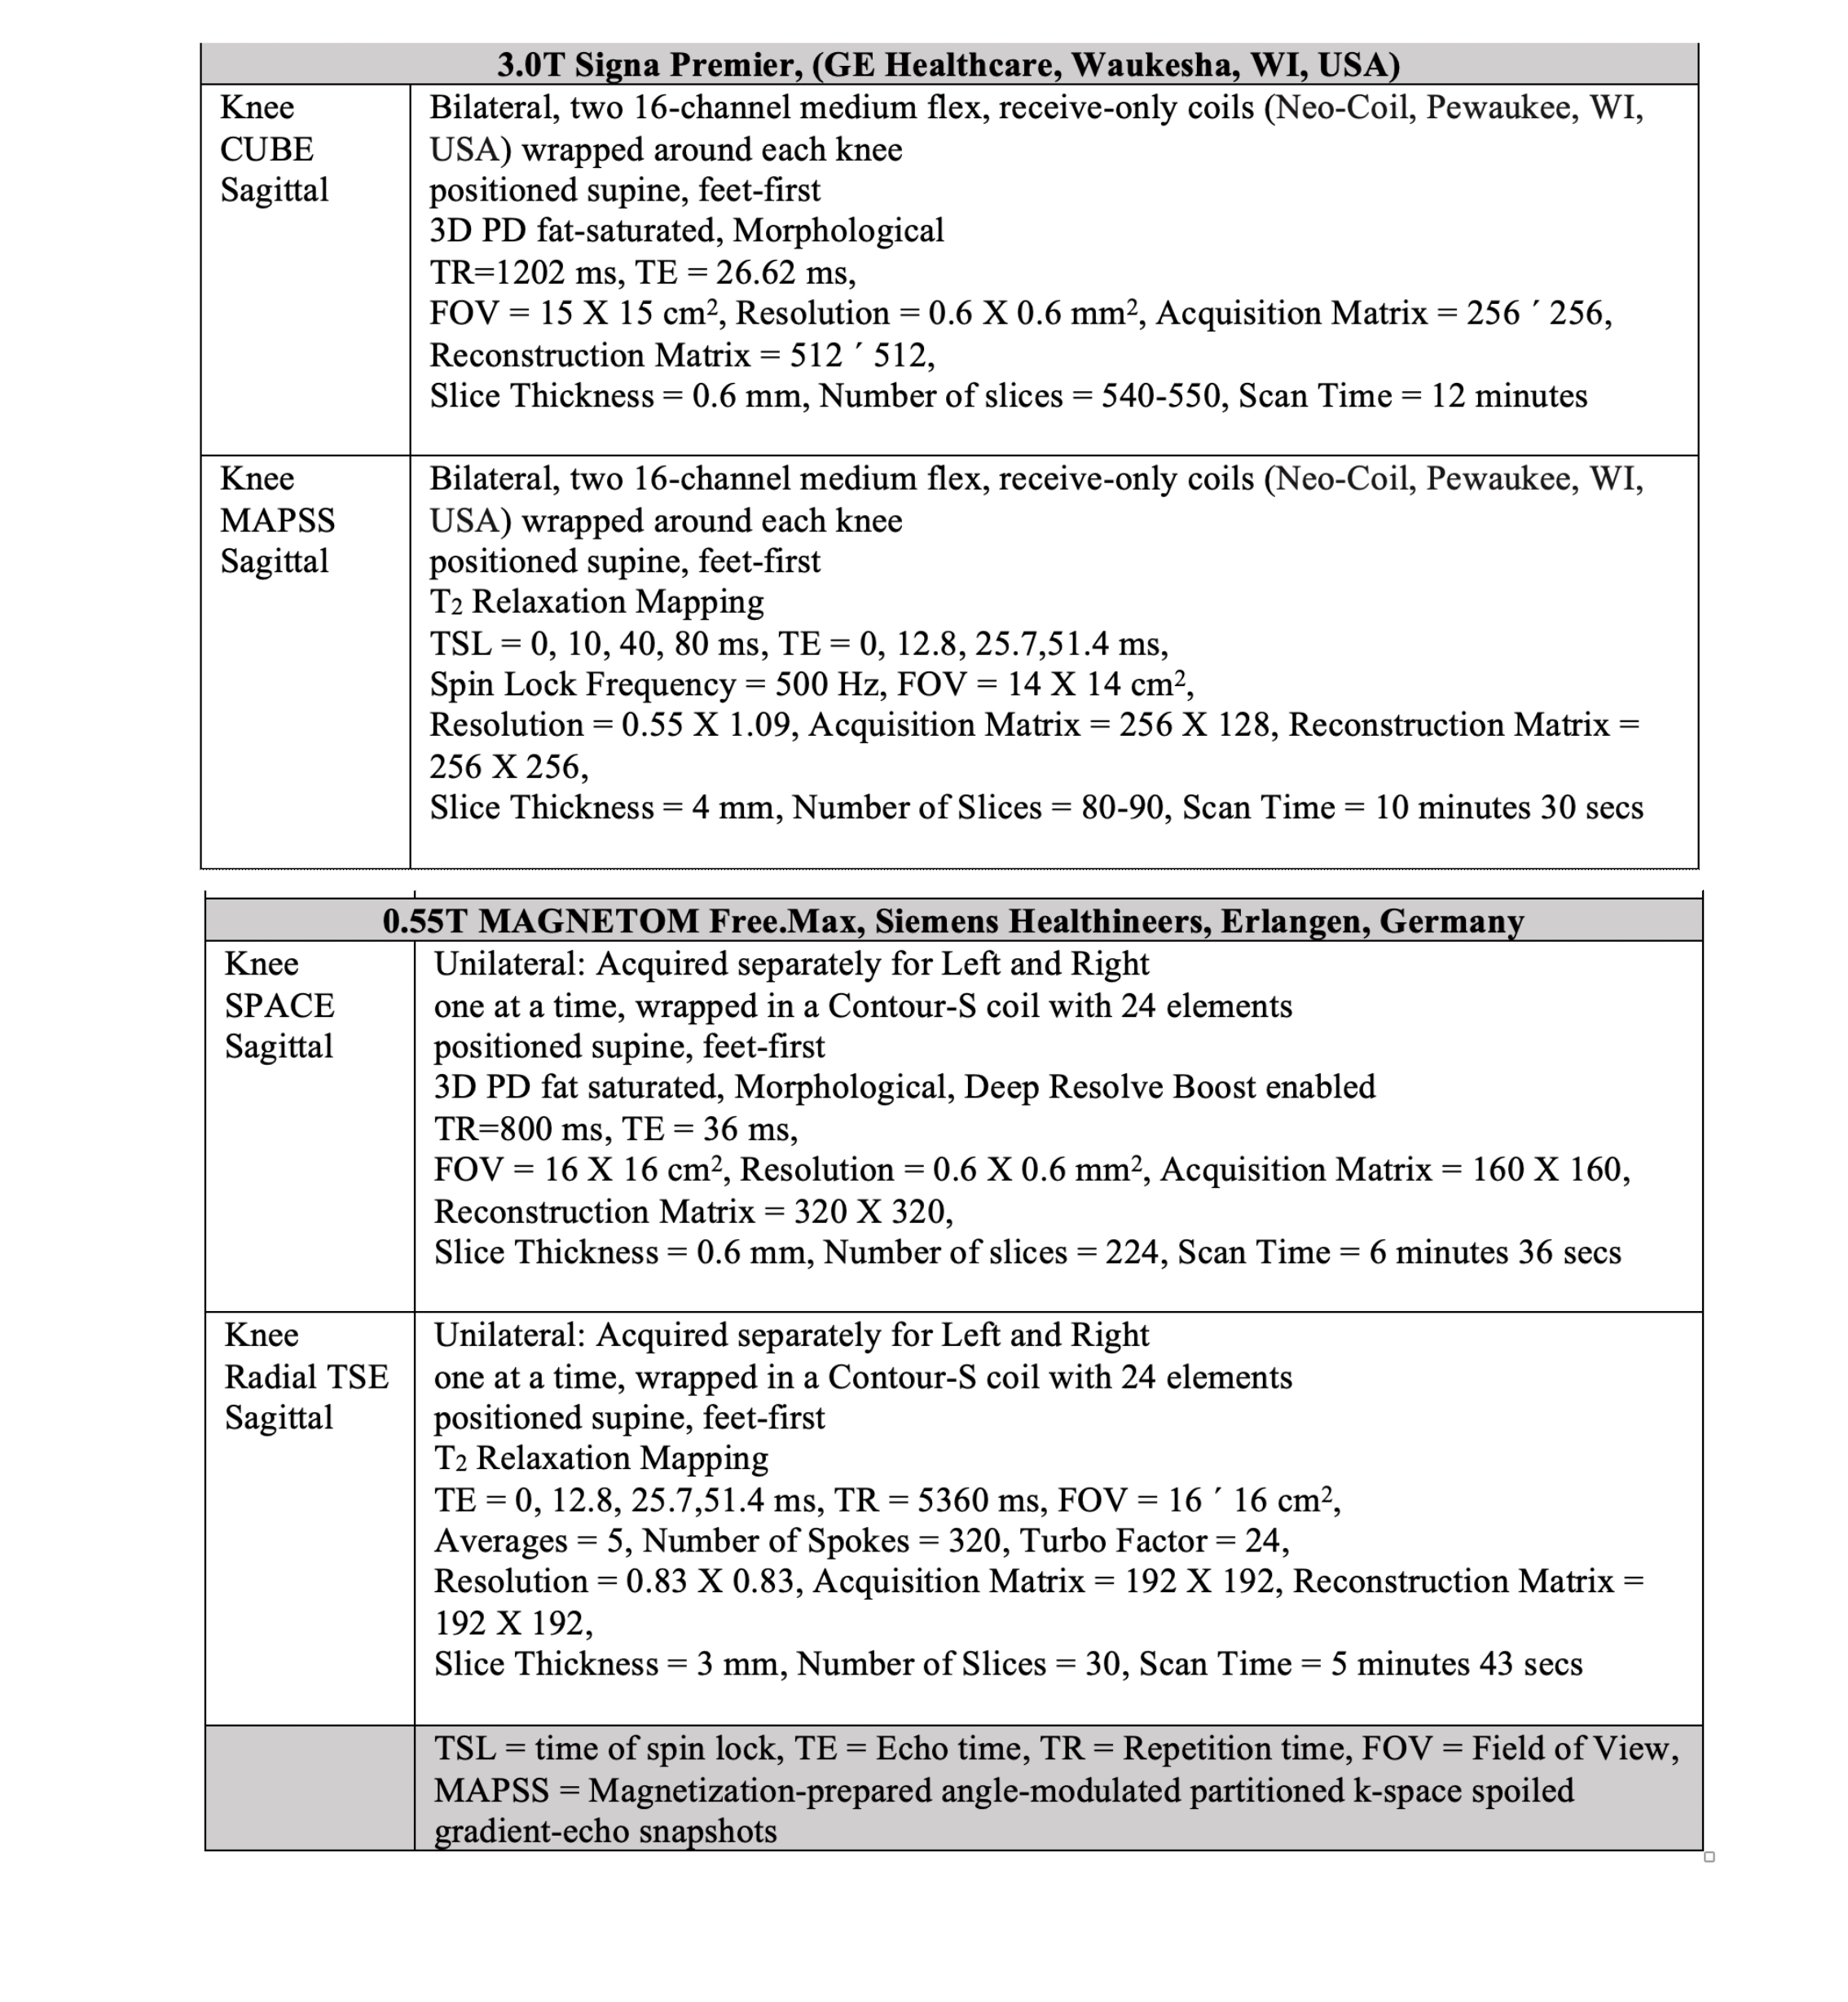
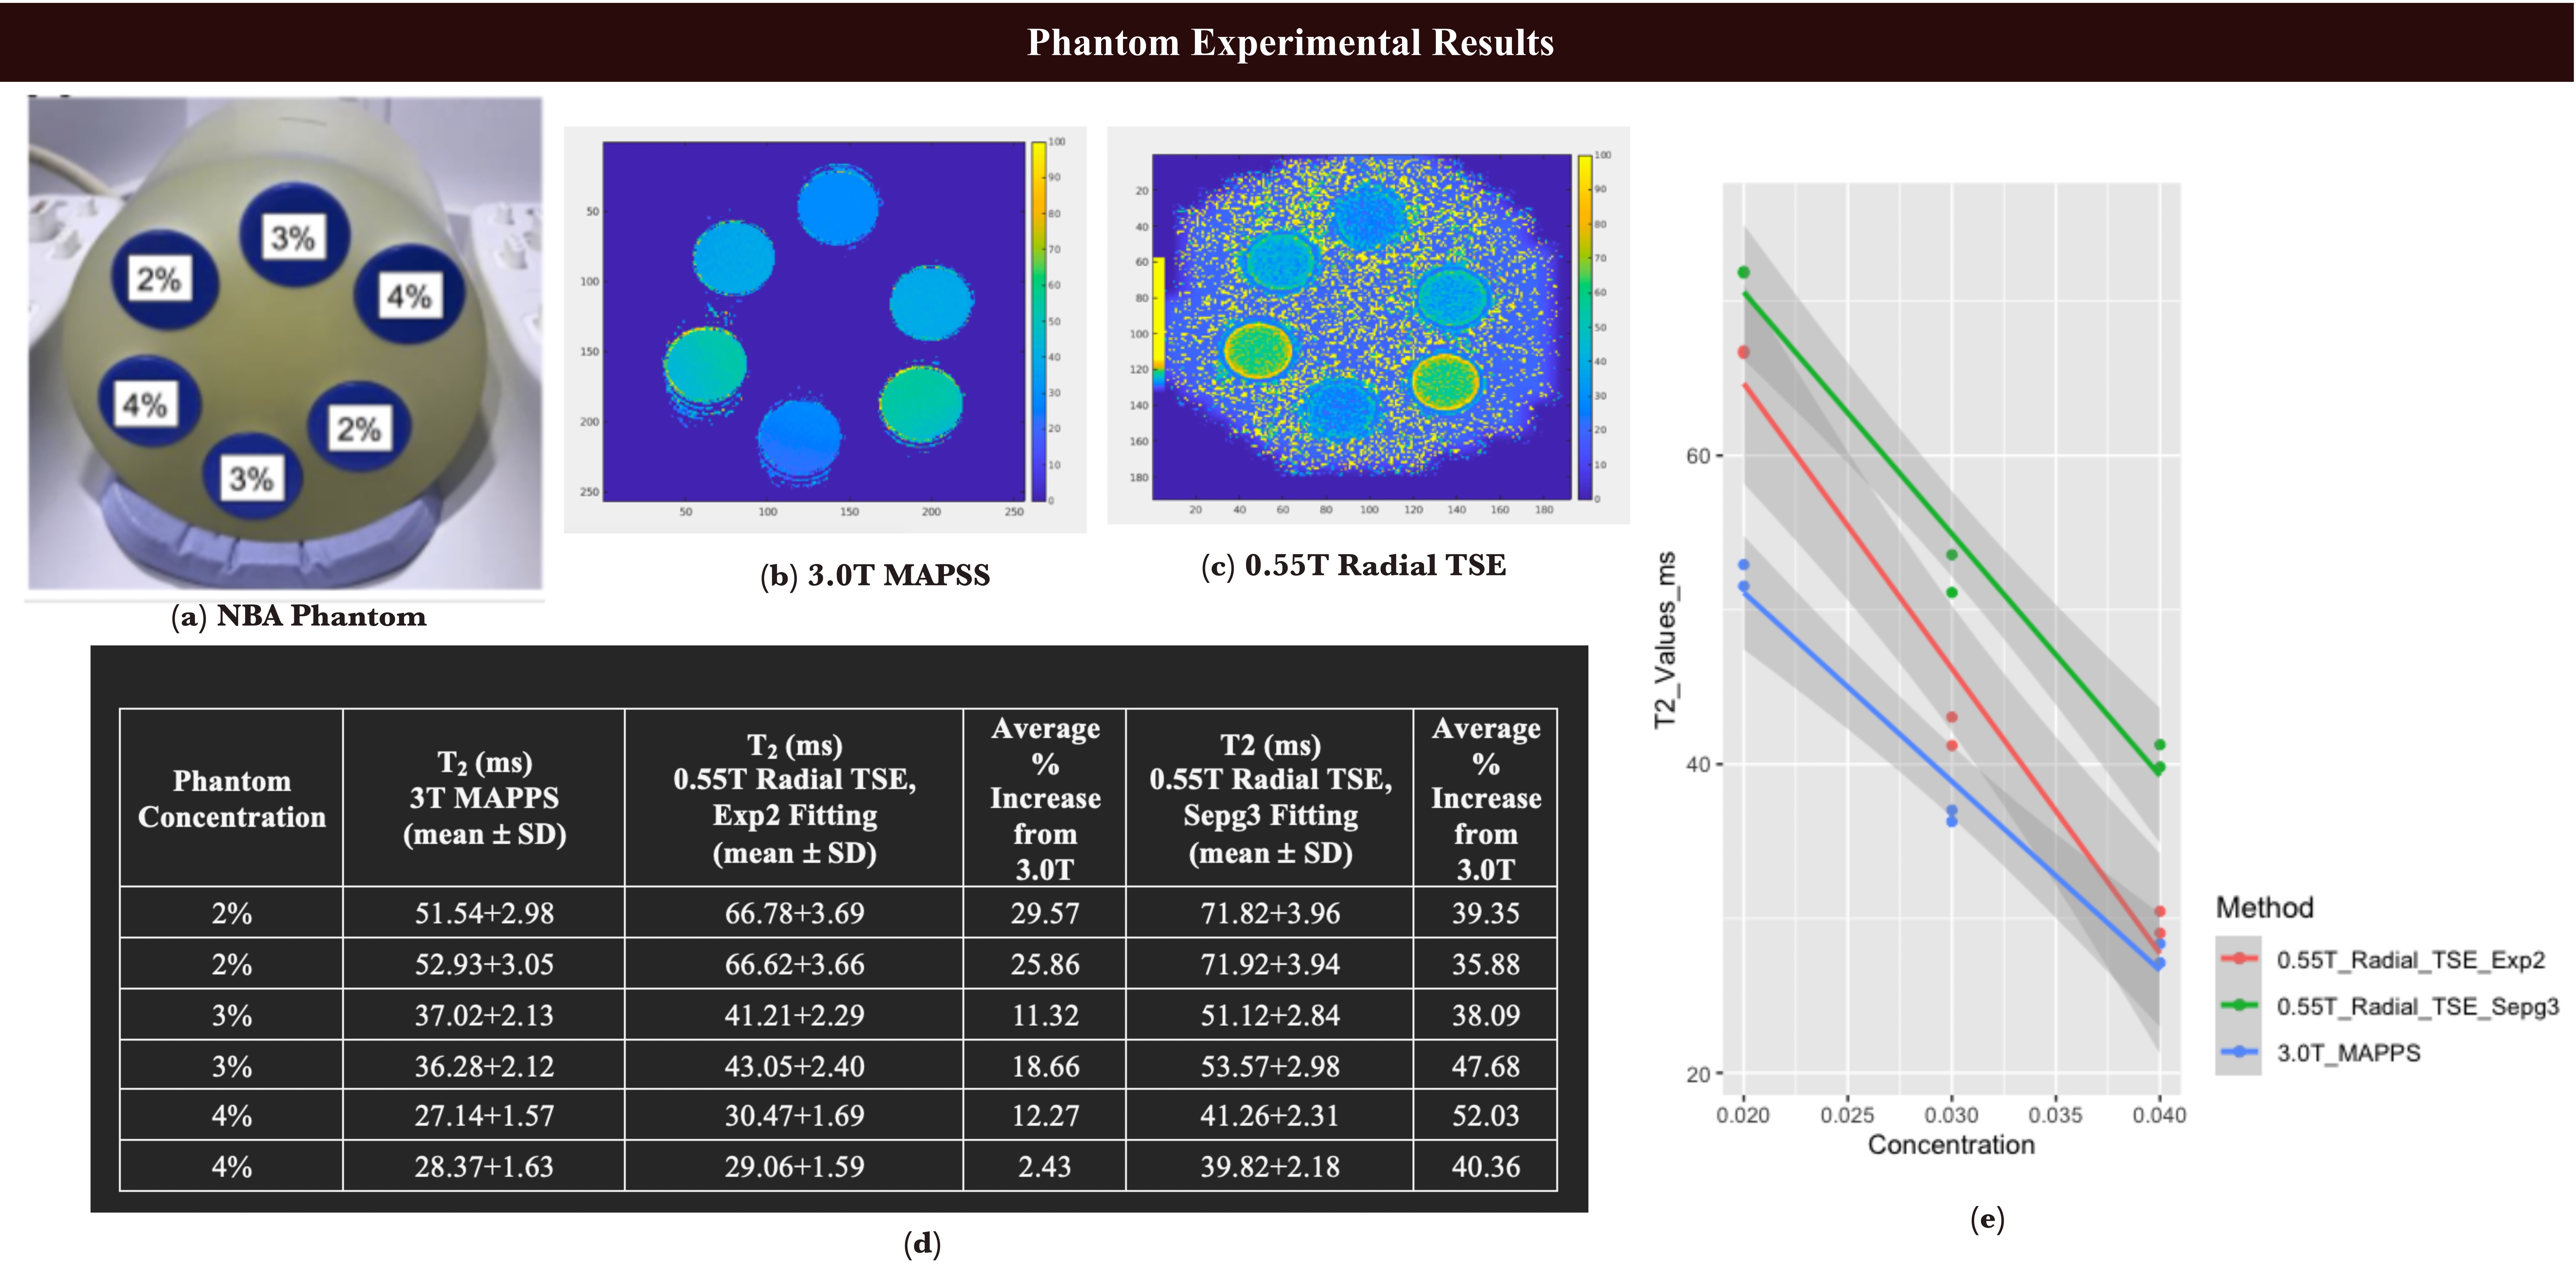
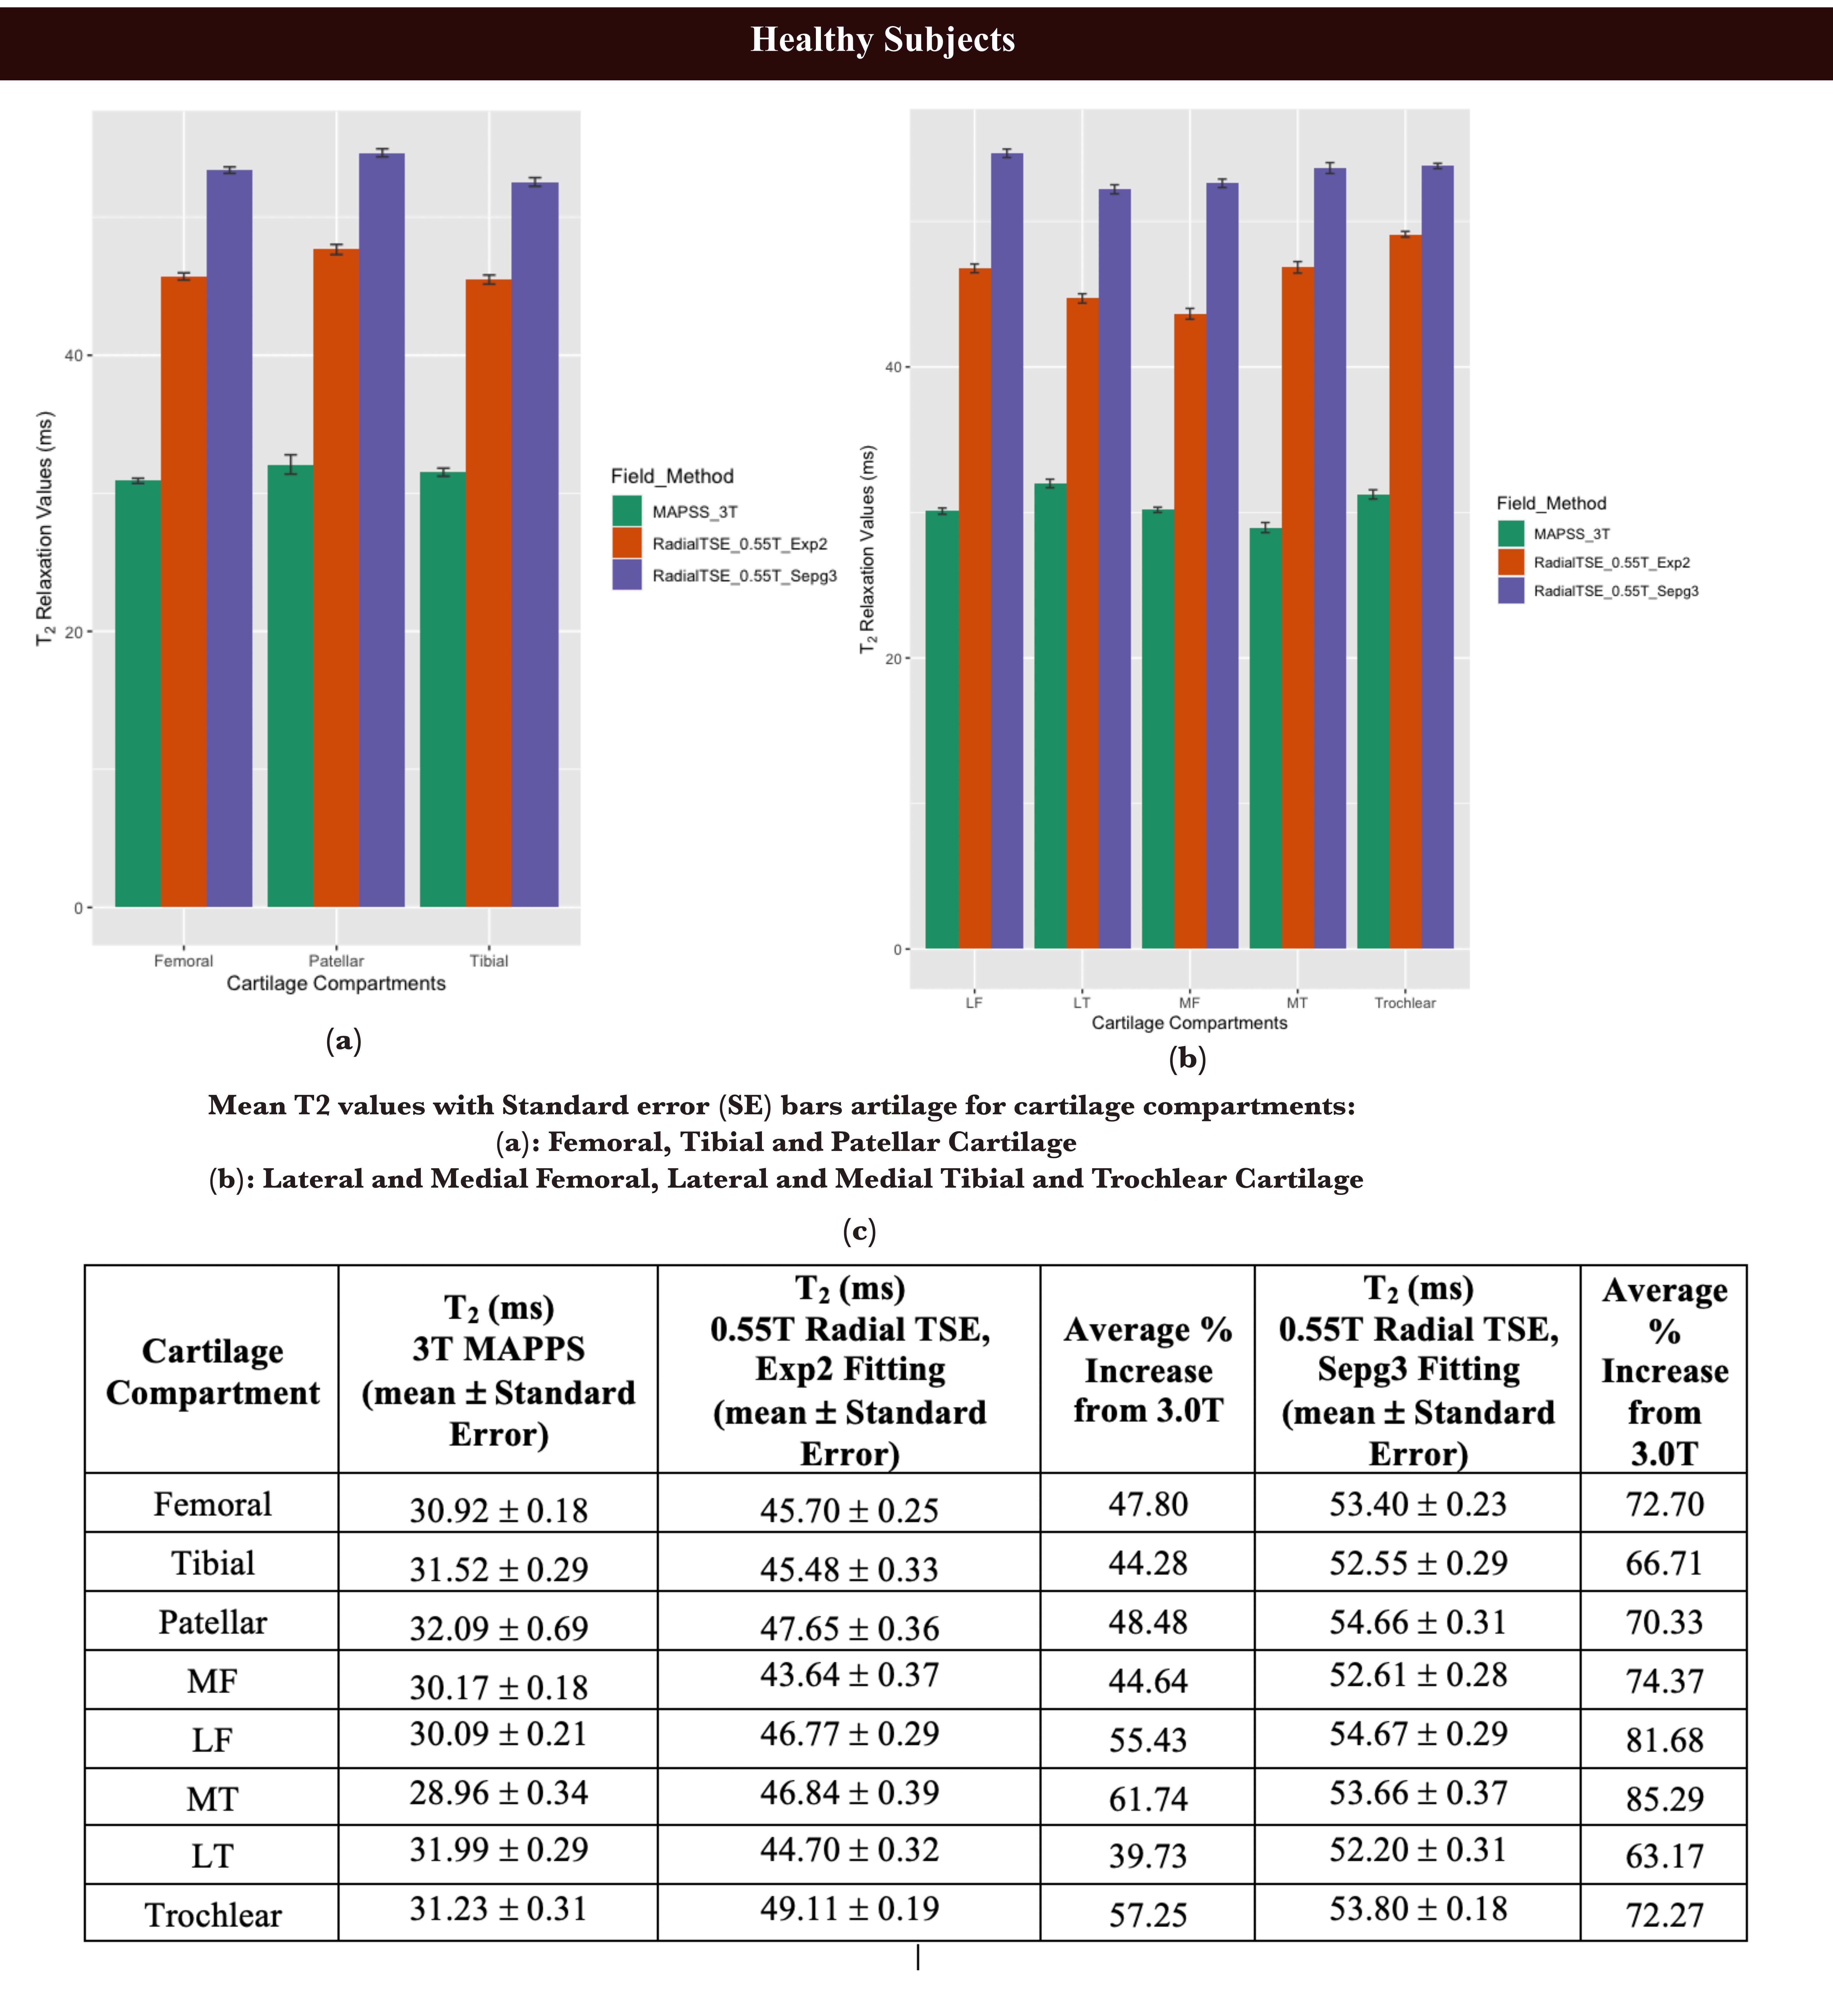
Figure-3: Healthy Subjects results (a): Bar plots of Mean T2 values with Standard Error (SE) for three major cartilages (Femoral, Tibial, Patellar) at 3.0T and 0.55T. (b) Bar plots of Mean T2 values with SE for five sub-compartments/cartilages (LF, MF, LT, MT, Trochlear) at 3.0T and 0.55T, (c) Mean, SE of T2 values at 3.0T and 0.55T (Exp2 and Sepg3) and Average percentage increases from 3.0T to 0.55T, for three major cartilage compartments and five sub-compartments.
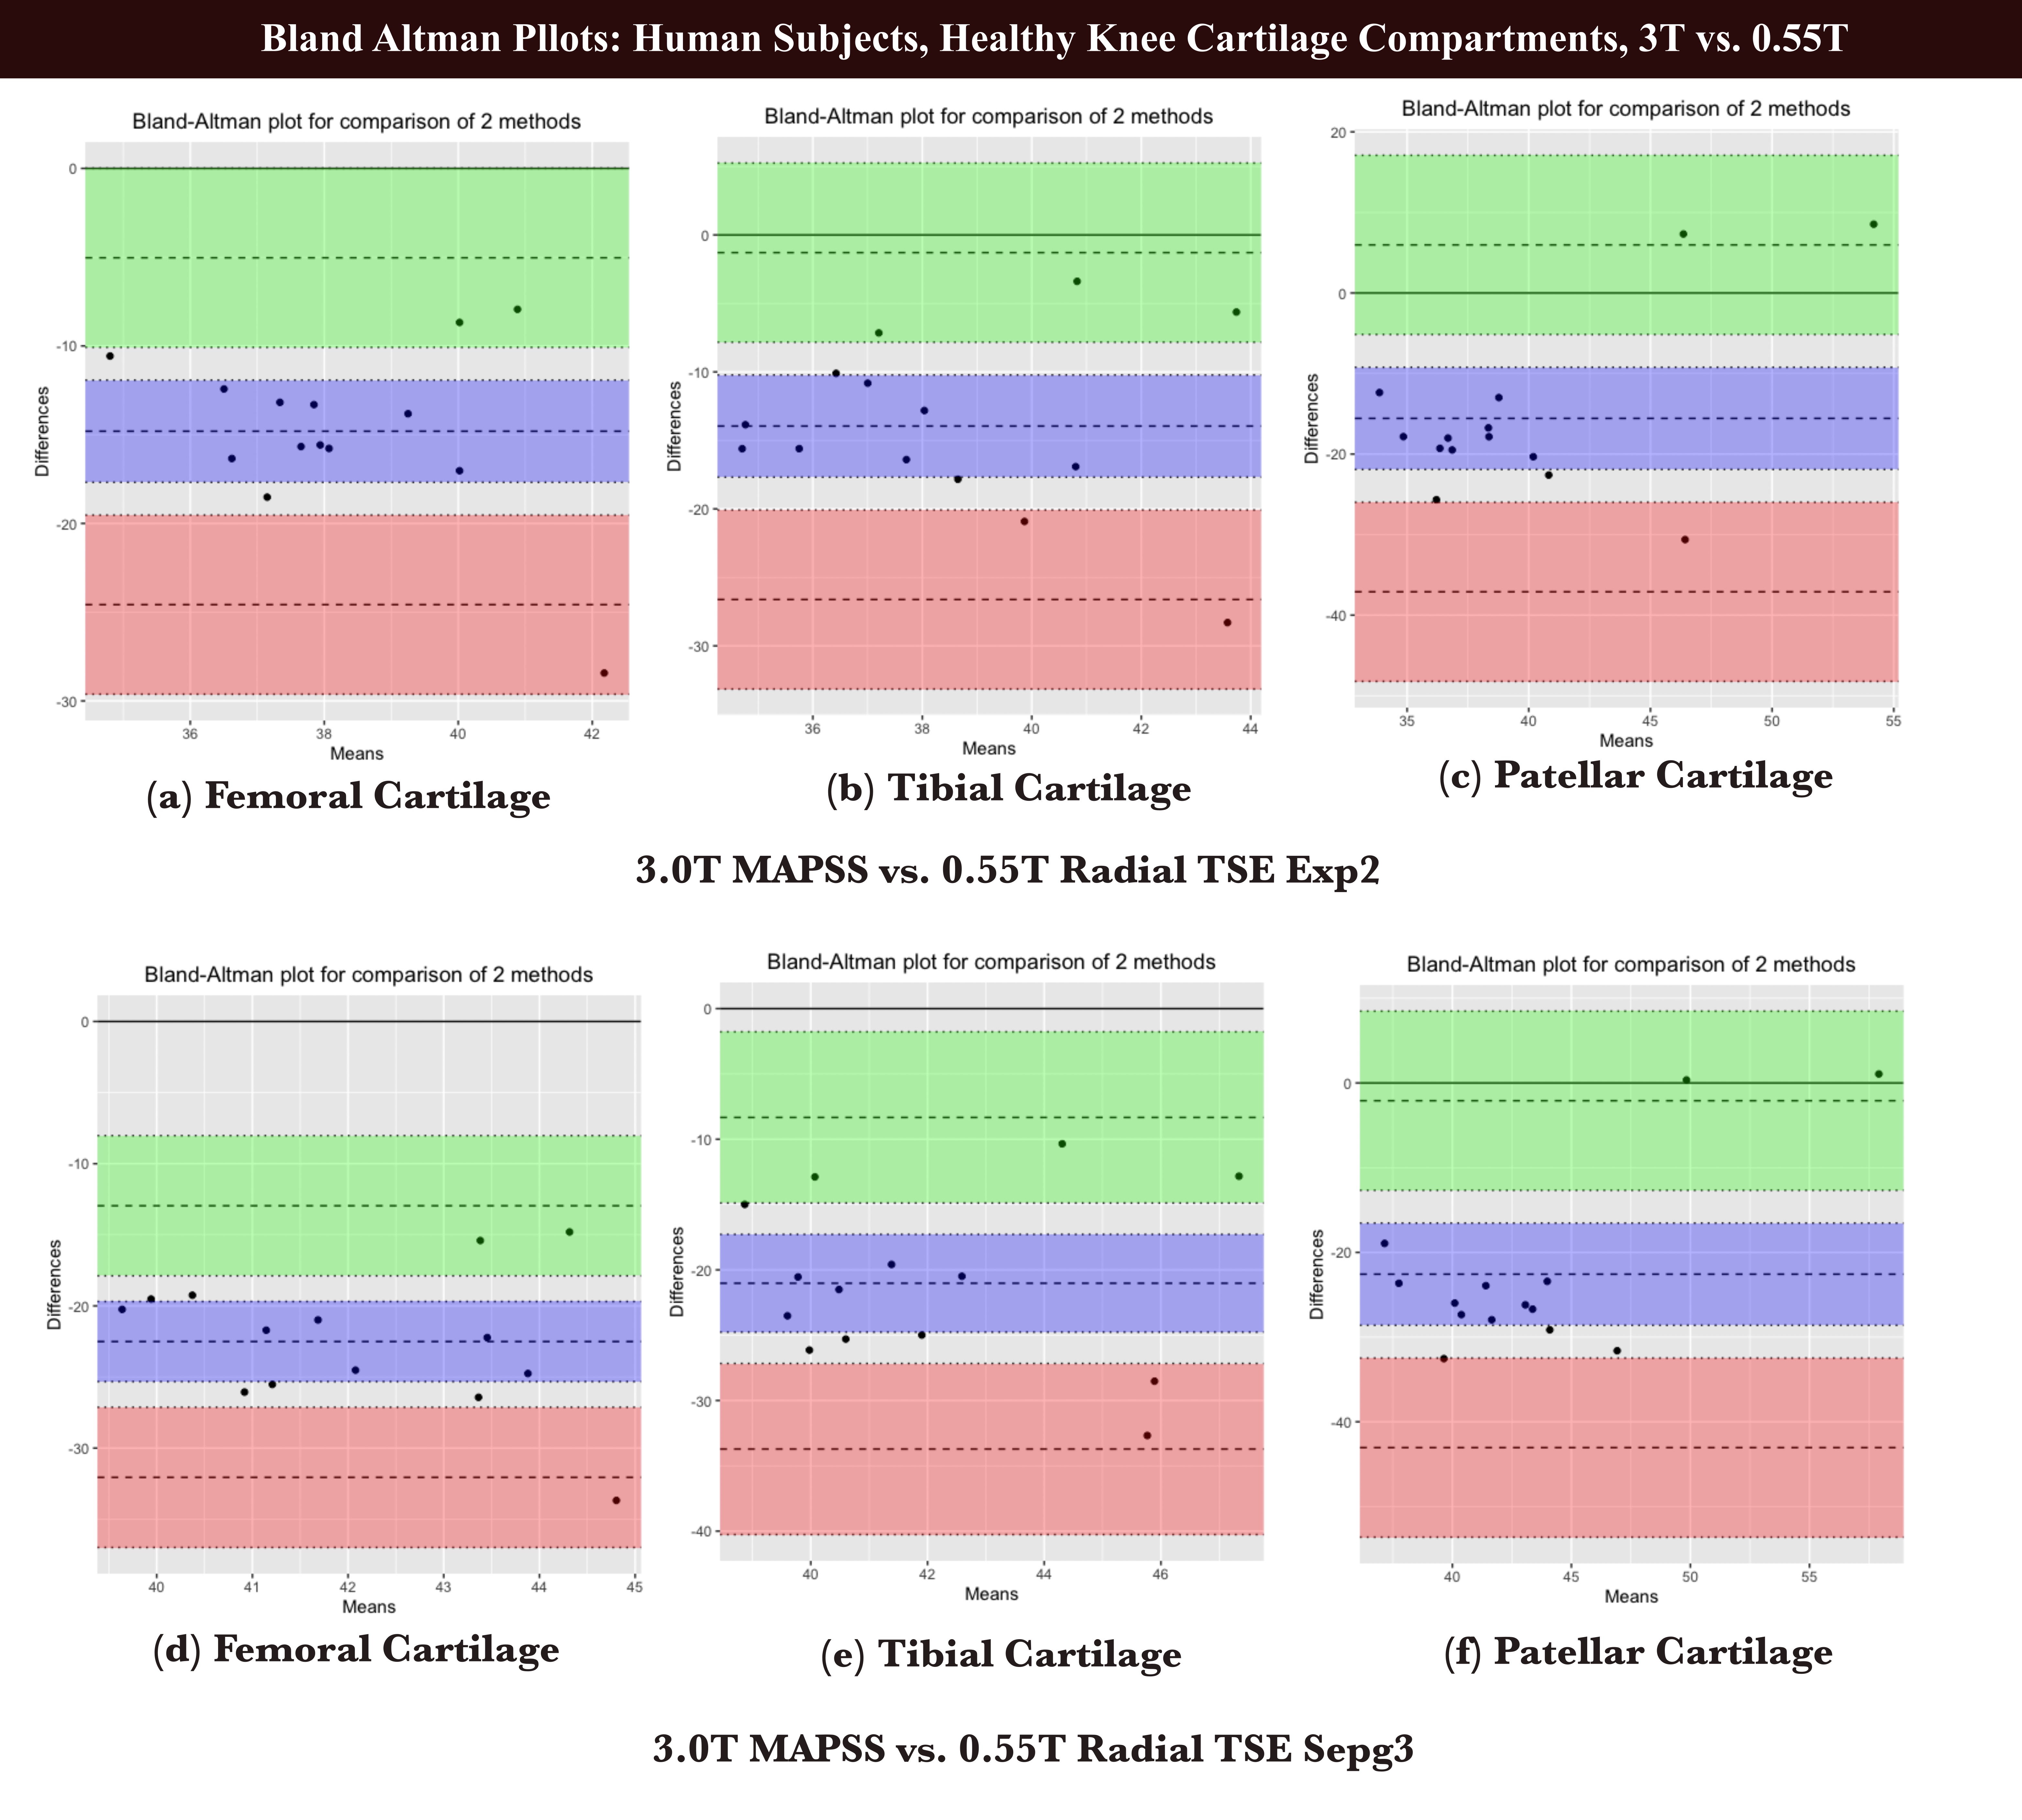
Figure-4: Healthy Subjects results, Bland-Altman Plots between 3.0T MAPSS vs. 0.55T Radial TSE Exp2 T2 values for (a) Femoral, (b) Tibial, and (c) Patellar cartilage. Bland-Altman Plots between 3.0T MAPSS vs. 0.55T Radial TSE Sepg3 T2 values for (d) Femoral, (e) Tibial, (f) Patellar cartilage.