2259
T2 MR Fingerprinting in global and focal knee cartilage1Department of Biomedical Imaging and Image-Guided Therapy, Medical University Vienna, Vienna, Austria, 2Centre for Advanced Imaging, University of Queensland, Queensland, Australia, 3Medical University Vienna, Vienna, Austria, 4CD Laboratory for MR Imaging Biomarkers (BIOMAK), Vienna, Austria, 5Austrian Cluster for Tissue Regeneration, Ludwig Boltzmann Institute for Experimental and Clinical Traumatology, Vienna, Austria, 6Institute for Clinical Molecular MRI in the Musculoskeletal System, Karl Landsteiner Society, Vienna, Austria
Synopsis
Keywords: Cartilage, Osteoarthritis, T2 mapping, MR Value, MSK, Relaxometry
Motivation: Simultaneous measurement of multiple parameters during single acquisition saves measurement and post-processing time with reduced motion artifacts.
Goal(s): To evaluate and compare T2 mapping of global and focal knee articular cartilage via MR fingerprinting and conventional CPMG sequences.
Approach: Volunteer and patient knees were scanned with protocol including MRF and CPMG T2 mapping. The two T2 mapping methods were compared in global cartilage, focal cartilage lesions and morphologically normal appearing cartilage segments.
Results: The average bias between the two methods was 17.09 ± 6.3 ms, and correlation was moderate to very high in global cartilage and high in focal cartilage.
Impact: T2 mapping with MR fingerprinting is reliable in global and focal articular knee cartilage in terms of segment bulk T2 value assessment when compared to conventional method. Future study will concentrate on longitudinal change in T2 during patient follow-up.
Introduction
Quantitative MRI has been shown to be sensitive to early changes of osteoarthritis[1]. T2 mapping has been shown to be one of the promising MR biomarkers[2]. MR fingerprinting is a new technique acquiring images of multiple parameters during a single acquisition, resulting in decreased scan and post-processing time[3]. The goal of this study is to evaluate the feasibility of a prototype MRF sequence in global as well as focal knee articular cartilage.Methods
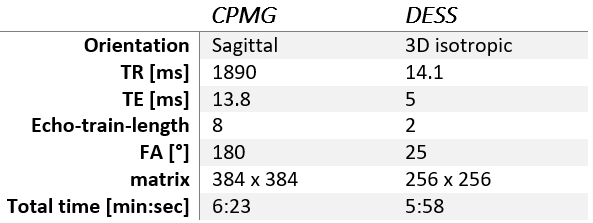
All measurements were performed on two 3T MAGNETOM MR scanners (Siemens Healthineers AG, Forchheim, Germany), PrismaFit for volunteers and Prisma for patients. T2 mapping was performed using prototype MRF sequence based on [4] and conventional CPMG sequence. For automatic segmentation of the cartilage, double-echo steady-state sequence (DESS) was acquired, and for the identification of the focal lesions turbo-spin-echo proton density sequences were acquired (Table 1).Automatic segmentation of the whole cartilage was performed on the DESS images in the MR ChondralHealth v3.1 research application software (Siemens Healthineers AG, Forchheim, Germany, segmentation algorithm based on the work from [5,6], dividing the cartilage into 21 segments (6 patellar, 6 tibial and 9 femoral). T2 extraction was also performed automatically with an in-house script (in Jupyter extension of 3D Slicer). The script loaded both T2 maps (MRF and CPMG), DESS images and segmentation. The T2 maps were then co-registered and resampled to DESS images. Extreme values (<5ms and >150ms) were masked out from the segmentation and mean T2 values of each segment were extracted.
Subsequently, TSE PD images were reviewed by a radiologist with 30 years of experience in knee cartilage MRI to identify lesions in the cartilage. Only femoral lesions on medial or lateral condyle were selected for analysis. Lesion segments were manually drawn on the T2 maps with the guidance of PD TSE images on original CPMG and MRF T2 maps. On the other condyle of the same knee, normal appearing cartilage segment on conventional morphological MRI was also delineated on the T2 maps.
The T2 values acquired by the two methods were compared by correlation and Bland-Altman analysis. The correlation between the two methods was calculated for each patient in the global cartilage between T2 values from all 21 regions. Bland-Altman analysis for average bias quantification was performed on mean T2 value of the whole cartilage. The correlation between MRF and CPMG T2 values was also calculated in lesions and morphologically normal appearing cartilage segments.
Results
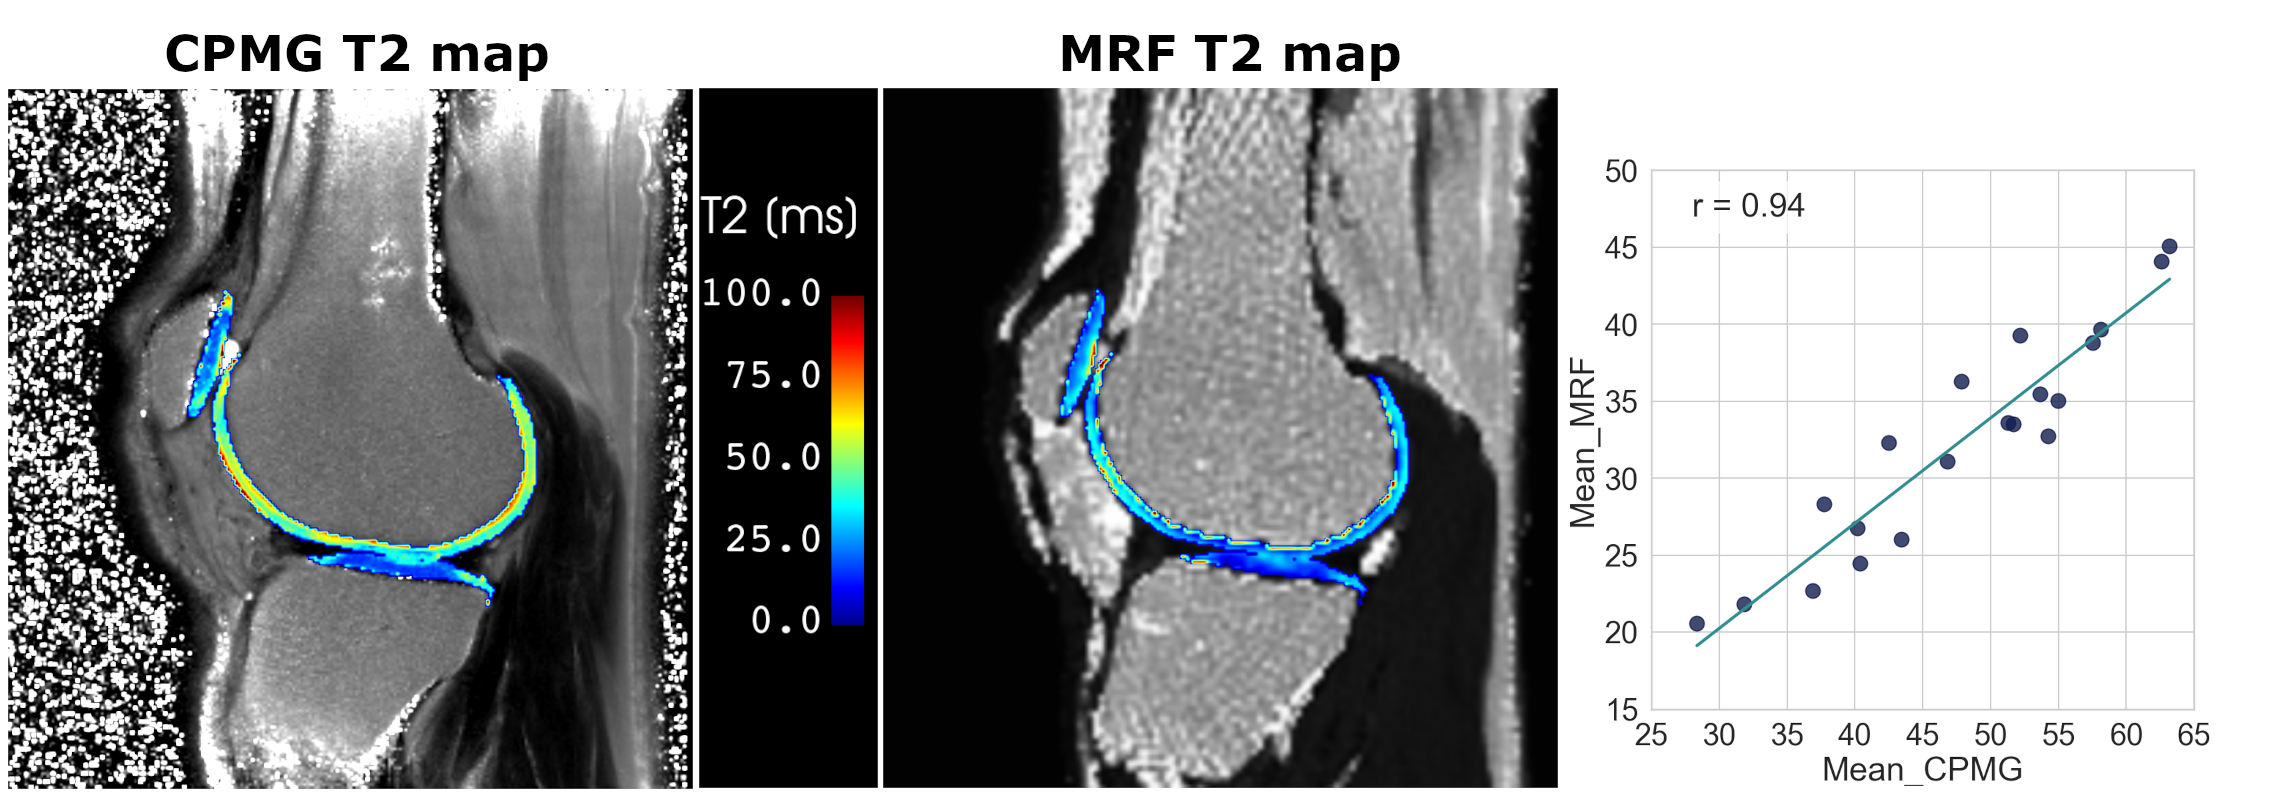
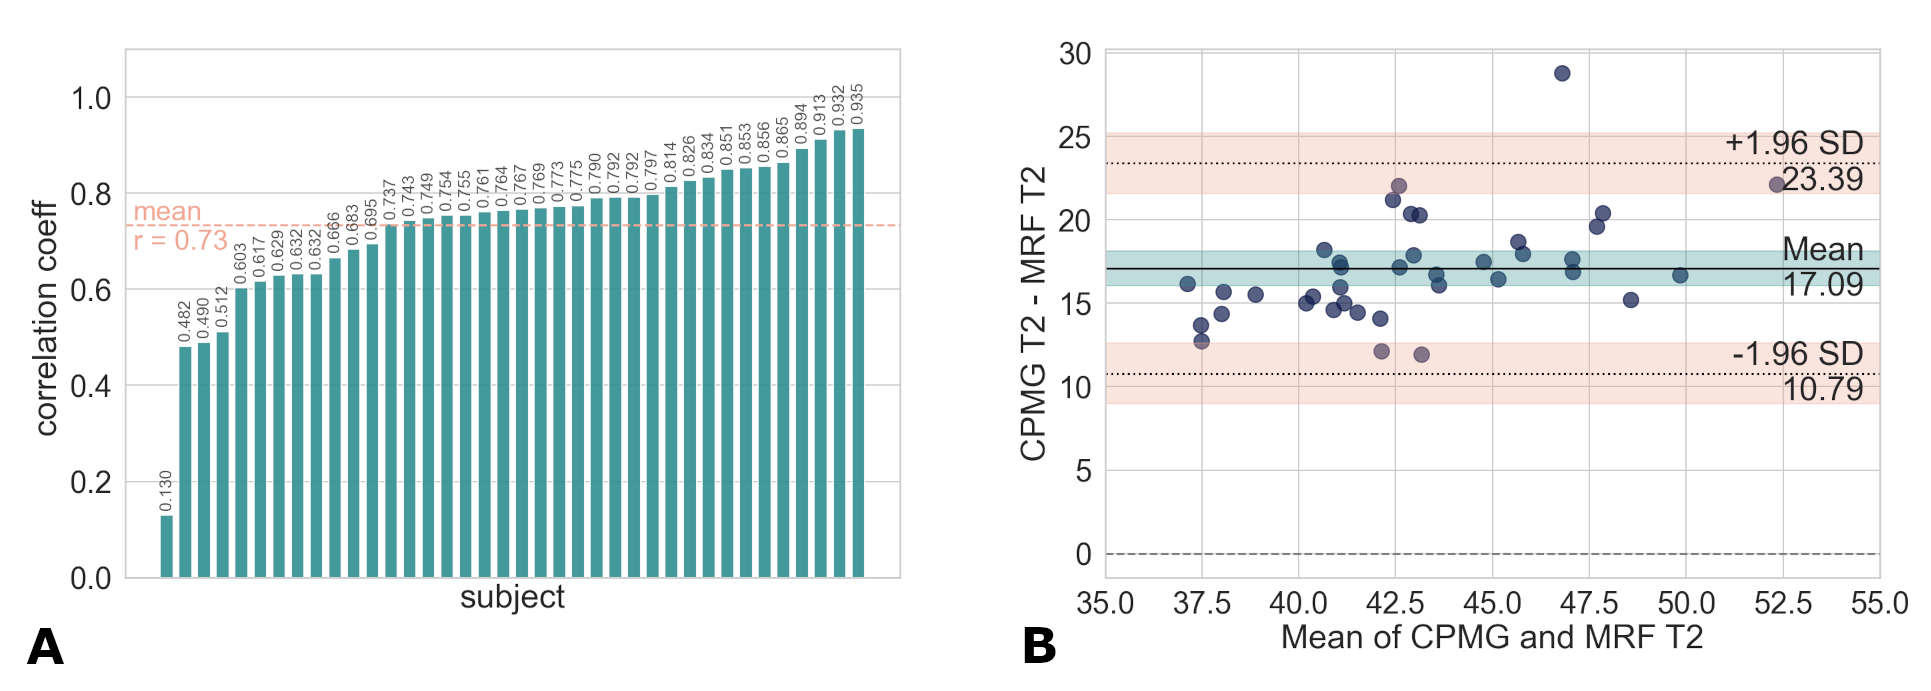
In total, 11 volunteers (5 men, 6 women, mean age = 35.8 ± 15.6 years) and 25 patients (20 men, 7 women, mean age = 33 ± 11.5 years) were scanned. Both knees were scanned in two of the patients, therefore 27 patient knees were scanned. Representative CPMG and MRF T2 maps of the global cartilage, together with the correlation plot of 21 segments are depicted in Figure 1. Except for one subject, the correlation coefficients were moderate to very high, with mean correlation coefficient of 0.73. The average bias between the two methods was 17.09 ± 6.3 ms (Figure 2).There were 17 patellar, 6 trochlear, 22 femoral lesions identified. From femoral lesions 10 were medial and 12 were lateral. Four patients had femoral lesion in both condyles, therefore were excluded from analysis, yielding 14 lesions with healthy cartilage on other condyle for analysis.
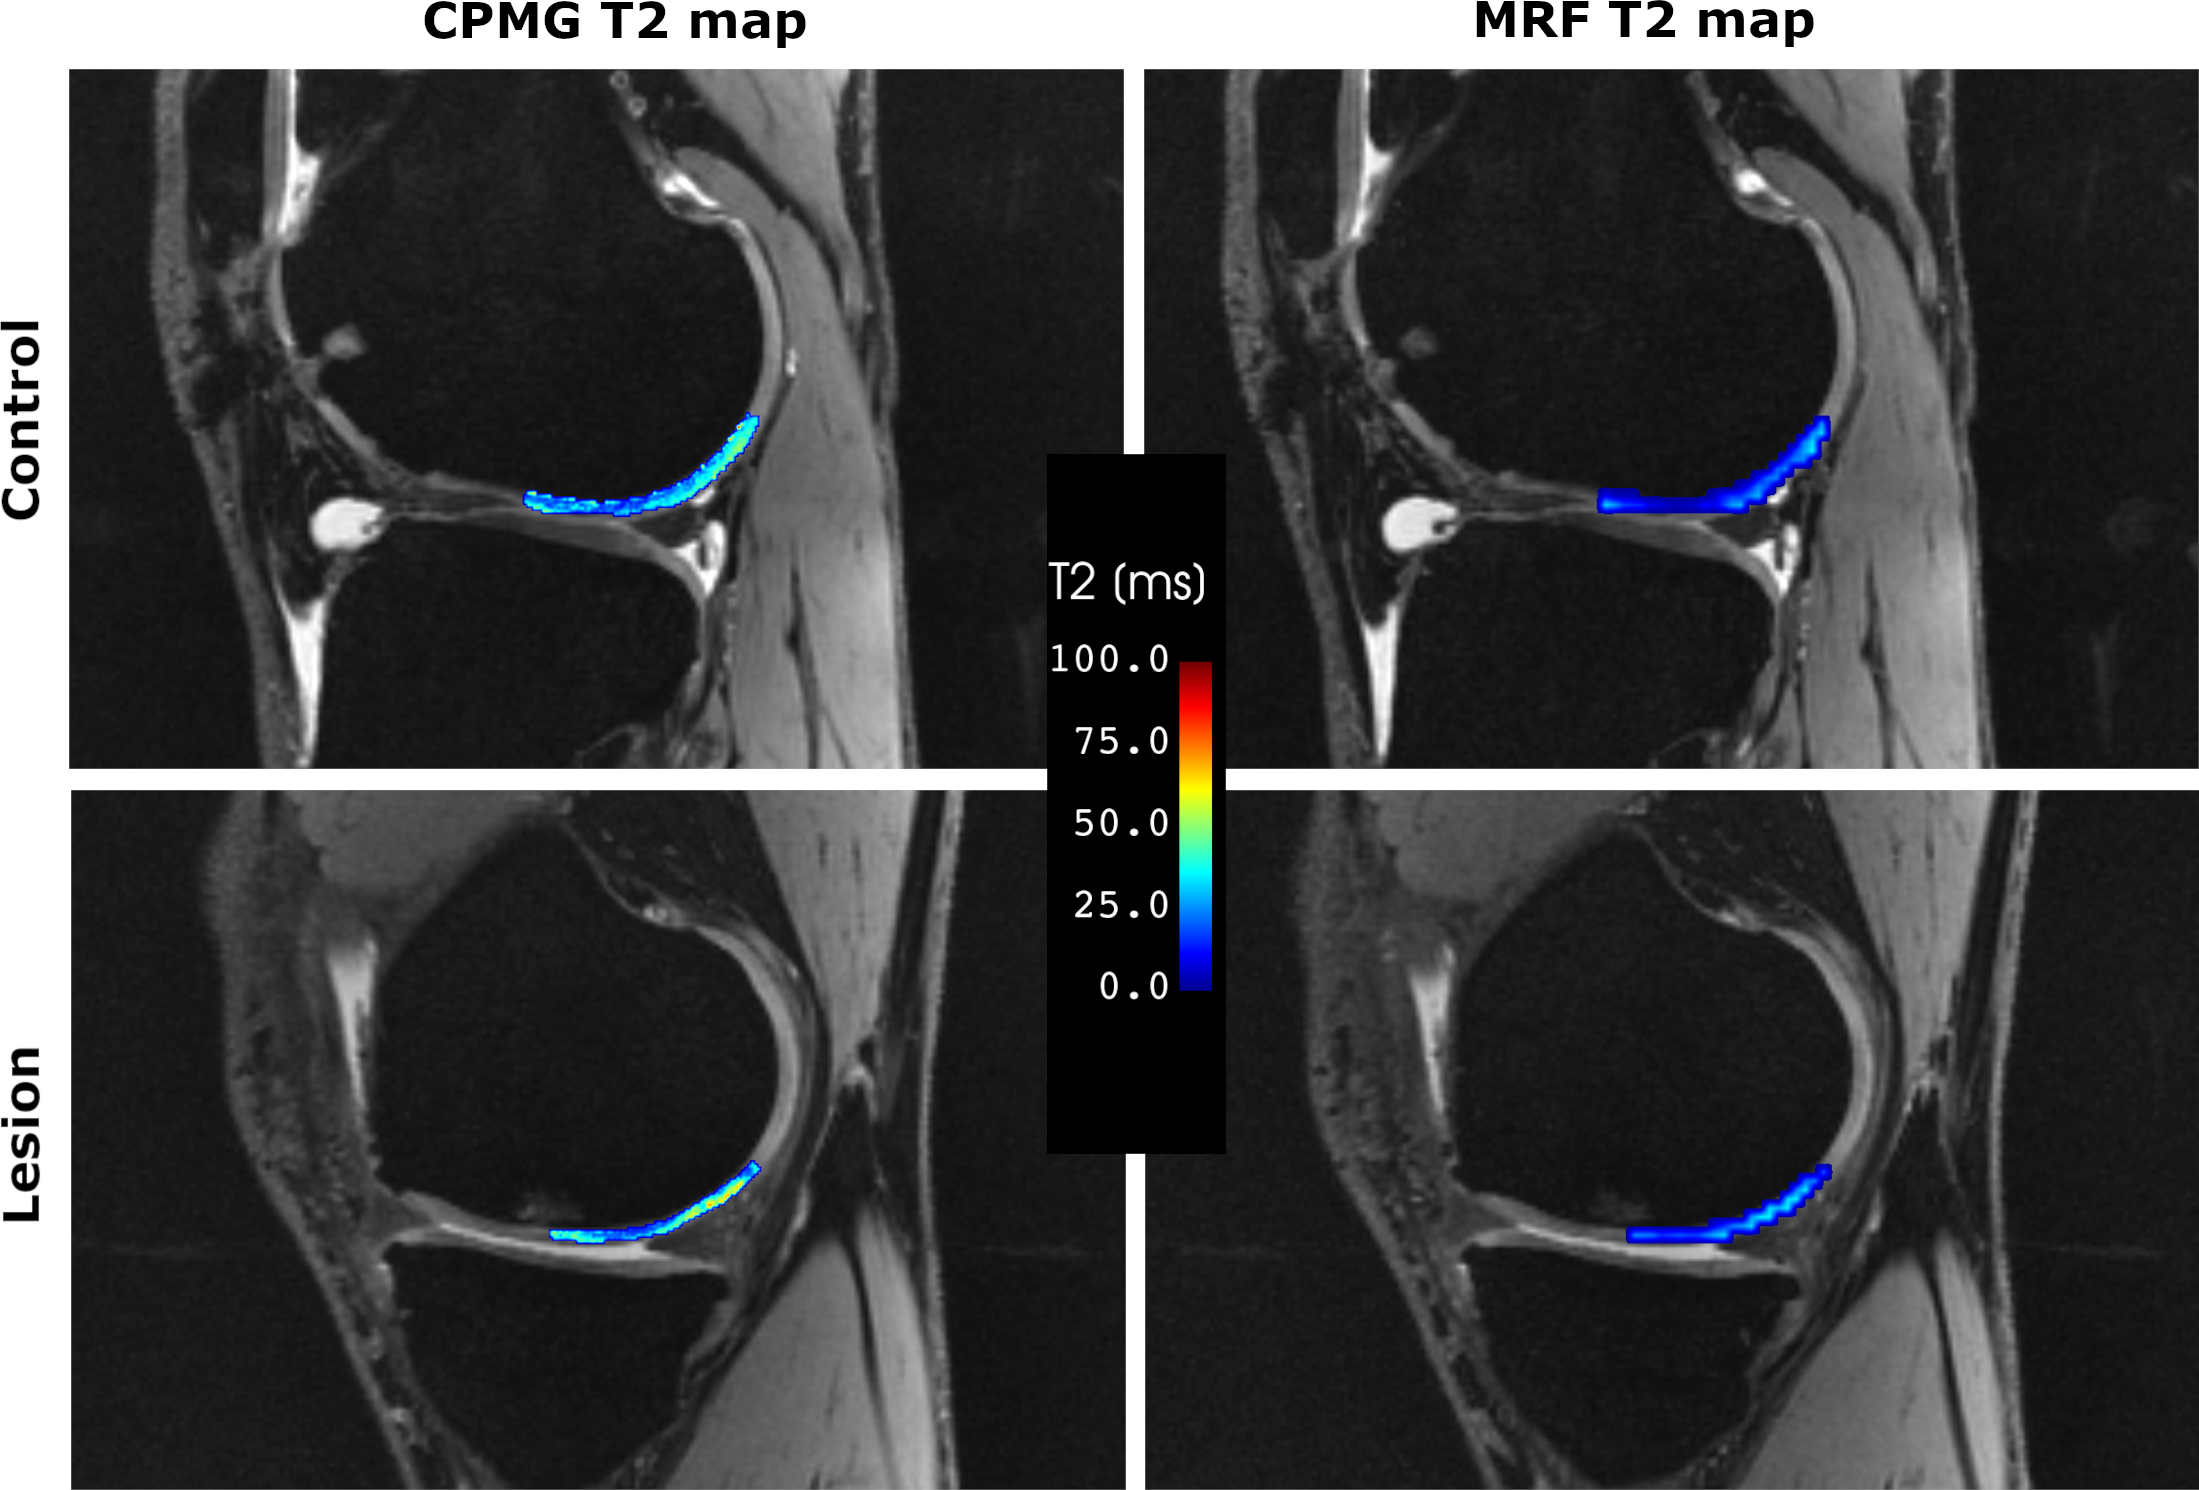
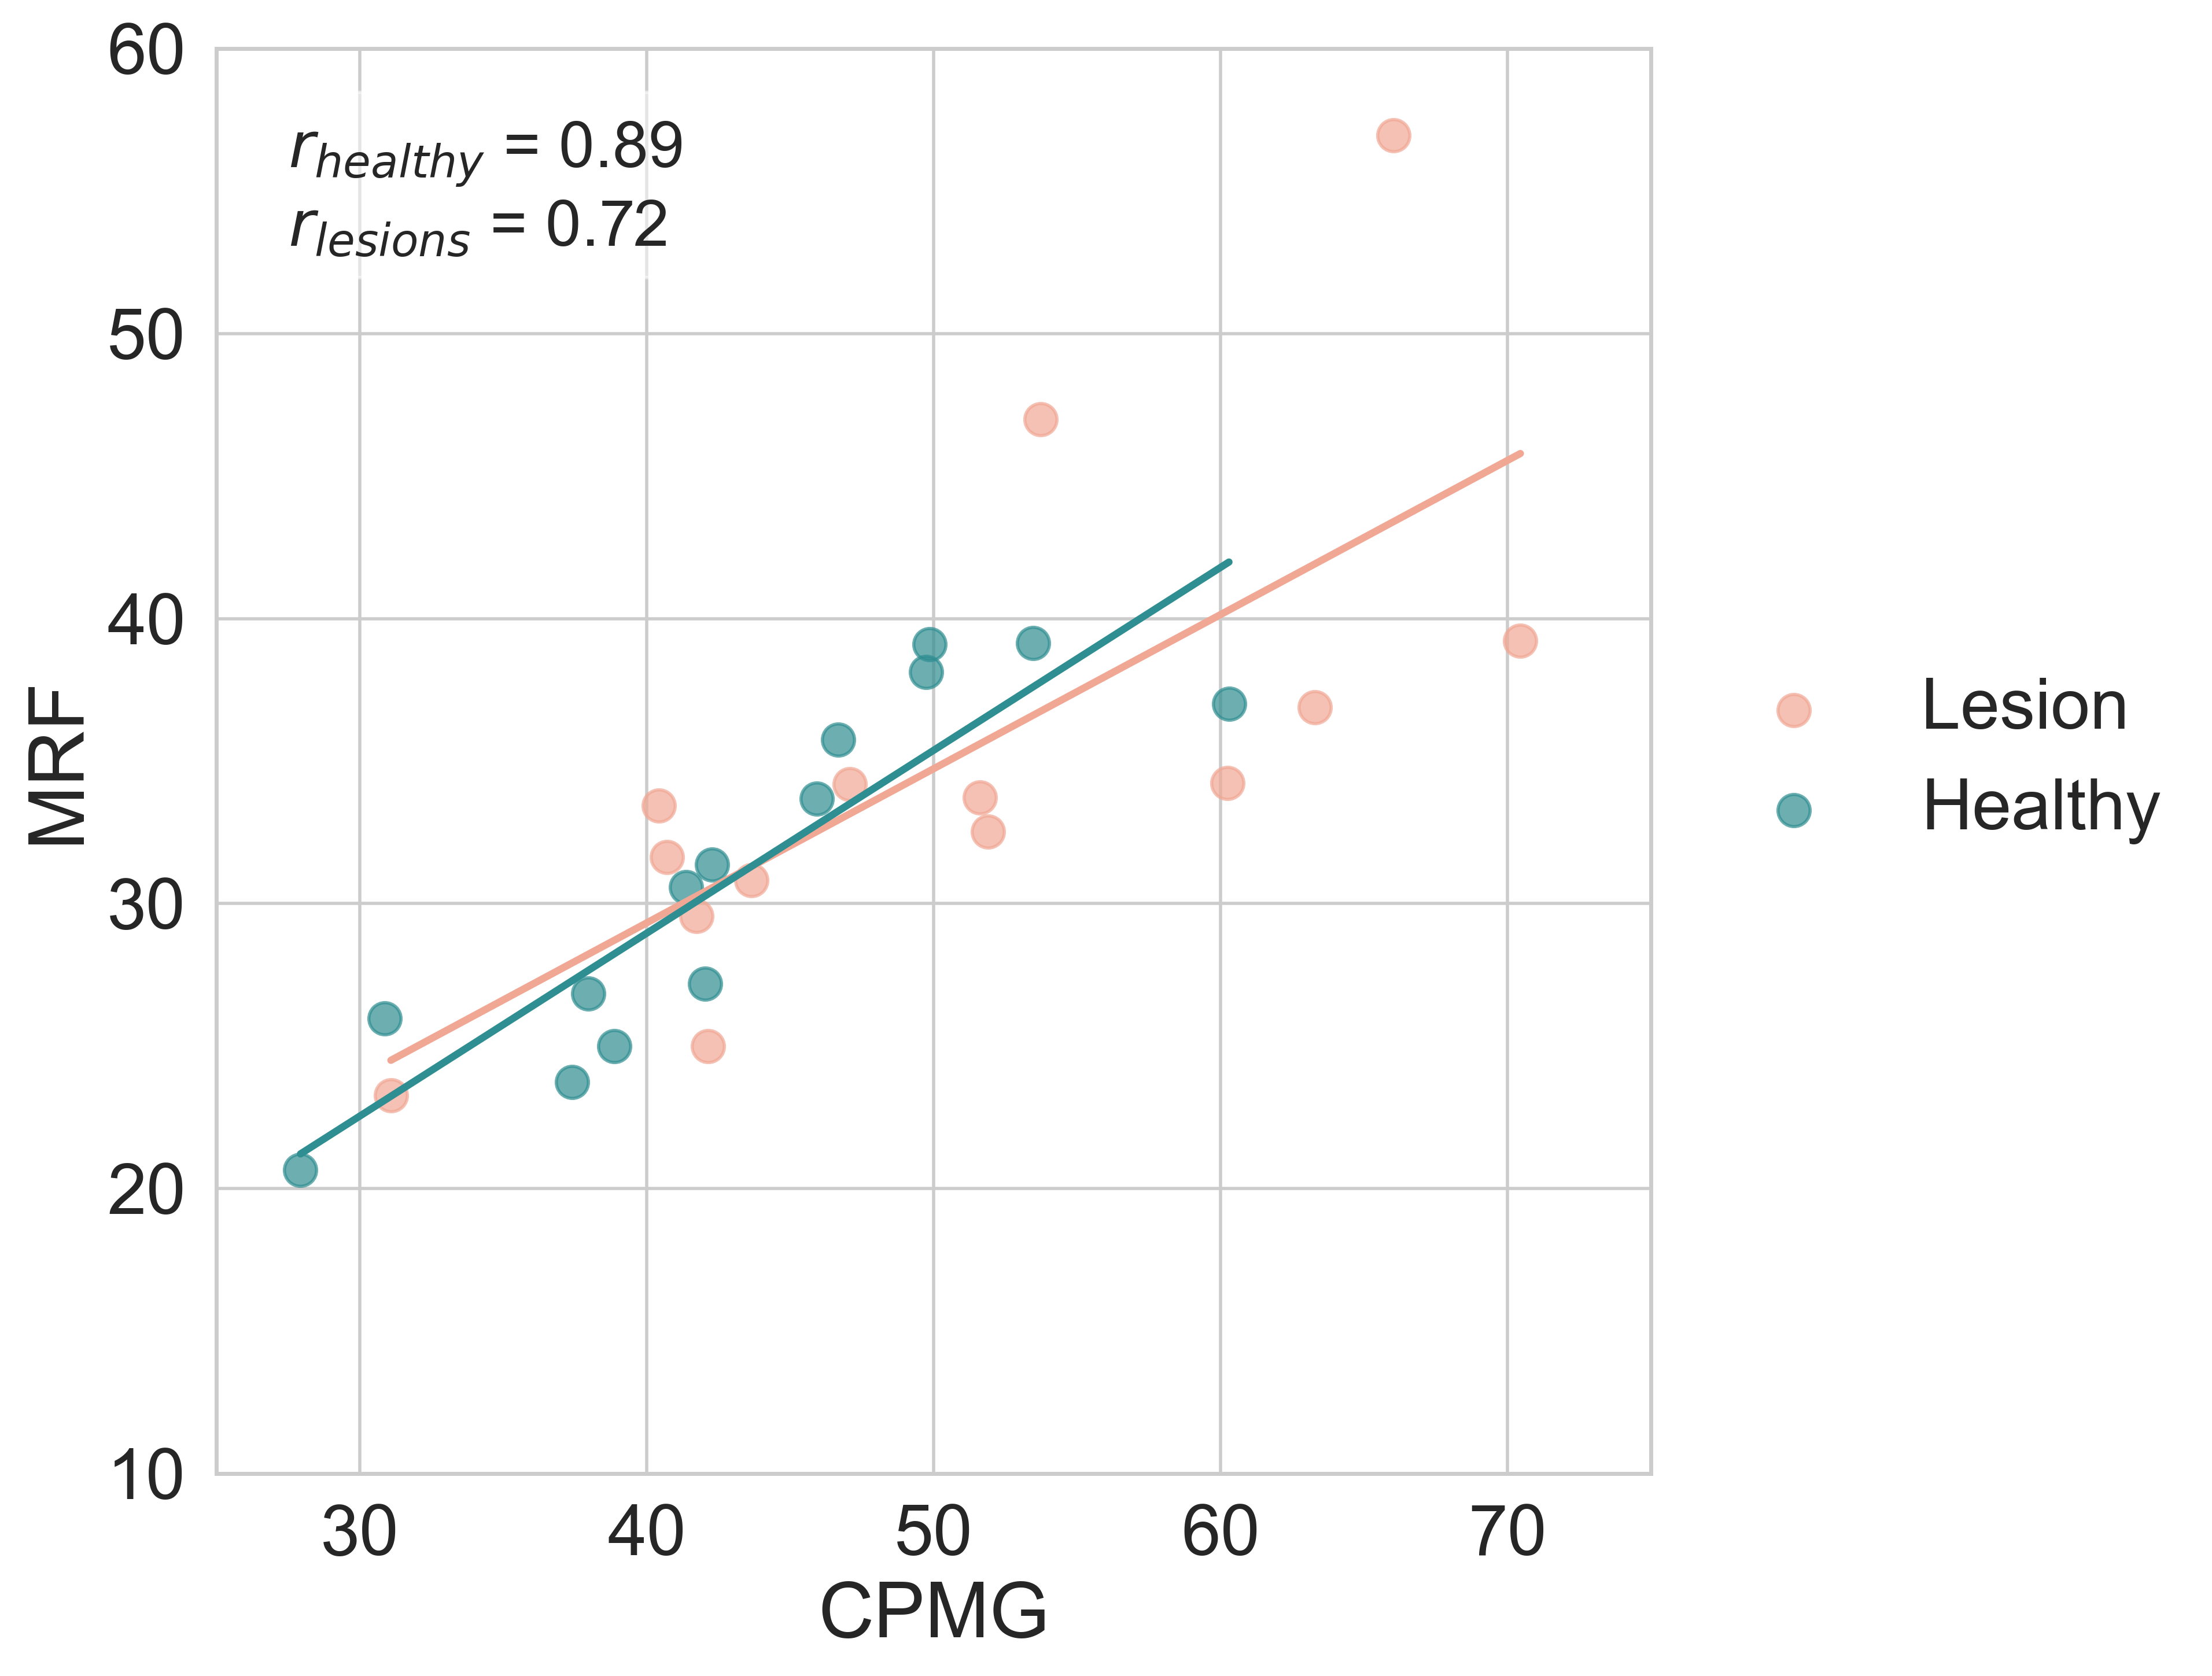
Representative T2 maps of the lesion and healthy cartilage are depicted in Figure 3. The correlation from lesions and healthy segments is depicted in Fig 4. The correlation was r = 0.89 and r = 0.72 in healthy cartilage and lesions, respectively.
Discussion
We have shown that T2 mapping with MR fingerprinting is feasible in knee articular cartilage in global cartilage as well as in focal cartilage lesions. There was one outlier in global cartilage analysis showing weak correlation coefficient. Possible cause is the challenging co-registration process of differently resolved images in combination with the complex anatomy of the cartilage. The mean difference between the two methods is in line with our previous study in the phantom measurements [7]. The limitation of the MRF sequence is low in-plane resolution relative to cartilage thickness. The zonal T2 pattern in articular cartilage cannot be captured, however our results show that the bulk T2 value of the segments is precise. Further steps of this study will focus on longitudinal follow up of the patients after one year and analysis of change in T2 in case of disease treatment or progression.Conclusion
T2 mapping with MR fingerprinting is reliable in global and focal articular knee cartilage.Acknowledgements
No acknowledgement found.References
[1] Li, X., et al., In vivo T(1rho) and T(2) mapping of articular cartilage in osteoarthritis of the knee using 3 T MRI. Osteoarthritis Cartilage, 2007. 15(7): p. 789-97.
[2] Baum, T., et al., Cartilage and meniscal T2 relaxation time as non-invasive biomarker for knee osteoarthritis and cartilage repair procedures. Osteoarthritis Cartilage, 2013. 21(10): p. 1474-84.
[3] Sharafi, A., et al., MR fingerprinting for rapid simultaneous T(1) , T(2) , and T(1)(rho) relaxation mapping of the human articular cartilage at 3T. Magn Reson Med, 2020. 84(5): p. 2636-2644.
[4] Cloos, M.A., et al., Rapid Radial T(1) and T(2) Mapping of the Hip Articular Cartilage With Magnetic Resonance Fingerprinting. J Magn Reson Imaging, 2019. 50(3): p. 810-815.
[5] Fripp, J., et al., Automatic segmentation and quantitative analysis of the articular cartilages from magnetic resonance images of the knee. IEEE Trans Med Imaging, 2010. 29(1): p. 55-64.
[6] Chandra, S.S., et al., Focused shape models for hip joint segmentation in 3D magnetic resonance images. Med Image Anal, 2014. 18(3): p. 567-78.
[7] Bencikova, D., et al., (2023) MR Fingerprinting In The Knee Cartilage Compared To Conventional Methods in Combination with Automated Cartilage Segmentation. Mirasmart [Online video]. Available from: https://submissions.mirasmart.com/ISMRM2023/ViewSubmissionFile.aspx?mode=video&validate=false&sbmID=3900 [3rd November 2023]
Figures