2258
T2* Cartilage Mapping in Early Axial Spondyloarthritis: Diagnostic Accuracy and Correlation with Clinical Characteristics and Sacroiliitis1Department of Radiology, the First Affiliated Hospital of Fujian Medical University, Fuzhou, China, 2Department of Radiology, National Regional Medical Center, Binhai Campus of the First Affiliated Hospital, Fujian Medical University, Fuzhou, China, 3Philips Healthcare, Shanghai, China, 4Department of Radiology, Fujian Key Laboratory of Precision Medicine for Cancer, the First Affiliated Hospital, Fujian Medical University, Fuzhou, China
Synopsis
Keywords: Osteoarthritis, Bone
Motivation: Cartilage degradation has been recognized as an early and crucial feature in axSpA.
Goal(s): The objectives of the present study were (1) to determine the performance of T2* cartilage mapping in diagnosing and assessing disease activity in early axSpA, (2) to investigate the interaction of cartilage damage with clinical characteristics and sacroiliitis.
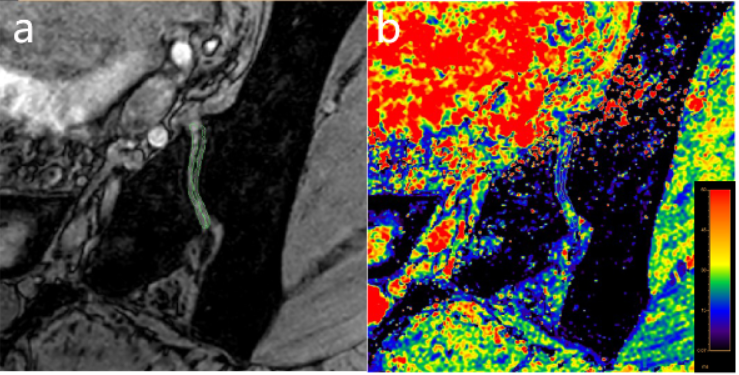
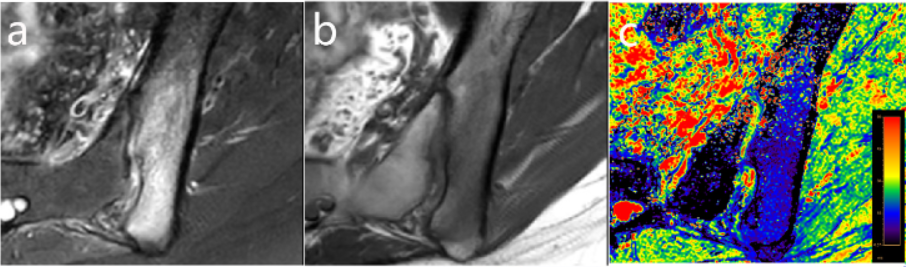
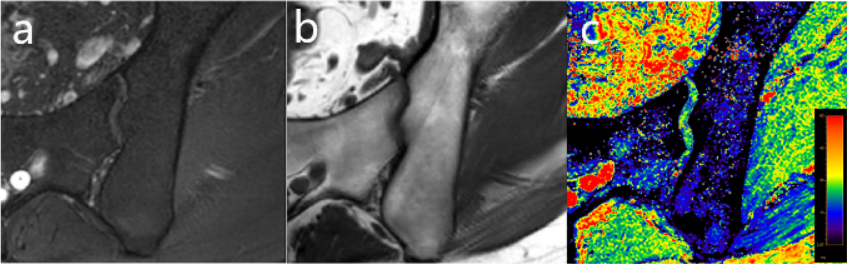
Approach: Sacroiliac joints cartilage T2* values were higher in patients with early axSpA compared to controls without axSpA.
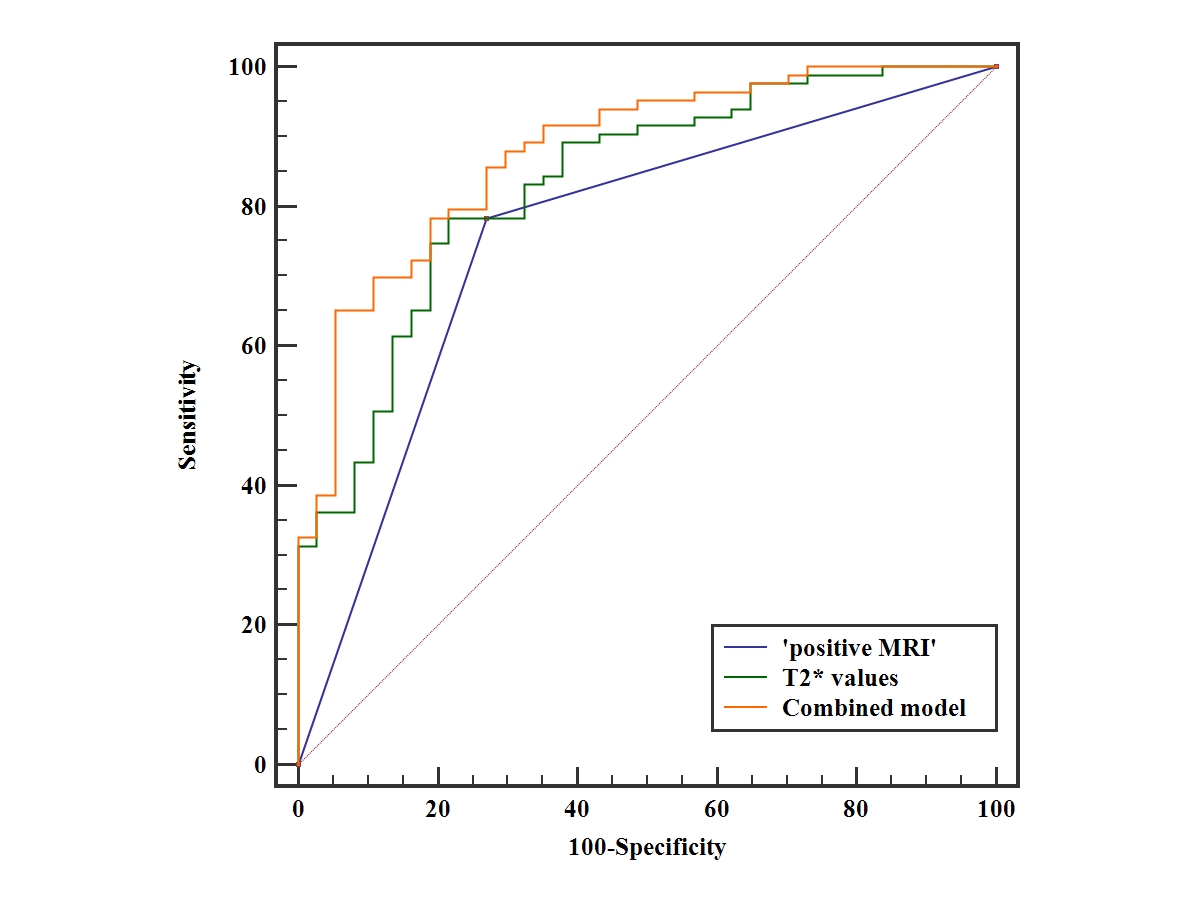
Results: The combination of T2* values and ‘positive MRI’ improve diagnostic efficiency of axSpA. Sacroiliac joints cartilage damage correlates with age, disease activity, acute sacroiliitis, and structural damage.
Impact: T2* relaxation time may be a promising imaging biomarker for diagnosing and differentiating disease activity in early axSpA. T2* mapping could be a recommended addition to routine MRI protocol of SIJs.
Introduction
Cartilage degradation has been recognized as an early and crucial feature in axial spondyloarthritis (axSpA) [1]. Conventional sequence is insensitive to identify biochemical changes in early stage of cartilage damage. Several quantitative MRI techniques have been applied to detect cartilage changes before irrevocable defects in large joints [2,3]. A few studies have revealed that patients with axSpA exhibit cartilage damage in the sacroiliac joints (SIJs) with increased T2 values[4-7]. There is a substantial challenge in applying SIJs owing to the irregular cartilage with a width of 1-2 mm. The short scan time, high signal-to-noise ratio, and three-dimensional acquisition of T2* mapping should be significant advantages in SIJs cartilage imaging[2]. The value of diagnosing and assessing disease activity using T2* mapping in axSpA has not been evaluated. Furthermore, it is important to have a better understanding of the interrelation between cartilage damage, clinical characteristics, and bone lesions.Methods
From January 2021 to April 2023, 137 consecutive patients who met the following inclusion criteria were enrolled: (1) short-term chronic back pain (≥ 3 months, ≤ 2 years and onset﹤ 45 years)[8] ; (2) underwent conventional MRI and T2* mapping of SIJs. 17 patients were excluded for the following reasons: age less than 16 years, poor MR image quality, ankylosis of SIJ, history of rheumatism. This prospective study included 83 axSpA patients and 37 no-axSpA patients. MRI examinations were performed on a 3.0-T MRI scanner (Ingenia, Philips Healthcare) equipped with a 32 channels dStream Torso coil. Two readers independently measured T2* values in the cartilaginous part of the joints. The first echo of the T2* mapping served as visual guidance to assist in delineating ROIs. ROIs were drawn covering the full-thickness cartilage layer of the iliac and sacral cartilage respectively. Bone cortex, vacuum phenomenon, and fluid were excluded in ROIs. T2∗ relaxation time was measured from the images of each cartilage compartment and then averaged to obtain the mean T2∗SIJs values. Clinical Characteristics, Ankylosing Spondylitis Disease Activity Score - C-reactive protein (ASDAS-CRP), and ‘positive MRI’ were recorded. Active sacroiliitis was evaluated using the Spondyloarthritis Research Consortium of Canada (SPARCC). Chronic sacroiliitis was assessed using Composite Structural Damage Score (CSDS) and Structural Score (SSS) fat.Results
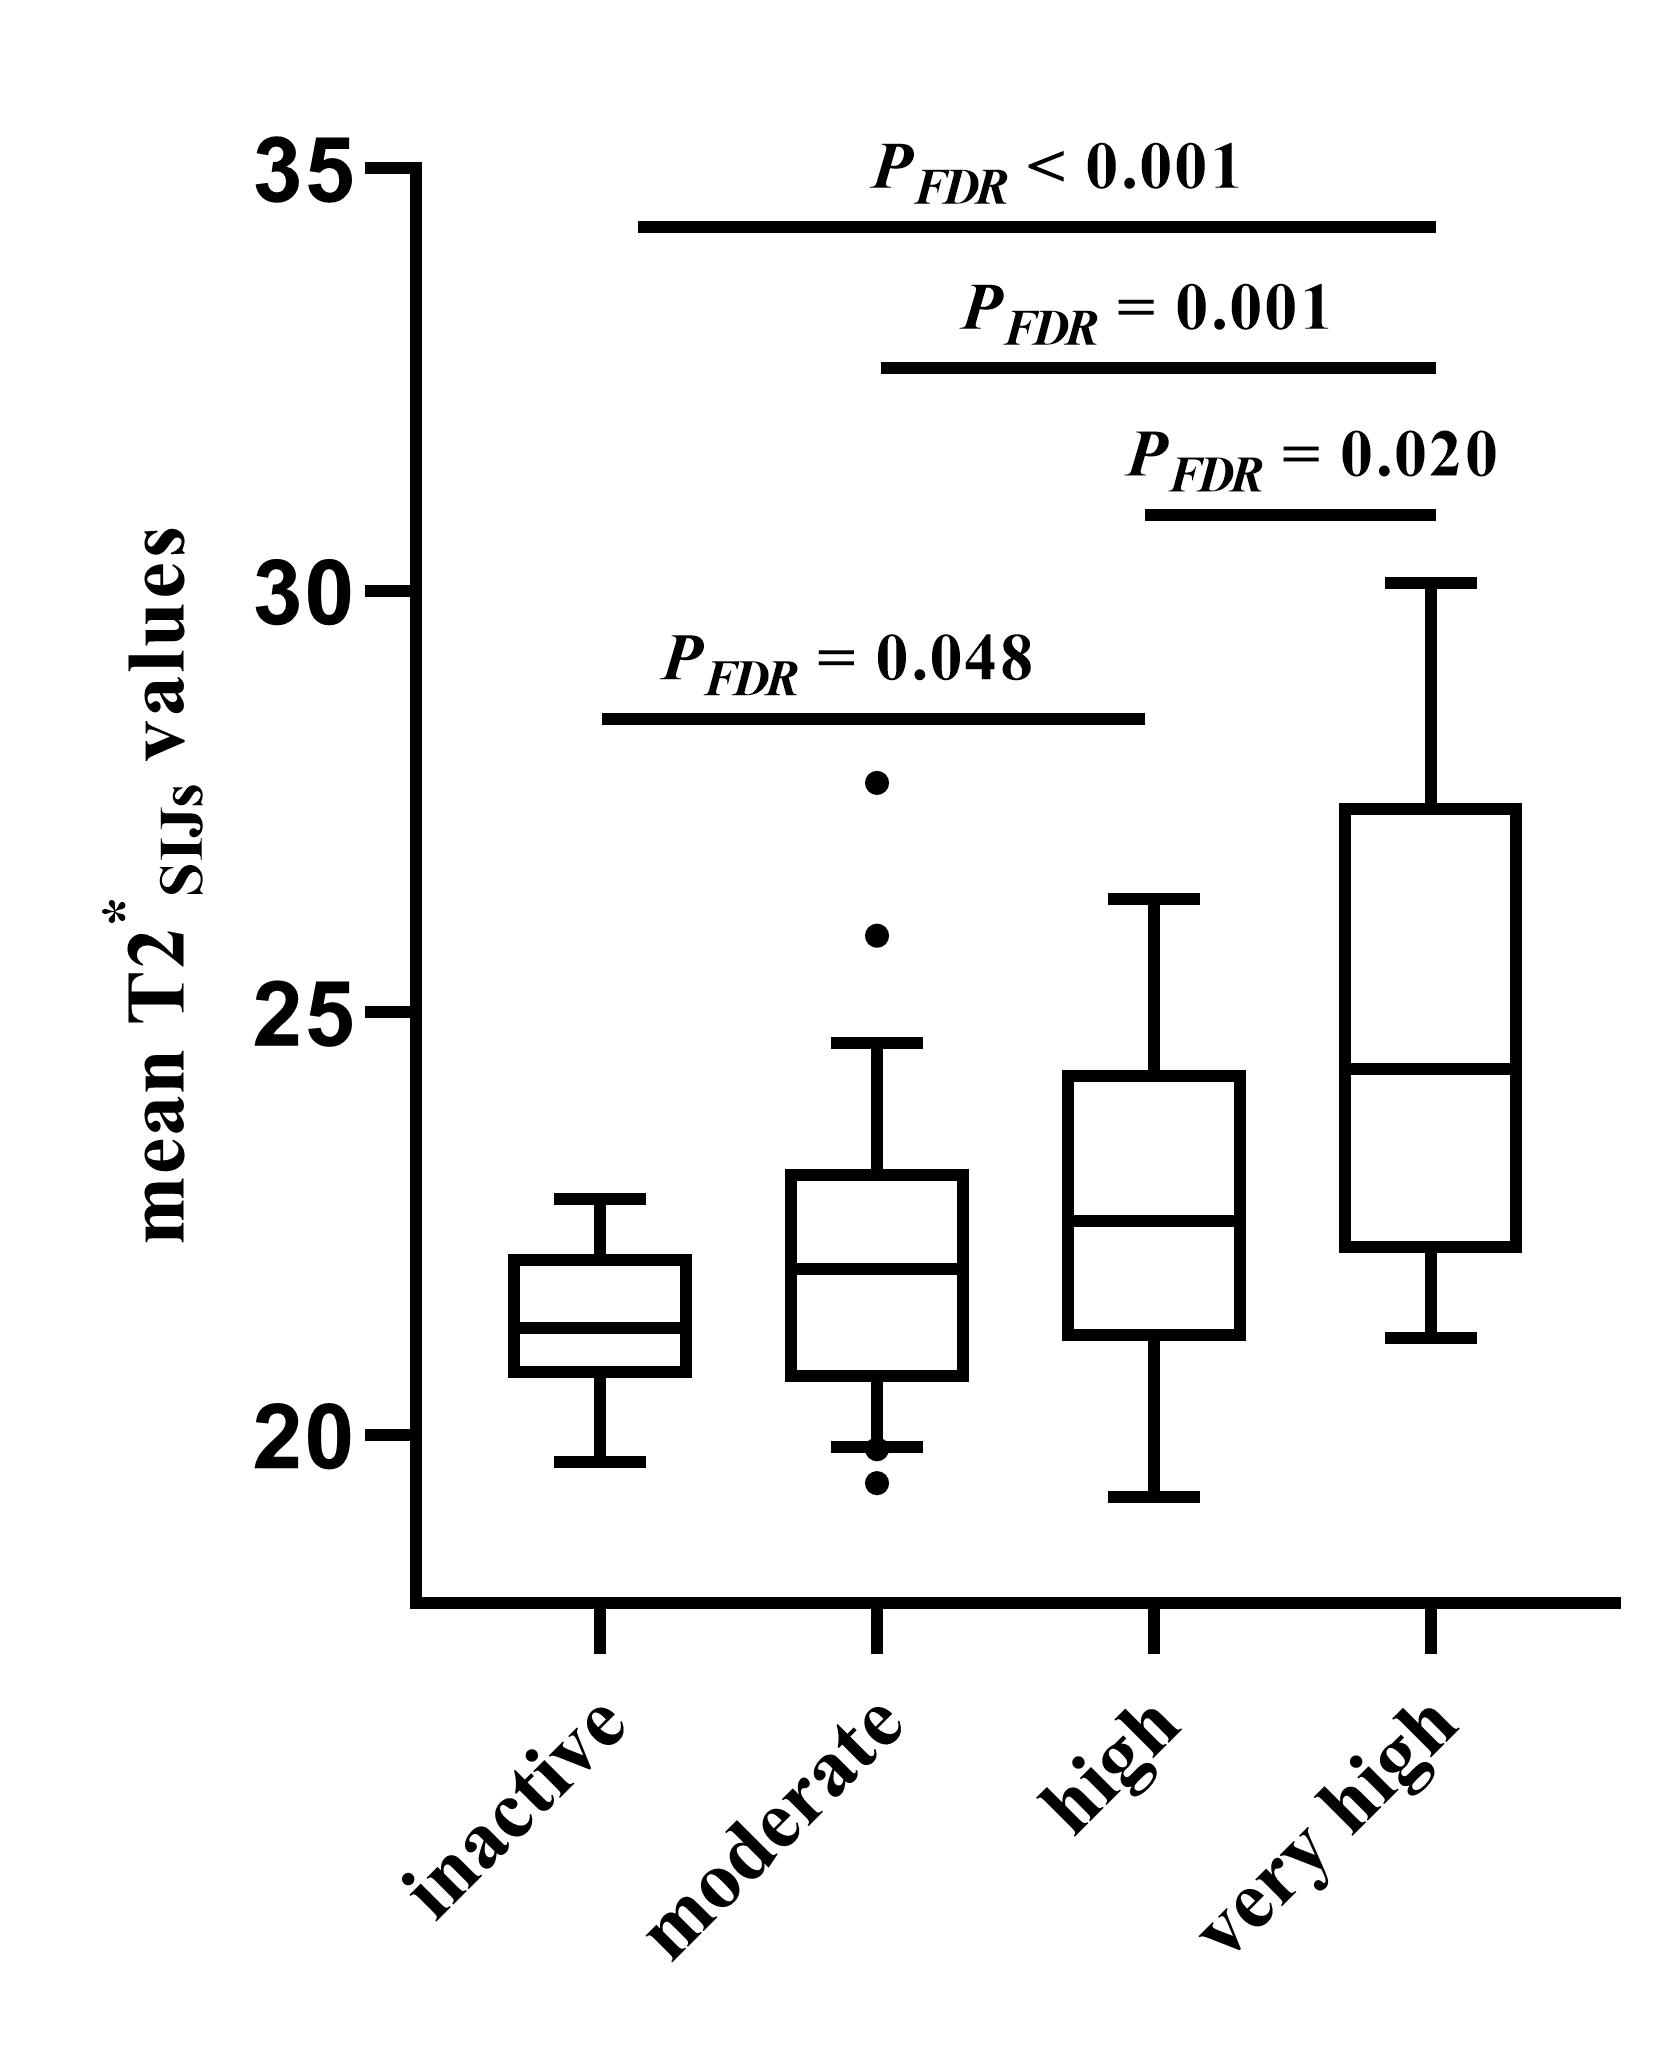
T2*SIJs values of axSpA patients were significantly higher than those of no-axSpA patients (22.86 ± 2.42 ms vs. 20.36 ± 1.30 ms, P < 0.001). The AUC of combined model (combining ‘positive MRI’ and T2*SIJs values) was significantly higher than that of ‘positive MRI’. T2*SIJs values were significantly different between the inactive and very high, moderate and very high, high and very high, as well as inactive and high disease activity groups (all PFDR ﹤0.05). In univariable analyses, the mean T2*SIJs values were significantly associated with age, elevated CRP, ASDAS-CRP, SPARCC, CSDS, and SSS fat (P < 0.05). In stepwise multiple linear regression, CSDS (β = 0.534, P < 0.001), SPARCC (β = 0.221, P = 0.019), ASDAS-CRP (β = 0.211, P = 0.023), and age (β = -0.173, P = 0.038) were independently associated with the mean T2*SIJs values.Discussion
T2* mapping has been suggested as an alternative to T2 mapping; it has shown reliable results in cartilage imaging because it has a shorter scan time and higher spatial resolution. Our study found an increased T2*SIJs value in patients with early axSpA, which indicates the presence of disordered cartilage in the initial stage of the disease. Bone marrow edema (BME) might not be sufficient to act as the sole criterion for a ‘positive MRI’. Our results showed that the combination of T2*SIJs values and ‘positive MRI’ significantly enhanced the AUC compared to ‘positive MRI’ alone for the identification of axSpA. The additional of T2* mapping was particularly notable improvement in terms of specificity. In stepwise multiple linear regression analyses, CSDS, SPARCC, ASDAS-CRP, and age were found to be significant determinant factors associated with cartilage damage in early axSpA. An important finding was that both acute and chronic sacroiliitis were closely related to cartilage damage. Our results may reveal pathophysiology of cartilage damage in axSpA.Conclusion
T2* values may be a promising biomarker for diagnosing and differentiating disease activity in early axSpA. CSDS, SPARCC, ASDAS-CRP, and age may identify patients who are at risk of cartilage destruction.Acknowledgements
No acknowledgement found.References
- Reveille JD (2015) Biomarkers for diagnosis, monitoring of progression, and treatment responses in ankylosing spondylitis and axial spondyloarthritis. Clin Rheumatol 34:1009-1018.
- Eck BL, Yang M, Elias JJ, et al (2023) Quantitative MRI for Evaluation of Musculoskeletal Disease: Cartilage and Muscle Composition, Joint Inflammation, and Biomechanics in Osteoarthritis. Invest Radiol 58:60-75.
- Andreisek G, Weiger M (2014) T2* mapping of articular cartilage: current status of research and first clinical applications. Invest Radiol 49:57-62.
- Albano D, Chianca V, Cuocolo R, et al (2018) T2-mapping of the sacroiliac joints at 1.5 Tesla: a feasibility and reproducibility study. Skeletal Radiol 47:1691-1696.
- Lefebvre G, Bergère A, Rafei ME, Duhamel A, Teixeira P, Cotten A (2017) T2 Mapping of the Sacroiliac Joints With 3-T MRI: A Preliminary Study. AJR Am J Roentgenol 209:389-394.
- Albano D, Bignone R, Chianca V, et al (2020) T2 mapping of the sacroiliac joints in patients with axial spondyloarthritis. Eur J Radiol 131:109246.
- Kasar S, Ozturk M, Polat AV (2022) Quantitative T2 mapping of the sacroiliac joint cartilage at 3T in patients with axial spondyloarthropathies. Eur Radiol 32:1395-1403.
- Navarro-Compán V, Benavent D, Capelusnik D, et al (2023) ASAS consensus definition of early axial spondyloarthritis. Ann Rheum Dis.
Figures