2257
Mapping Hip Cartilage Over Time: A Pipeline for Longitudinal Analysis of Quantitative MRI Using Radial Sections1Bernard and Irene Schwartz Center for Biomedical Imaging, Department of Radiology, New York University Grossman School of Medicine, New York, NY, United States, 2Center for Advanced Imaging Innovation and Research (CAI2R), Department of Radiology, New York University Grossman School of Medicine, New York, NY, United States, 3New York University Tandon School of Engineering, New York, NY, United States
Synopsis
Keywords: Cartilage, Osteoarthritis
Motivation: Scientific literature on osteoarthritis of the hip is very sparse, especially compared to the knee, because MRI assessment of the hip is incredibly challenging.
Goal(s): Our goal was to determine clinical feasibility for cartilage assessment of the hip captured through radial imaging planes.
Approach: We acquired 2D radial images of the hip joint at three different time points and assessed them using standard image processing techniques.
Results: We demonstrate that 2D radial imaging is a constructive approach for mitigating partial volume artifacts and the resulting images can be effectively processed for quantitative and qualitative analyses of the hip joint cartilage.
Impact: We demonstrate a processing pipeline for analysis of hip cartilage longitudinally acquired through radial imaging planes. The proposed methods could facilitate the clinical translation of quantitative radial imaging for assessment of the hip cartilage for pre-symptomatic indicators of disease.
Motivation
In osteoarthritis (OA), cartilage damage is detectable on morphological MRI only when it is already irreversible1. Quantitative MRI (qMRI) can instead capture biochemical changes in the early stages of OA2. While OA affects all major weight bearing joints, scientific literature focuses predominantly on qMRI assessment of the knee cartilage . At the 2023 ISMRM, the course ‘Clinical Translation of Quantitative MRI in MSK’ recognized the efforts of the MSK committee of the Quantitative Imaging Biomarkers Alliance (QIBA)3. in standardizing the development of qMRI biomarkers for the knee cartilage4. n the oral session entitled ‘Cartilage’, all but 1 paper featured knee research [5]. This trend is widespread in terms of both research focus and data availability. Longitudinal prospective studies like the Multicenter Osteoarthritis Study [6] and The Osteoarthritis Initiative [7] focus on knee OA and have hence contributed millions of images of the knee. Several recent challenges and workshops have also been dedicated to knee research 8,9.In stark contrast, there are no large-scale data repositories for the hip despite its status as a major weight bearing joint., in part due to the associated challenges in its MRI acquisition and assessment. Firstly, the hip articular cartilage is extremely thin (~2mm), and surrounded by layers of muscle and fat. There are specialized MRI coils for the knee, but none for the hip10. In addition, the hip intersects standard MRI planes at non-perpendicular angles due to its curvature and orientation, which results in partial volume averaging. MRI acquisitions along radial sections is an effective approach to eliminating partial voluming 10 and a recent work proposed its use for multiparametric qMRI of the hip cartilage11. However, no prior work has focused on developing methods to visualize and analyze qMR data along radial hip planes, which is critical to longitudinal studies and clinical adaptation. In this work, we propose an image processing pipeline to analyze longitudinal qMRI data of the hip cartilage acquired along radial sections.
Methods and Results
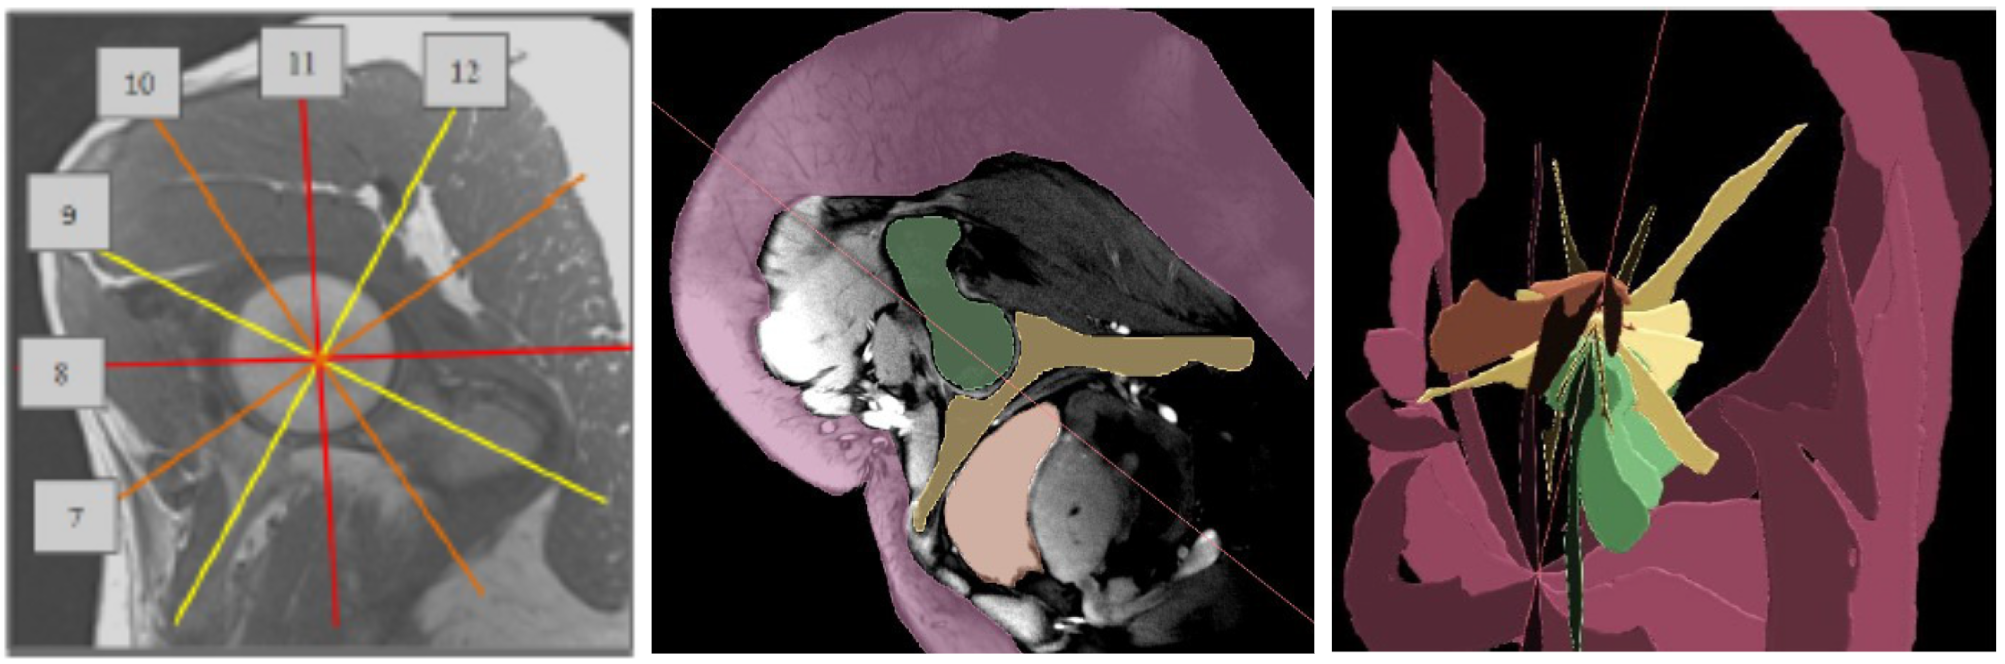
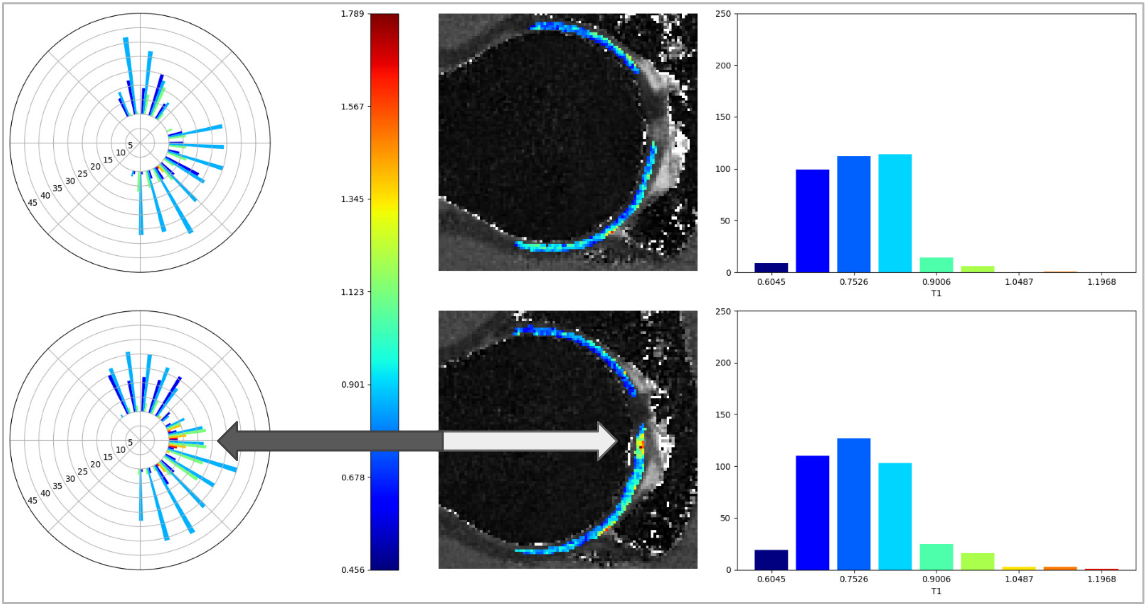
As proof of concept, we retrospectively analyzed three hip MRI datasets of the same patient acquired at three different time points, 12 months apart. The protocol included a 3D DIXON sequence of the pelvis and an MR Fingerprinting (MRF) sequence with six 2D radial hip sections11.adial slices were arranged at 30° iintervals perpendicular to a 'localizer' plane over the opening of the acetabulum (Figure 1). Proton Density, T1 and T2 maps were reconstructed from the MRF acquisition.The cartilage and surrounding bone in each 2D slice were segmented using a multi-label multi-modal semi-automated technique employing random forests and an active contour deformation model to generate segmentation maps 12. Deformation models are preferable over simpler object-agnostic methods because they allow incorporation of shape, smoothness and continuity constraints which is especially important when segmenting small structures with ambiguous boundaries. Since we had no ground truth data for validation of the cartilage segmentation, we developed a tool to visualize the regional descriptors of the segmentation using radial histograms (Figure 2). This aided us by detecting potential outliers of non-cartilage regions.
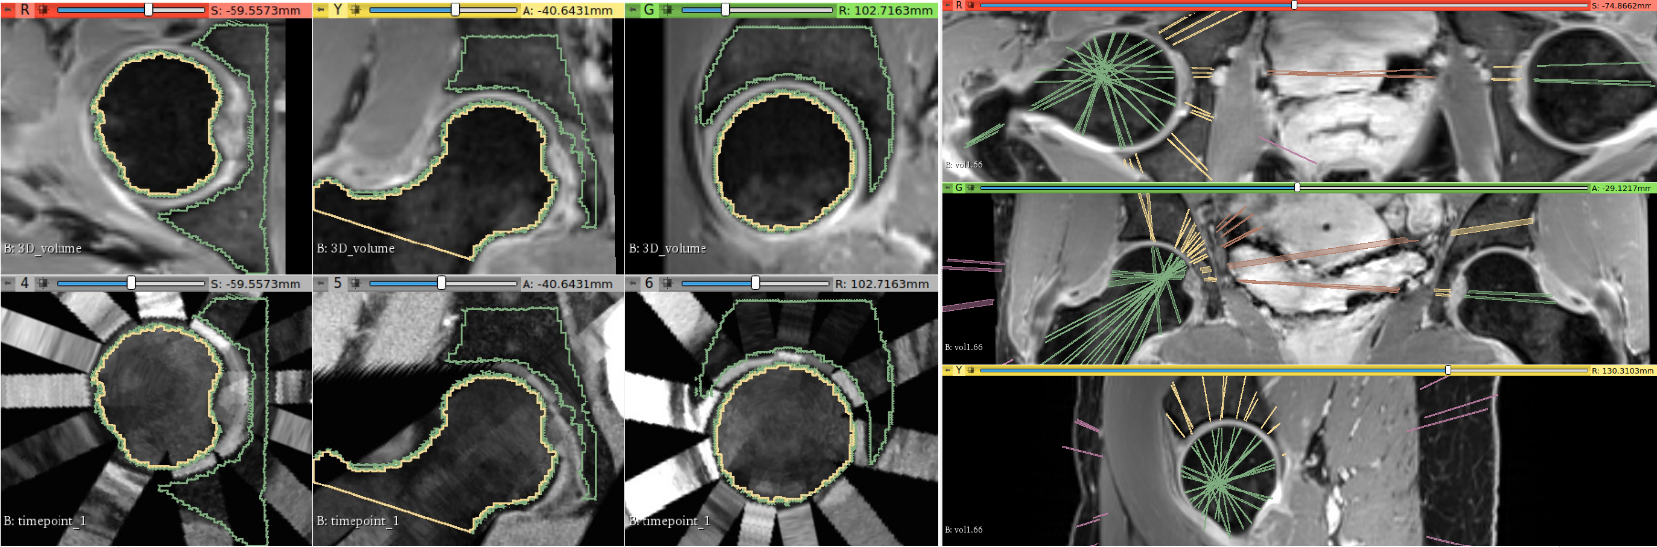
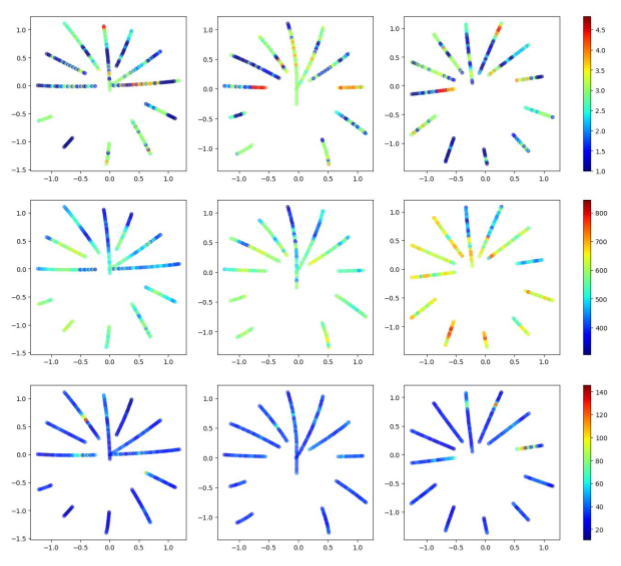
The 2D radial slices (Figure 1) made for a sparse 3D structure. To alleviate this , we padded the 2D slices with duplicates before compiling them into a pseudo-3D volume. Each of the three pseudo-volume for different time points was spatially normalized to the coordinate frame of the water-only 3D DIXON (Figure 3) using a 3D/3D affine registration13 We computed the DICE coefficients for the 2D bone segments with respect to their 3D bone maps as a proxy metric to evaluate the registration (Table 1) and demonstrated an acceptable mean coefficient value of 0.92. To analyze the cartilage, we unfolded the quantitative cartilage features from the pseudo-3D volume into 2D parameter maps by applying the Lambert-Azimuthal Equal Area projection. We aggregated the mean of each quantitative feature along the medial axis of its respective cartilage segment in its local coordinate frame, in order to reduce the dimensionality of the features to single-vector values that offer an intuitive ‘birds eye view’ of the cartilage properties (Figure 4).
Conclusion
We demonstrated a novel pipeline to analyze longitudinal qMRI data of the hip cartilage acquired along radial sections. Planned work includes processing data of the same type collected as part of a longitudinal study of patient with femoroacetabular impingement. We plan to fully automate the segmentation process using a multi-atlas approach for our follow-up analyses.Acknowledgements
No acknowledgement found.References
1. J. Kim, K. Mamoto, R. Lartey, K. Xu, K. Nakamura, W. Shin, C. S. Winalski, N. Obuchowski, M. Tanaka, E. Bahroos, et al. Multi-vendor multi-site t1ρ and t2 quantification of knee cartilage. Osteoarthritis and cartilage, 28(12):1539– 1550, 2020.
2. X. Li and S. Majumdar. Quantitative mri of articular cartilage and its clinical applications. Journal of Magnetic Resonance Imaging, 38(5):991–1008, 2013.
3. M. Chalian, X. Li, A. Guermazi, N. A. Obuchowski, J. A. Carrino, E. H. Oei, T. M. Link, and R. Q. M. B. Committee. The qiba profile for mri-based compositional imaging of knee cartilage. Radiology, 301(2):423–432, 2021.
4. M. Hall-Craggs, F. Liu. Clinical Translation of Quantitative MRI in MSK. https://www.ismrm.org/23/program-files/S-M-04.htm. ISMRM, 2023.
5. Cartilage. Musculoskeletal, Oral Session. https://www.ismrm.org/23/program-files/O-31.htm. ISMRM, 2023.
6. N. A. Segal, M. C. Nevitt, K. D. Gross, J. Hietpas, N. A. Glass, C. E. Lewis, and J. C. Torner. The multicenter osteoarthritis study (most): opportunities for rehabilitation research. PM & R: the journal of injury, function, and rehabilitation, 5(8), 2013.
7. The Osteoarthritis Initiative. https://nda.nih.gov/oai/.
8. T. Heimann, B. J. Morrison, M. A. Styner, M. Niethammer, and S. Warfield. Segmentation of knee images: a grand challenge. In Proc. MICCAI Workshop on Medical Image Analysis for the Clinic, volume 1. Beijing, China, 2010. https://ski10.grand-challenge.org/.
9. A. D. Desai, F. Caliva, C. Iriondo, A. Mortazi, S. Jambawalikar, U. Bagci, M. Perslev, C. Igel, E. B. Dam, S. Gaj, et al. The international workshop on osteoarthritis imaging knee mri segmentation challenge: a multi-institute evaluation and analysis framework on a standardized dataset. Radiology: Artificial Intelligence, 3(3):e200078, 2021.
10. C. N. Petchprapa, K. S. Dunham, R. Lattanzi, and M. P. Recht. Demystifying radial imaging of the hip. Radiographics, 33(3):E97–E112, 2013.
11. M. A. Cloos, J. Asslander, B. Abbas, J. Fishbaugh, J. S. Babb, G. Gerig, and R. Lattanzi. Rapid radial t1 and t2 mapping of the hip articular cartilage with magnetic resonance fingerprinting. Journal of Magnetic Resonance Imaging, 50(3):810–815, 2019.
12. P. A. Yushkevich, Y. Gao, and G. Gerig. Itk-snap: An interactive tool for semi-automatic segmentation of multi-modality biomedical images. In 2016 38th Annual International Conference of the IEEE Engineering in Medicine and Biology Society (EMBC), pages 3342–3345, 2016. www.itksnap.org.
13. P. Yushkevich. Pyushkevich/greedy: Very fast greedy diffeomorphic registration code. https://github.com/pyushkevich/greedy.
14. E. Bulat, S. D. Bixby, C. Siversson, L. A. Kalish, S. K. Warfield, and Y.-J. Kim. Planar dgemric maps may aid imaging assessment of cartilage damage in femoroacetabular impingement. Clinical Orthopaedics and Related Research®, 474:467–478, 2016.
Figures