2256
Repeatability of Quantitative T1, T2 and T1ρ Mapping of Knee Cartilage with 3D-MR Fingerprinting1Bernard and Irene Schwartz Center for Biomedical Imaging, Department of Radiology, New York University Grossman School of Medicine, New York, NY, United States, 2Center for Advanced Imaging Innovation and Research (CAI2R), Department of Radiology, New York University Grossman School of Medicine, New York, NY, United States
Synopsis
Keywords: Cartilage, Cartilage
Motivation: 3D-MRF sequence for simultaneous multi-parametric mapping has the potential to provide a more time-efficient comprehensive evaluation of the knee cartilage.
Goal(s): However, evaluation of 3D-MRF repeatability of knee cartilage is limited.
Approach: 3D-MRF and conventional sequences for knee cartilage were acquired four times on fourteen healthy subjects. Multi-parametric maps were computed and repeatability was evaluated.
Results: High inter- and intra-subject repeatabilities were found using the 3D-MRF sequence over seven days with good agreement to conventional sequences.
Impact: The 3D-MRF sequence showed high T1, T2, and T1ρ repeatability on knee cartilage on different days and good agreement with conventional methods.
Introduction
Quantitative MRI parameters, including T1, T2 and T1ρ , have been used to quantify changes in cartilage composition and structure during the early stages of knee osteoarthritis1,2. However, commonly used techniques to obtain these parameters acquire a single parameter each time resulting in long MRI examination times. A three-dimensional MR fingerprinting (3D-MRF) sequence has recently been developed for simultaneous T1, T2, and T1ρ mappings3. However, only the intra-day repeatability has been documented3. The repeatability of the knee cartilage with 3D-MRF sequence on different days has not been investigated.Methods
Data Acquisition: On a 3T scanner and after getting informed consent, 14 healthy subjects (35.4±9.3 years) were scanned on the left or right knee on day one and day seven with two repeated scans on each day, resulting in 4 scans. Each scan consists of one 3D-MRF (quantifying T1, T2, T1ρ, and B1+) and three conventional maps using a 3D-VIBE, T2-prepared Turbo-FLASH, and T1ρ-prepared Turbo-FLASH for T1, T2 and T1ρ, respectively4.Data Processing and Statistical Analysis: A dictionary of simulated MR fingerprints was created with a T1 range of 50-3000ms, and T2 /T1ρ range of 2-200ms, in steps of 5% increments, and flip angle ranges of 30° to 90° in steps of 15°5. The measured MR fingerprints and the simulated dictionary were compressed using singular value decomposition to speed up the offline dictionary matching6. Cartilage T1, T2, and T1ρ maps were created using dictionary matching, and conventional parameters were fitted using mono-exponential models with a deep learning approach7. Five regions of interest (ROIs) were manually drawn: the lateral femur, lateral tibia, medial femur, medial tibia, and patella cartilages. The statistical analysis was stratified by parameter and the ROI using data from all four scans. We used restricted maximum likelihood (REML) estimation of variance components in a random effects regression model to estimate the inter-subject variance and the intra-day and inter-day components of the intra-subject variance. For each component of the intra-subject variance, the coefficient of variation (CV) was estimated as the square root of the estimated variance component expressed as a percentage of the overall mean8. The intra-class correlation coefficient (ICC) was estimated using the inter-subject variance over the sum of the inter-subject variance and the intra-subject variance9. Regression and Bland-Altman analysis were performed to compare measurements between the 3D-MRF sequence and conventional techniques. Bland-Altman plots were used to assess the intra-day and inter-day limits of agreement in the repeated parameter measurements from the 3D-MRF.
Repeatability Metrics: The intra-subject and inter-subject repeatabilities were assessed using CV and ICC, respectively along with variance.
Results
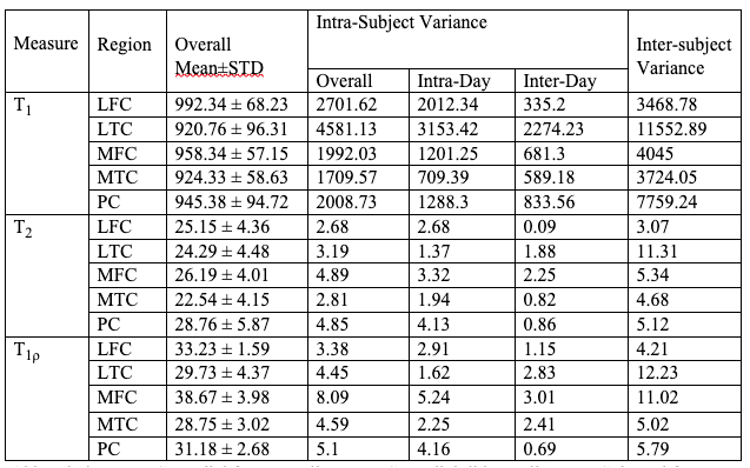
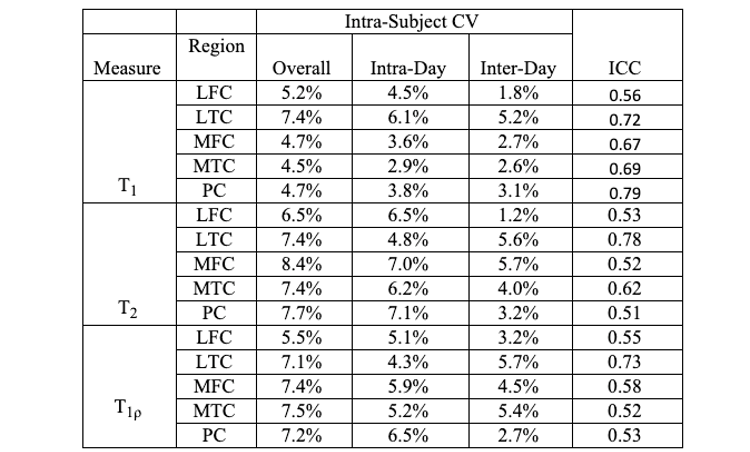
Table 1 summarizes the overall mean and REML estimates of the inter- and intra-subject variance. The intrer-subject shows larger variance compared to inter-subject.Table 2 summarizes the results of the coefficient of variation (CV) associated with each component of the intra-subject variance, an estimate of intra-class correlation (ICC) across the four scans. Overall, the CV is smaller than 8.4%, and ICC larger than 0.51.
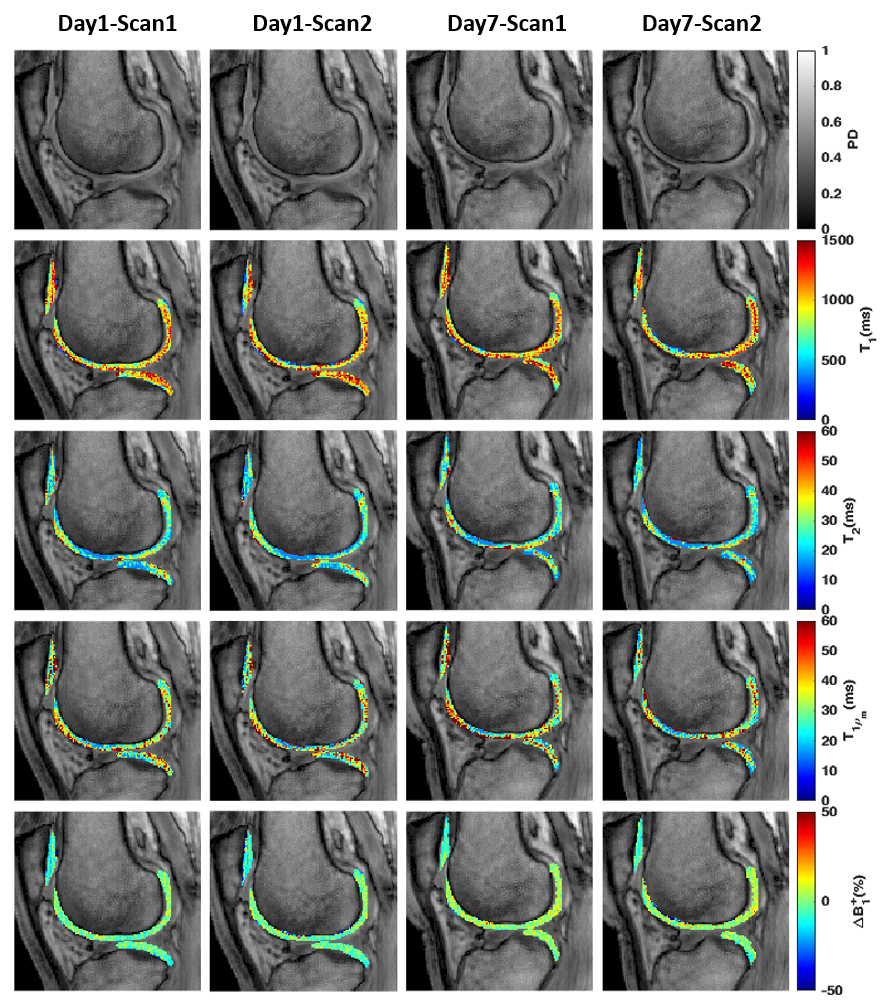
Figure 1 shows one representative slice of the cartilage T1, T2, and T1ρ maps of the LFC and LTC. The multi-parameter maps showed high agreement for parameter measurements across the four scans acquired one week apart.
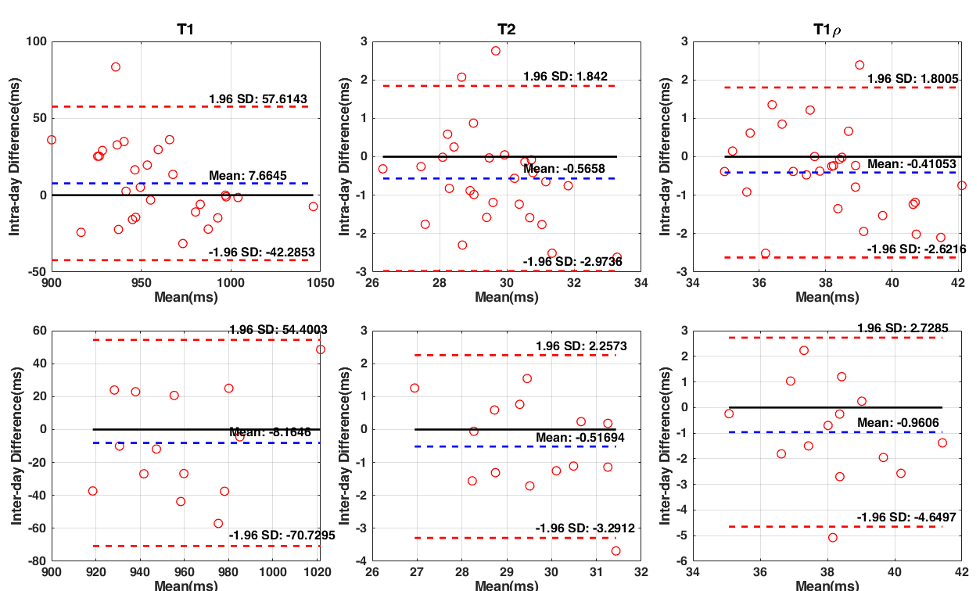
Figure 2 shows the Bland-Altman plots for the intra- and inter-day repeatabilities of cartilage T1, T2, and T1ρ measurements acquired with the 3D-MRF sequence. The mean differences between the two scans acquired on the same day, and scans acquired on both days were smaller than 9, 0.57, and 0.96 for cartilage T1, T2, and T1ρ measurements, respectively.
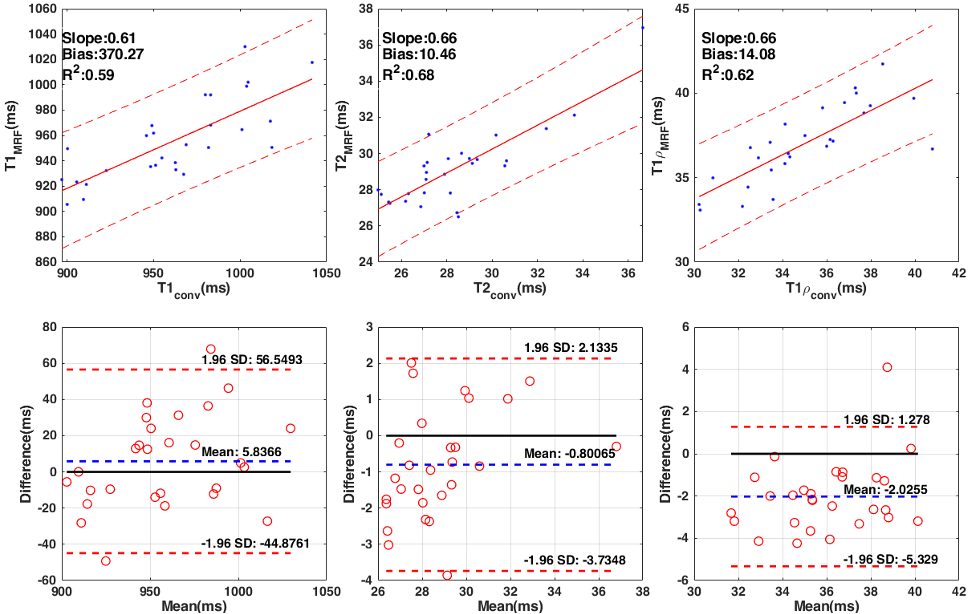
Figure 3 shows the regression plots and Bland-Altman plots for measurements between the conventional and the 3D-MRF sequence. For the regression analysis, correlation coefficients (R2) were 0.59, 0.68, and 0.62, and regression slopes were 0.61, 0.66, and 0.66 for cartilage T1, T2, and T1ρ, respectively. The mean difference between the conventional and 3D-MRF sequences was 5.84, -0.80, and -2.03 for cartilage T1, T2, and T1ρ measurements, respectively.
Discussion and Conclusion
This study demonstrated high inter-subject and intra-subject repeatability in the measurement of knee cartilage T1, T2, and T1ρ of healthy subjects using the 3D-MRF sequence over a seven-day period, which also exhibited good agreement with conventional sequences. The 3D-MRF sequence has the potential to provide a more time-efficient comprehensive evaluation of cartilage composition and structure in subjects with knee OA, allowing them to better characterize disease severity and monitor treatment response. Future work includes acquiring data at different sites and different types of MRI scanners to explore the site vendor effects on the 3D-MRF repeatability and extend to patients with knee OA.Acknowledgements
This study was supported by NIH grants, R21-AR075259-01A1, R01-AR068966, R01-AR076328-01A1, R01-AR076985-01A1, and R01-AR078308-01A1 and was performed under the rubric of the Center of Advanced Imaging Innovation and Research (CAI2R), an NIBIB Biomedical Technology Resource Center (NIH P41-EB017183).References
1. Gray ML, Eckstein F, Peterfy C, Dahlberg L, Kim YJ, Sorensen AG. Toward imaging biomarkers for osteoarthritis. Clin Orthop Relat Res. 2004;427(427): S175-S181. doi:10.1097/01.blo.0000144972.50849.d9
2. Guermazi A, Alizai H, Crema MD, Trattnig S, Regatte RR, Roemer FW. Compositional MRI techniques for evaluation of cartilage degeneration in osteoarthritis. Osteoarthr Cartil 2015;23(10):1639-1653
3. Sharafi A, Zibetti MVW, Chang G, Cloos M, Regatte RR. 3D MR- fingerprinting for rapid simultaneous T1, T2, and T1ρ volumetric map- ping of the human articular cartilage at 3T. NMR Biomed 2022;34(7): e4800. https://doi.org/10.1002/nbm.4531.
4. Sharafi A, Chang G, Regatte RR. Biexponential T2 relaxation estimation of human knee cartilage in vivo at 3T.J Magn Reson Imaging.2018;47(3):809-819. doi:10.1002/jmri.25778
5. Weigel, M. Extended phase graphs: dephasing, RF pulses, and echoes - pure and simple. J Magn Reson Imaging 41, 266–295 (2015). https://doi.org:10.1002/jmri.2461952.
6. McGivney, D. F. et al. SVD Compression for Magnetic Resonance Fingerprinting in the Time Domain. Ieee Transactions on Medical Imaging 33, 2311–2322 (2014). https://doi.org:10.1109/Tmi.2014.2337321.
7. Zibetti MVW, Sharafi A, Regatte RR. Optimization of spin-lock times in T1ρ mapping of knee cartilage: Cramer-Rao bounds versus matched sampling-fitting. Magn Reson Med 2022;87(3):1418-1434.
8. Abdi H. Coefficient of variation. Encyclopedia of research design. 2010 Jun;1(5).
9. Rodriguez GG, Yu Z, O′ Donnell LF, Calderon L, Cloos MA, Madelin G. Repeatability of simultaneous 3D 1H MRF/23Na MRI in brain at 7 T. Scientific Reports. 2022 Aug 19;12(1):14156
Figures