2255
The influence of fat-suppression on T2 values and texture features in articular cartilage1Department of Biomedical Imaging and Image-guided Therapy, Medical University of Vienna, Vienna, Austria, 2Department of Imaging Methods, Institute of Measurement Science, Bratislava, Slovakia, 3Department of Orthopedics and Trauma Surgery, Medical University of Vienna, Vienna, Austria, 4Department of translational Medicine, Novartis Biomedical Research, Basel, Switzerland, 5Center for MR Research, University Children's Hospital, Zurich, Switzerland, 6Division of Radiological Physics, Department of Radiology, University of Basel Hospital, Basel, Switzerland, 7Siemens Healthcare AG, Forchheim, Germany, 8Center for Anatomy and Cell Biology, Division of Anatomy, Medical University of Vienna, Vienna, Austria, 9CD Laboratory for MR Imaging Biomarkers (BIOMAK), Vienna, Austria, 10Austrian Cluster for Tissue Regeneration, Ludwig Boltzmann Institute for Experimental and Clinical Traumatology, Vienna, Austria, 11Institute for Clinical Molecular MRI in the Musculoskeletal System, Karl Landsteiner Society, Vienna, Austria
Synopsis
Keywords: Cartilage, Cartilage
Motivation: If fat signal is not properly suppressed, it can lead to errors in the T2 calculations in human articular cartilage.
Goal(s): This work aimed to quantify the influence of fat suppression on T2 values as well as texture features extracted from T2 maps.
Approach: Ten donors were scanned in 3T MRI with DESS, T2-TESS and CPMG with and without fat suppression.
Results: The results of this study showed the importance of using fat suppression while acquiring T2 maps. The influence of fat suppression was substantially greater for CPMG-T2-mapping compared to TESS-T2-mapping.
Impact: If fat signal is not properly suppressed, it can lead to errors in the T2 calculations in human articular cartilage which can have a significant impact on longitudinal clinical trials.
INTRODUCTION
The addition of fat suppression on T2 mapping in musculoskeletal research is a known feature, as it helps separate fat and water signals, improves tissue contrast, ensures accurate T2 calculations, and increases the sensitivity of the technique to changes in T2 relaxation times [1]. This is important for the accurate assessment of articular cartilage conditions in both clinical and research studies [2, 3]. Despite that, many multicentre clinical trials use the T2 mapping without fat suppression. This work aimed to quantify the influence of fat suppression on T2 values as well as texture features extracted from T2 maps.METHODS
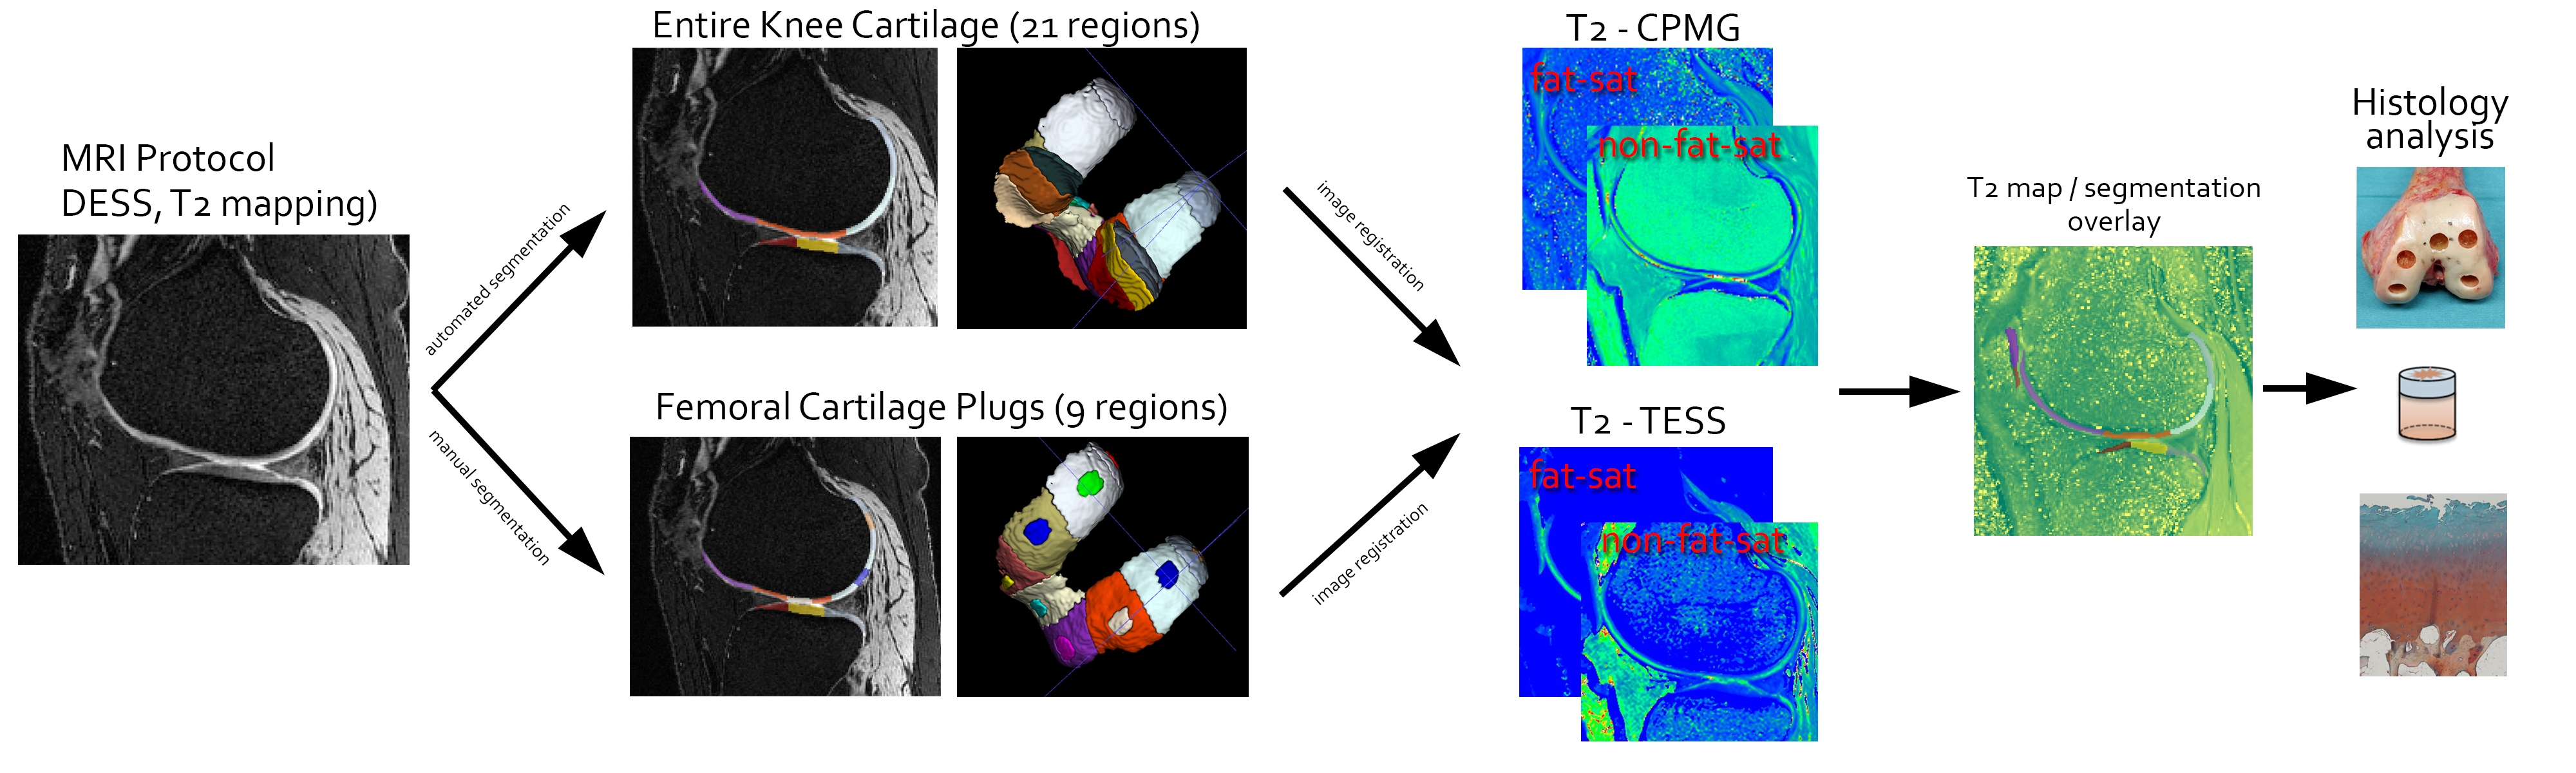
Ten knees of ten donors were collected in accordance with the terms of the ethics committee of the Medical University of Vienna (EK-No.: 1081/2021), and scanned with a 3T MRI MAGNETOM Prisma Fit scanner (Siemens Healthineers AG, Forchheim, Germany). The imaging protocol comprised a high-resolution 3D sequence (DESS, TE=2.53ms, TR=8.68ms, 224 slices, 0.5x0.5x0.5mm3, FA=18°, TA=3:56min), and T2 mapping sequences such as a conventional multi-echo spin-echo sequence (CPMG, TE=11.1 to 88.8ms, TR=2750ms, 24 slices, 0.5x0.5x2.5mm3, FA=180°, TA=7:50min) and triple echo steady state (TESS, TE=4.43ms, TR=8.74ms, 32 slices, 0.5x0.5x3.0mm, FA=15°, TA=3:17min) both with and without fat suppression). 3D DESS images were used for automatic cartilage segmentation into 21 cartilage regions including 9 femoral regions using the MR ChondralHealth version 3.1 research application software (Siemens Healthineers AG, Forchheim, Germany, segmentation algorithm based on the work from [5,6]). Nine cartilage plugs were taken from the nine femoral regions and the histopathological degeneration was assessed using the Mankin score (Figure 1). Spearman correlation coefficients were calculated for 21 cartilage regions between the two acquisition modalities and for the 9 plugs between the histology scores and T2 values, both for global T2 and zonal T2 (superficial/deep layer) as well as six selected GLCM features.RESULTS
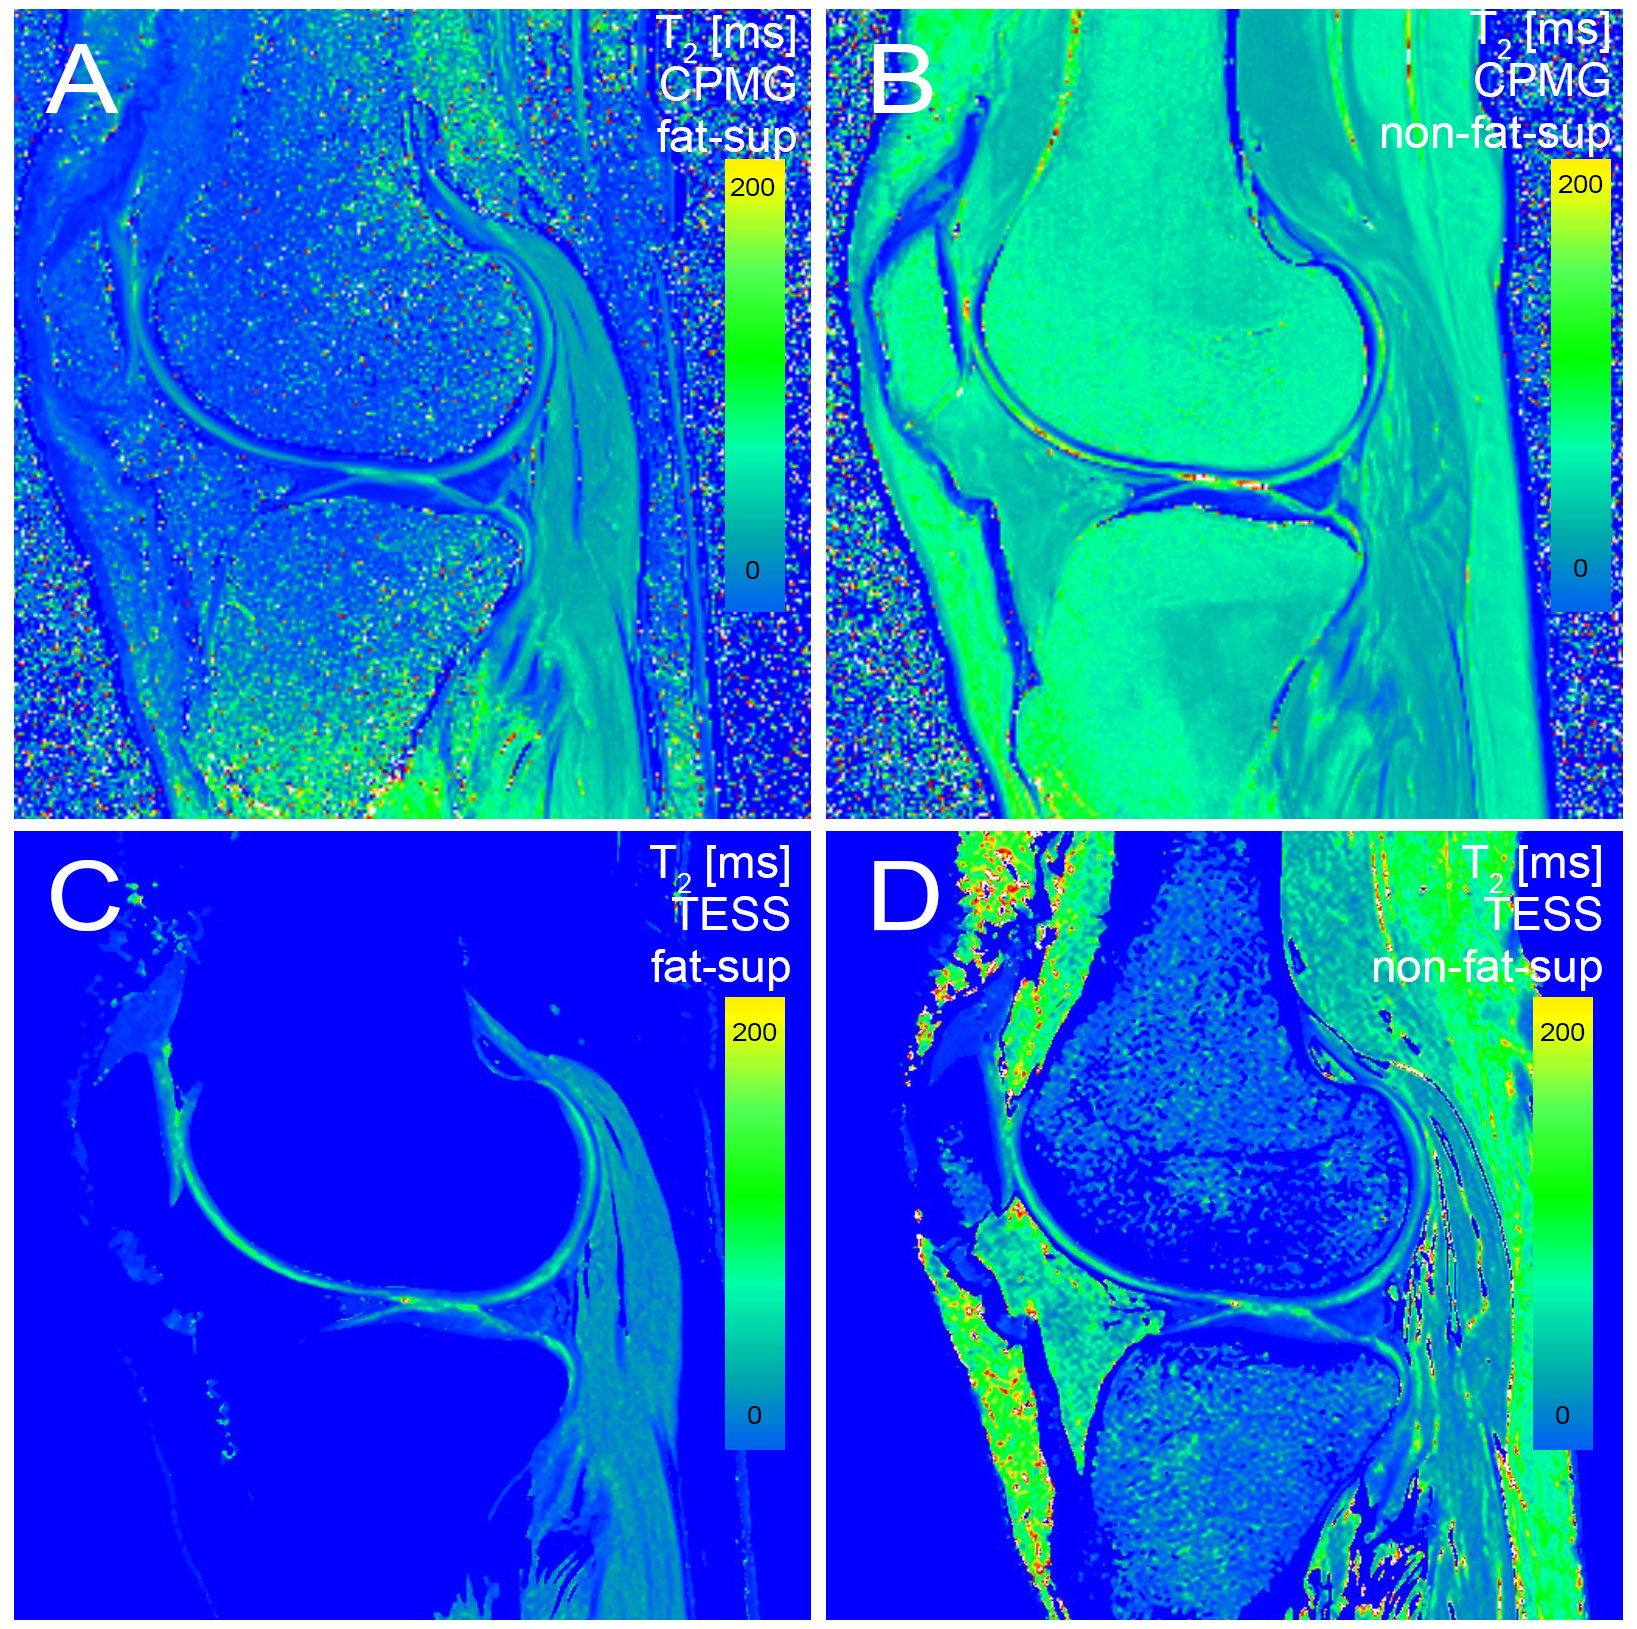
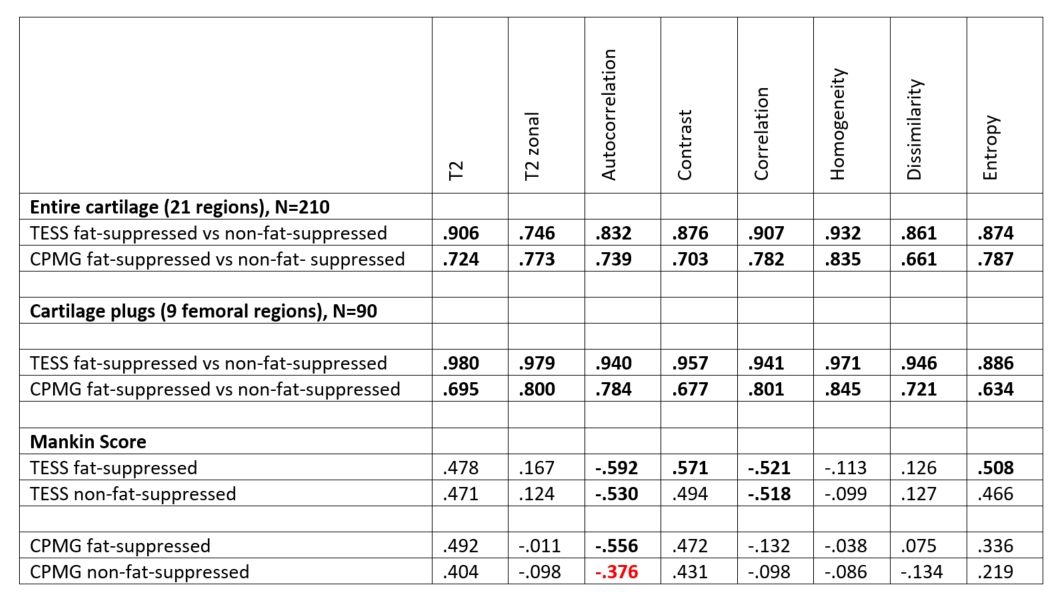
Representative T2 maps acquired with both sequences (CPMG and TESS) are depicted on Figure 1. For the entire cartilage, the correlation between non-fat- suppressed and fat- suppressed T2 values was moderate for CPMG (mean correlation of 0.751 ± 0.06, ranging from 0.661 to 0.835) and remarkably high for TESS (mean correlation of 0.867 ± 0.06, ranging from 0.746 to 0.932) in various cartilage regions. Regarding cartilage plugs, the correlation between non-fat-suppressed and fat- suppressed T2 values was again weaker for CPMG (mean correlation of 0.745 ± 0.07, ranging from 0.634 to 0.845) than for TESS (mean correlation of 0.950 ± 0.03, ranging from 0.886 to 0.980) in various cartilage regions. The correlation of GCLM features with Mankin scores initially observed from fat-sat T2 maps [DL1] appeared lowered when using the non-fat sat TESS sequence and even non-significant with the non-fat sat CPMG sequence (autocorrelation, from -0.556 to -0.376)DISCUSSION
The results of this study showed the importance of using fat suppression while acquiring T2 maps. The influence of fat suppression was substantially greater from CPMG-T2-mapping compared to TESS-T2-mapping. Interestingly, in both cartilage plugs and the entire cartilage, no correlation of zonal T2 (superficial/deep cartilage zone) with GLCM features was found. The small regions-of-interests on T2 maps likely caused high variation in zonal T2 values.CONCLUSION
If fat signal is not properly suppressed, it can lead to errors in the T2 and texture features calculations. Fat suppression can increase the sensitivity of the MRI technique to changes in T2 relaxation times in water-containing tissues. This can be particularly valuable in applications where subtle changes in tissue properties need to be detected, such as in the early stages of cartilage tissue degeneration.Acknowledgements
This work was supported by Novartis Pharma research grant.References
[1] Del Grande et al., Fat-Suppression Techniques for 3-T MR Imaging of the Musculoskeletal System, RadioGraphics, 34(1), 217-233, 2013
[2] Mosher T. et al., Cartilage MRI T2 Relaxation Time Mapping: Overview and Applications, Semin Musculoskelet Radiol; 08(4): 355-368, 2004
[3] Liess C. et al., Detection of changes in cartilage water content using MRI T2-mapping in vivo, Osteoarthritis and Cartilage, 10(12), 907-913, 2002
[4] Juras et al., Characterization of the Textural Features from Quantitative MRI for Determination of Cartilage Degeneration, Proceedings of ISMRM 2023, Toronto, Canada, Abstract 1114
[5] J. Fripp, S. Crozier, S. K. Warfield, and S. Ourselin, “Automatic Segmentation and Quantitative Analysis of the Articular Cartilages from Magnetic Resonance Images of the Knee,” IEEE Trans. Med. Imaging, vol. 29, no. 1, pp. 55–64, Jan. 2010, doi: 10.1109/TMI.2009.2024743.
[6] S. S. Chandra, Y. Xia, C. Engstrom, S. Crozier, R. Schwarz, and J. Fripp, “Focused shape models for hip joint segmentation in 3D magnetic resonance images,” Med. Image Anal., vol. 18, no. 3, pp. 567–578, 2014, doi: http://dx.doi.org/10.1016/j.media.2014.02.002.
Figures