2254
Robust Fitting Methods for Knee Cartilage T1ρ Quantification with Varied SNR – Preliminary results from a Multi-vendor Multi-site study1Program of Advanced Musculoskeletal Imaging (PAMI), Cleveland Clinic, Cleveland, OH, United States, 2Department of Biomedical Engineering, Lerner Research Institute, Cleveland Clinic, Cleveland, OH, United States, 3Department of Biomedical Engineering, Case Western Reserve University, Cleveland, OH, United States, 4Department Electrical, Computer, and Systems Engineering, Case Western Reserve University, Cleveland, OH, United States, 5Department of Diagnostic Radiology, Imaging Institute, Cleveland Clinic, Cleveland, OH, United States, 6Department of Radiology and Biomedical Imaging, University of California, San Francisco, San Francisco, CA, United States, 7Department of Radiology, Albert Einstein College of Medicine, Bronx, NY, United States, 8Department of Biomedical Engineering, University at Buffalo, Buffalo, OH, United States, 9Department of Electrical Engineering, University at Buffalo, Buffalo, NY, United States, 10Department of Radiology, University of Kentucky, Lexington, KY, United States
Synopsis
Keywords: Cartilage, MSK
Motivation: High-resolution T1ρ mapping is desired for improved sensitivity to small lesions and less partial volume averaging effects. However, the low image SNR can induce bias in T1ρ quantification.
Goal(s): To develop and evaluate advanced fitting methods of high-resolution T1ρ mapping in a multi-site multi-vendor setting.
Approach: High-resolution T1ρ mapping in volunteers were collected with a harmonized protocol from three sites and three MR platforms. Data were fitted with nonlinear least-squares (NLS) fitting, noise-corrected NLS fitting (NCNLS), and maximum-likelihood estimation (MLE).
Results: :NLS overestimated T1ρ while NCNLS and MLE reduced the overestimation. The results were consistent across all sites
Impact: Advanced fitting methods can reduce fitting errors induced by low SNR for high-resolution T1ρ mapping, which may provide improved diagnosis of osteoarthritis.
Introduction
Quantitative MRI techniques including T1ρ mapping have been developed for early osteoarthritis (OA) detection since it is sensitive to changes in cartilage matrix which happens at the early stages of the disease1. However, current T1ρ imaging is limited by relatively low resolution (slice thickness 3-4mm). We previously demonstrated that high-resolution T1ρ imaging (slice thickness 1.6mm) detected small lesions, and had reduced partial volume averaging effects2. However, the high-resolution T1ρ images have lower signal-to-noise ratio (SNR), which may induce bias during T1ρ quantification with standard nonlinear least-squares (NLS) fitting. In a previous study, we developed advanced fitting methods, including noise-corrected NLS (NCNLS) fitting, and maximum-likelihood estimation (MLE), targeting to reduce the low SNR-induced fitting bias3. The goal of the study was to 1) systematically evaluate the relationship between SNR and fitting bias using NLS, NCNLS and MLE methods; and 2) to evaluate fitting results using NLS, NCNLS and MLE methods in high-resolution and standard-resolution T1ρ imaging in human subjects across three sites and three MR platforms with a harmonized protocol.Method
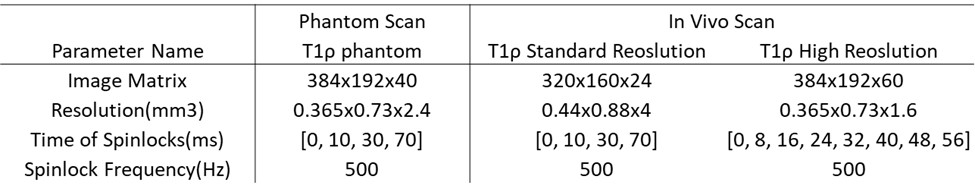
Data Acquisition:Phantom: Repeated scans of agarose gel phantoms were collected at Site 1 with the 3D MAPSS T1ρ sequence4,5 (parameters in Table 1).
In vivo data: Seven volunteers were scanned at three sites using MAPSS T1ρ (parameters in Table 1): four at Site 1 (3 males, 32.17.7 years, PrismaFit Siemens Healthineers, 1Tx/15Rx QED knee coil); two at Site 2 (2 females, 36.56.4 years, SIGNA Premier, 1Tx/18Rx QED knee coil); one at Site 3 (male, 37 years, Ingenia, Philips Healthcare, 1Tx/16Rx InVivo knee coil). Morphological imaging was acquired using DESS (Siemens)/MENSA (GE)/SPGR(Philips) with FOV 140x140x112 mm3, resolution 0.36x0.4x0.7 mm3.
Data analysis:
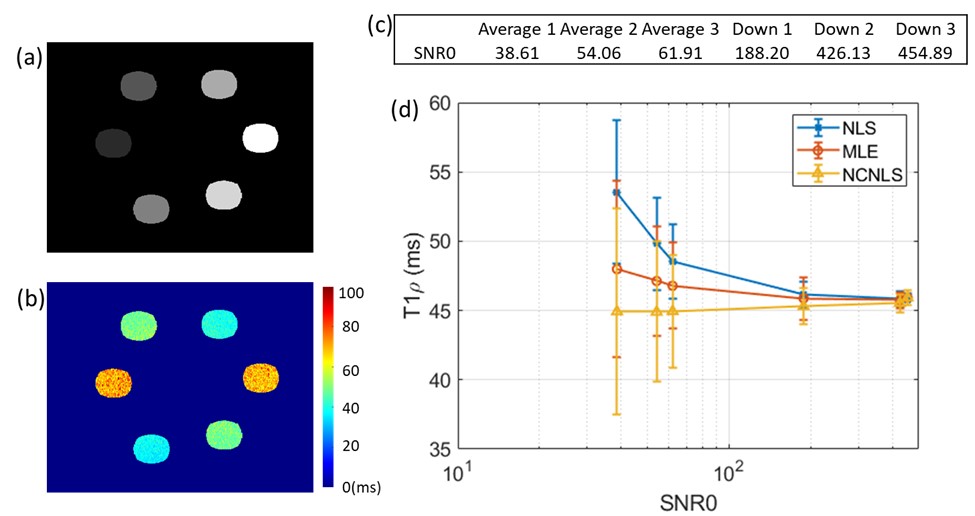
For phantom data, the repeated scans were averaged and downsampled in k-space and using Sum-of-Square(SOS) reconstruction to generate images with different SNRs.
For in vivo data, SOS was applied to the raw k-space data to reconstruct the T1ρ echo images. Six compartments of cartilage were segmented in DESS/MENSA/ SPGR images after registration using in-house developed auto segmentation6.
SNRs of T1ρ images were calculated as the ratio of signal within segmented phantom ROI or cartilage compartments over background noise standard deviation.
NLS, MLE3,7 and NCNLS3,8,9 methods were applied to T1ρ images, utilizing masks generated from segmentation.
Bias was evaluated by comparing the mean values and coefficients of variation (CV) between different fitting methods and between T1ρ imaging with different resolutions.
Result
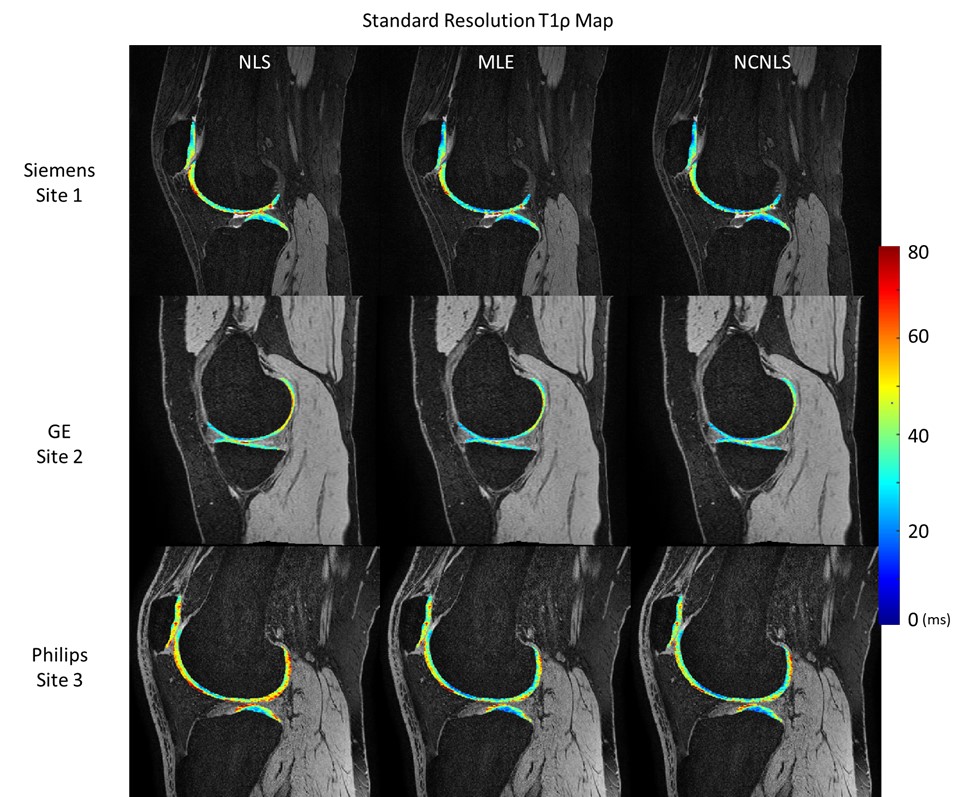
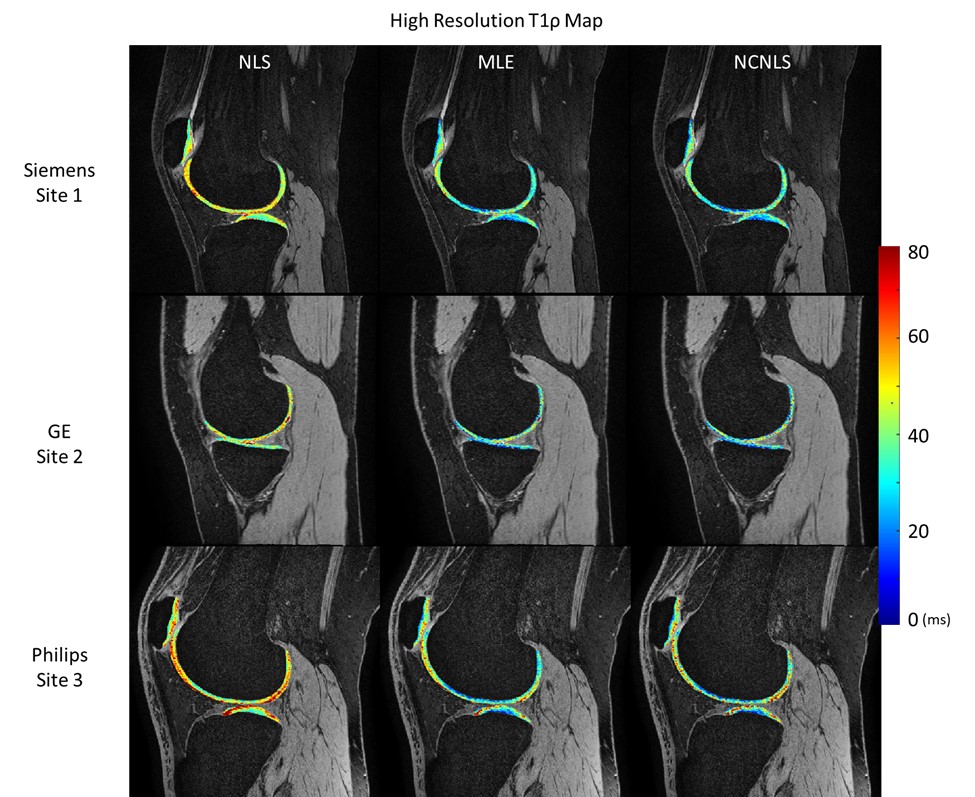
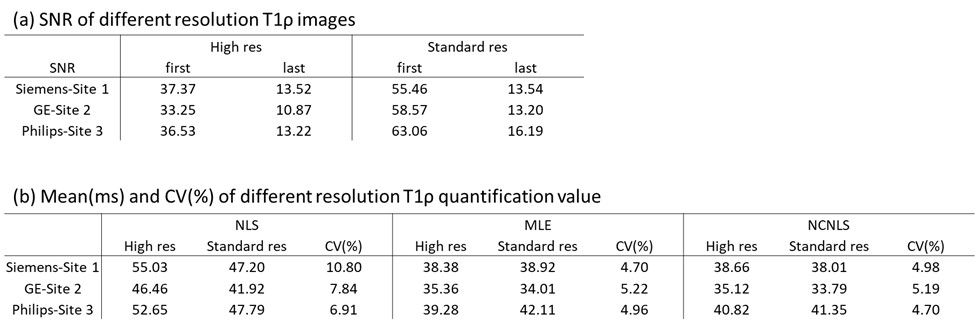
Phantom Results:The SNR of generated phantom images ranged 38-455. The NLS showed a large overestimation, while MLE showed a small overestimation and NCNLS showed a small underestimate when SNR was low (Figure 1). As the SNR increased, results from the three methods started to converge. The CV of the three methods was less than 0.2% when SNR was about 450.Human Results For all three sites, MLE and NCNLS generated consistent T1ρ values between high- and standard-resolution imaging with CVs < 5% (Table 2b). NLS had higher T1ρ values than MLE and NCNLS for both standard and high-resolution T1ρ imaging, especially for high-resolution due to the lower SNR of high-resolution imaging (Table 2). Example T1ρ maps are shown in Figures 2 and 3.
Discussion
In our previous simulation studies, NLS was shown to overestimate T1ρ while NCNLS and MLE provided robust T1ρ quantification when SNR was low3 . In this study, we tested the phantom data with a large SNR range to confirm our previous findings. The findings from the in vivo study were generally consistent with the phantom study. MLE and NCNLS generated consistent T1ρ values between high- and standard-resolution imaging with CVs < 5%, despite the low3 SNR in high-resolution imaging. The CV of 5% was comparable to previously reported scan-rescan repeatability of standard T1ρ imaging. Using NLS, the fitted T1ρ values of high-resolution imaging were significantly higher than those of standard-resolution imaging, due to the lower SNR in high-resolution imaging. The fitted T1ρ values from NLS were always higher than MLE and NCNLS, and the differences became larger with the high-resolution imaging due to decreased SNR. We will have volunteers travel to be scanned at all sites, which will allow us to compare the inter-site estimation in the future and further explore the adaptability and reproducibility of these fitting methods.Conclusion
With a multivendor multisite setting, we have demonstrated that MLE and NCNLS methods provide robust fitting for high-resolution T1ρ imaging with low SNR while NLS generates significant overestimate.Acknowledgements
The study was supported by NIH/NIAMS R01AR077452.References
1. MacKay JW, Low SBL, Smith TO, Toms AP, McCaskie AW, Gilbert FJ. Systematic review and meta-analysis of the reliability and discriminative validity of cartilage compositional MRI in knee osteoarthritis. Osteoarthritis Cartilage. 2018;26(9):1140-52.
2. Zhang Z, Kim J, Lartey R, Winalski C and Li X. Reliable high-resolution in vivo human knee T1ρ imaging quantification with robust fitting methods. ISMRM 2023.
3. Zhang Z, Kim J, Lartey R, Winalski CS Li, X. Single and Multi-channel evaluations of factors that affect cartilage T1ρ and T2 quantification. ISMRM 2022
4. Li X, Han ET, Busse RF, Majumdar S. In vivo T(1rho) mapping in cartilage using 3D magnetization-prepared angle-modulated partitioned k-space spoiled gradient echo snapshots (3D MAPSS). Magnetic resonance in medicine. 2008;59(2):298-307. Epub 2008/01/30.
5. Li X, Pedoia V, Kumar D, Rivoire J, Wyatt C, Lansdown D, et al. Cartilage T1rho and T2 relaxation times: longitudinal reproducibility and variations using different coils, MR systems and sites. Osteoarthritis and cartilage. 2015;23(12):2214-23. Epub 2015/07/19.
6. Gaj, S, Yang, M, Nakamura, K, Li, X. Automated cartilage and meniscus segmentation of knee MRI with conditional generative adversarial networks. Magn Reson Med. 2020; 84: 437–449.
7. Hardy PA, Andersen AH. Calculating T2 in images from a phased array receiver. Magn Reson Med. 2009 Apr;61(4):962-9.
8. Dietrich O, Raya JG, Reeder SB, Ingrisch M, Reiser MF, Schoenberg SO. Influence of multichannel combination, parallel imaging and other reconstruction techniques on MRI noise characteristics. Magn Reson Imaging. 2008 Jul;26(6):754-62. Epub 2008 Apr 28.
9.Raya JG, Dietrich O, Horng A, Weber J, Reiser MF, Glaser C. T2 measurement in articular cartilage: impact of the fitting method on accuracy and precision at low SNR. Magn Reson Med. 2010 Jan;63(1):181-93.
Figures