2250
In Vivo Reproducibility of T2 and T1rho Relaxation Times in Multiple Coils and Sequences1Radiology, Stanford University, Stanford, CA, United States
Synopsis
Keywords: Osteoarthritis, Cartilage, Reproducibility, coils
Motivation: T2 and T1rho reproducibility is essential for evaluating the small changes that occur during early osteoarthritis that are predictive of disease progression.
Goal(s): To evaluate the reproducibility of T2 and T1rho relaxation times in multiple coils and with multiple imaging sequences.
Approach: We studied the reproducibility of T1rho and T2 relaxation times with a MAPSS and qDESS sequence in a Transmit-Receive knee coil and two different flexible extremity coil arrays.
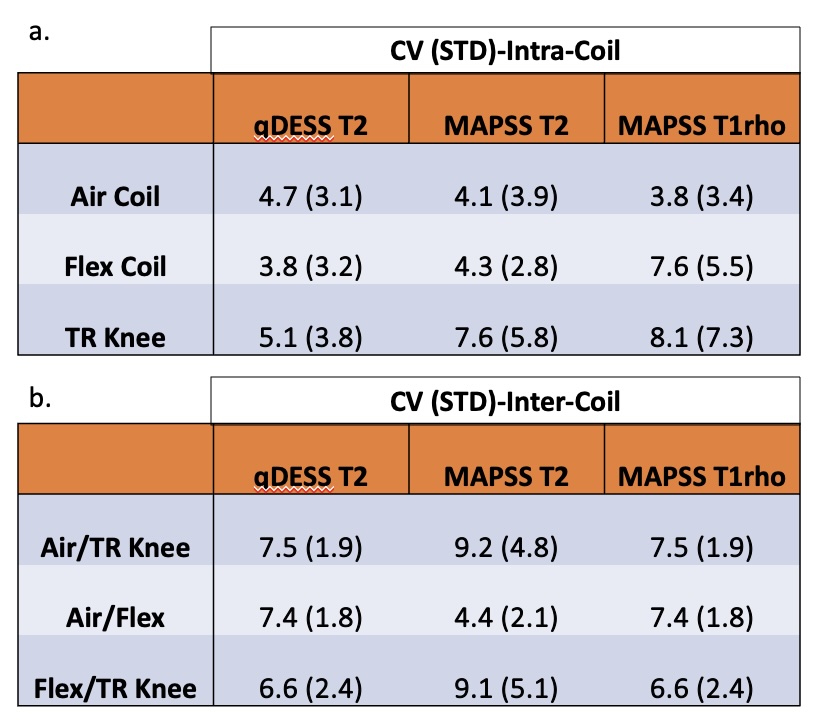
Results: Intra-coil CVs of less than 5% (QIBA Goal) in qDESS T2 measurements with all coils tested, MAPSS T2 measurements with both flexible-coil-arrays and MAPSS T1rho measurements only with the Air coil.
Impact: Preliminary findings suggest that flexible, receive-only coil arrays show similar or improved reproducibility for evaluating cartilage T2 and T1rho relaxation times compared to standard T/R knee coils.
Introduction
T2 and T1rho relaxation times are widely used to study early microstructural changes in cartilage, which is predictive of knee osteoarthritis (OA) progression1-3. Due to the relatively small changes (a few ms) in relaxation values in early disease4,5, methods to measure T2 and T1rho relaxation must have high reproducibility to be sensitive to these early changes. The QIBA MSK initiative aims to develop a common quantitative imaging protocol (based on MAPSS)6 and assess its repeatability across sites, vendors, and systems. However, it is focused on a single acquisition sequence using a transmit/receive coil array. In this work, we evaluate the reproducibility of QIBA sequences as well as another T2 mapping approach across various coils within the same scanner. A previous study demonstrated that flex coils produced significantly higher T2 and T1rho values in both phantoms and in-vivo7, while another study showed intra-coil variation for a knee coil over time to have coefficients of variation (CV) of 2.1-5.5%8. This variation in T2 and T1rho is important to consider in early disease detection.Methods
All scanning was performed on a 3T whole body scanner (GE Signa Premier) using a transmit and receive 18-channel knee coil (QED), a receive only 16-channel Medium Flexible Coil array (NeoCoil), and a 20-channel medium Multi-Purpose (MP) AIR coil-array (GE Healthcare). Three healthy subjects (3F) completed the study. In-vivo data was collected on a baseline day and repeated in a separate session within 7 days. The MRI protocol for the scan was repeated for each coil per scanning session. A 3D T2 and T1rho MAPSS and a quantitative double-echo in steady-state (qDESS) sequence were acquired with each coil. T2 and T1rho relaxation maps were computed from T2 and T1rho-prepared MAPSS images using a mono-exponential fit. T2 maps were computed from qDESS images using an extended-phase-graph (EPG) Signal model9. QDESS images were registered to MAPSS images using Elastix software in DOSMA10.The femoral, patellar, and tibial cartilage were automatically segmented from qDESS images using DOSMA open-source software and applied to all registered quantitative maps. T2 and T1rho values were determined for the medial posterior, medial central, lateral central, posterior central, and trochlear regions of the femoral cartilage, the patella, and the medial and lateral tibial cartilage. Intra- and Inter-coil Coefficients of Variation (CVs) were calculated for each imaging sequence.Results
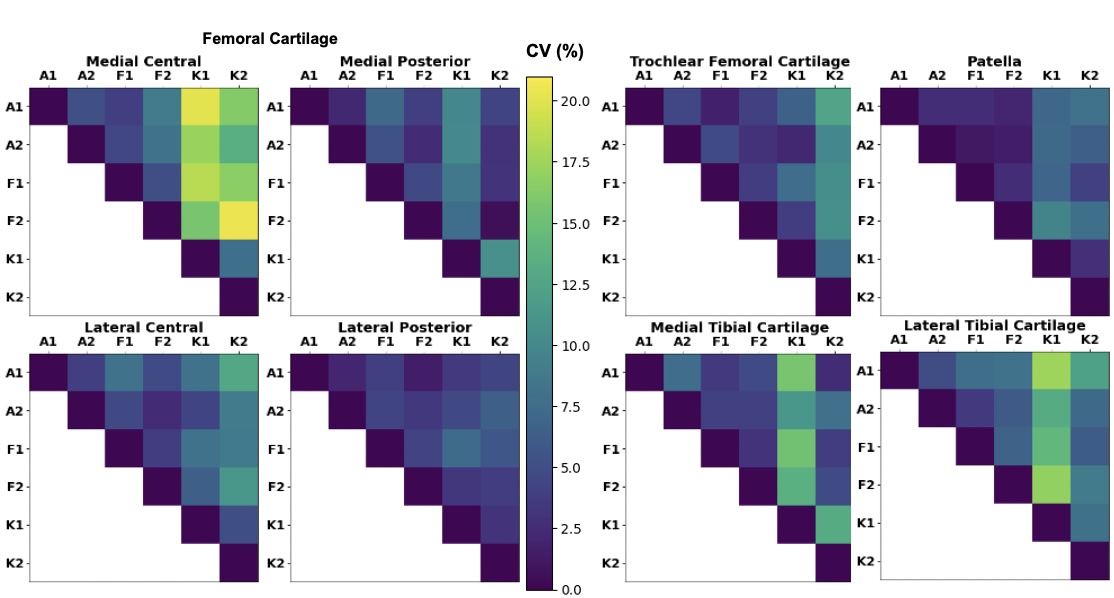
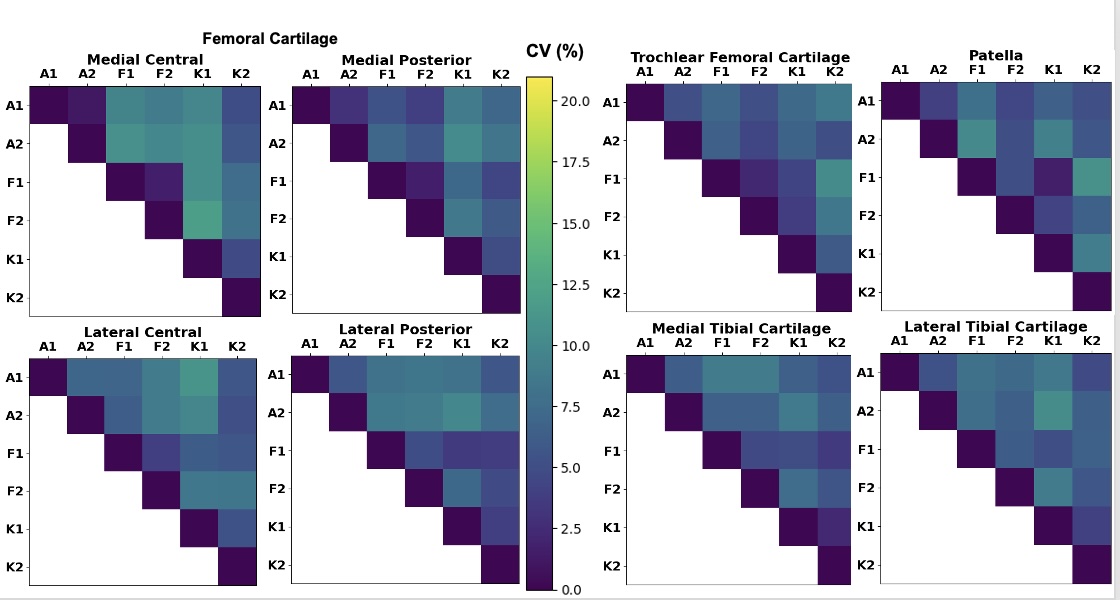
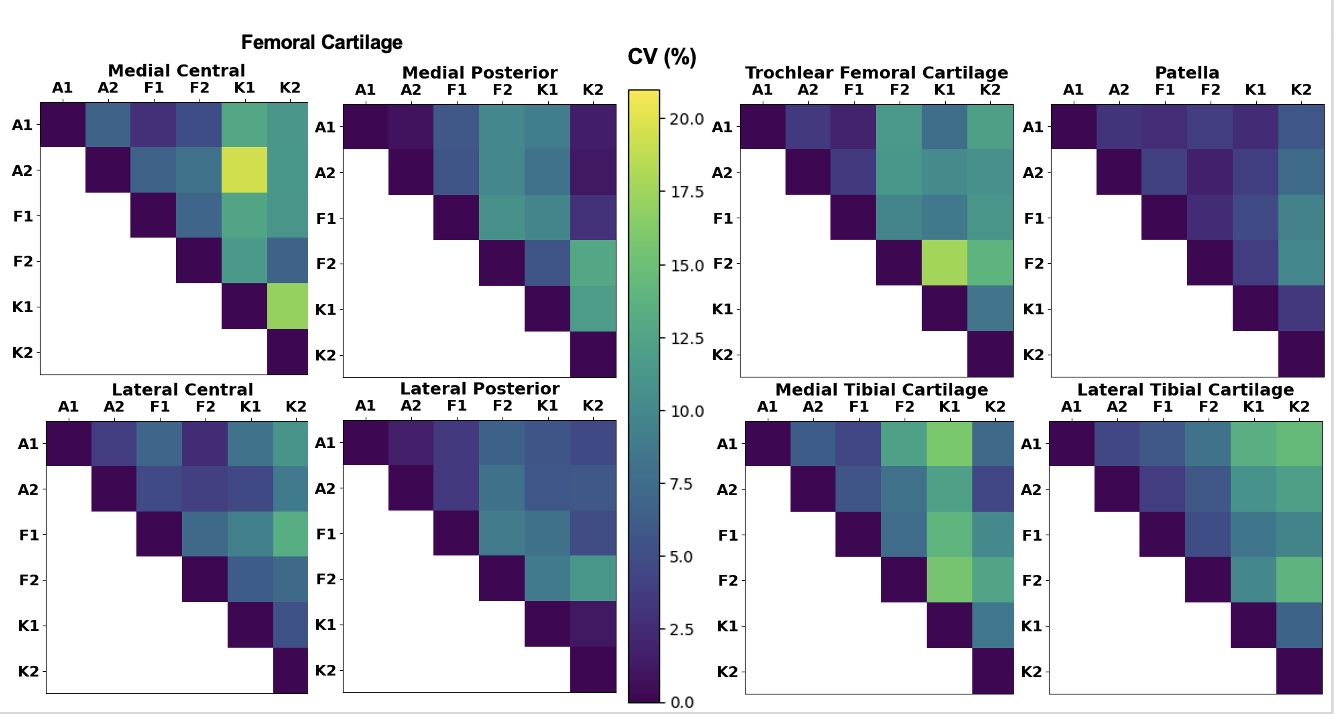
5/144 knee regions on T2 MAPSS (2 Flex Coil, 3 TR knee Coil) and 6/144 knee regions on T1rho MAPSS (3 Flex Coil, 3 TR Knee Coil) were removed from analysis due to poor fits. Across all regions, the intra-coil CV between repeated scans was slightly higher for T/R knee compared to the air and flex coils in T2 and T1rho derived from MAPSS and T2 derived from qDESS (Table 2a). The mean CV for each coil and sequence in each knee region is shown in Table 2b. Quantitative measurements between coils (both within sessions and across sessions) showed slightly lower reproducibility compared to intra-coil repeatability. Visual comparison of CV between coils and timepoints for MAPSS T2, qDESS T2, and MAPSS T1rho are shown in Figures 1, 2, and 3, respectively.Discussion
Our preliminary findings show intra-coil CVs of less than 5% (The goal of the QIBA MSK Profile) in qDESS T2 measurements with all three coils tested, MAPSS T2 measurements with the 16Ch Flex Coil, and 20Ch MP AIR Coil and MAPSS T1rho measurements only with the MP AIR Coil. This may be due to improved SNR of the knee with these coils that can be wrapped tightly around the knee compared to the rigid T/R knee coil, but further analysis of SNR is needed to evaluate this. qDESS T2 measurements across all coils demonstrated lower CV than MAPSS T2 across all coils despite being acquired with 2x higher phase resolution and more than 2x faster. Inter-coil comparisons showed CVs that were in line with or better than previous inter-site and inter-vendor reproducibility11, but lower than intra-coil comparisons. SAR was not an issue in any acquisitions, including T1rho-prepared MAPSS, which is a common concern for using receive-only coils. Future work will continue to evaluate these measures in more subjects as well as add image SNR data to the analysis.Conclusion
Preliminary findings suggest that flexible, receive-only coil arrays show similar or improved reproducibility for evaluating cartilage T2 and T1rho relaxation times compared to standard T/R knee coils. Ongoing QIBA evaluation for these reproducibility measures across sites, vendors, and systems is critical to understanding the limits and utility of these methods.Acknowledgements
We thank Drs. Li and Link for their leadership of the QIBA MSK Biomarker Committee. This work was supported by research funding from GE Healthcare.References
1.Prasad, A. P., Nardo, L., Schooler, J., Joseph, G. B., & Link, T. M. (2013). T₁ρ and T₂ relaxation times predict progression of knee osteoarthritis. Osteoarthritis and cartilage, 21(1), 69–76. https://doi.org/10.1016/j.joca.2012.09.011.
2.Liebl H, Joseph G, Nevitt MC, et al. Early T2 changes predict onset of radiographic knee osteoarthritis: data from the osteoarthritis initiative. Ann Rheum Dis. 2015;74(7):1353–LP-1359. http://dx.doi.org/10.1136/annrheumdis-2013-204157.
3.Baum T, Joseph GB, Karampinos DC, Jungmann PM, Link TM, Bauer JS. Cartilage and meniscal T2 relaxation time as non-invasive biomarker for knee osteoarthritis and cartilage repair procedures. Osteoarthr Cartil. 2013;21(10):1474–84. https://doi.org/10.1016/J.JOCA.2013.07.012.
4.Kretzschmar, M., Nevitt, M. C., Schwaiger, B. J., Joseph, G. B., McCulloch, C. E., & Link, T. M. (2019). Spatial distribution and temporal progression of T2 relaxation time values in knee cartilage prior to the onset of cartilage lesions - data from the Osteoarthritis Initiative (OAI). Osteoarthritis and cartilage, 27(5), 737–745. https://doi.org/10.1016/j.joca.2018.10.016.
5.Li, X., Benjamin Ma, C., Link, T. M., Castillo, D. D., Blumenkrantz, G., Lozano, J., Carballido-Gamio, J., Ries, M., & Majumdar, S. (2007). In vivo T(1rho) and T(2) mapping of articular cartilage in osteoarthritis of the knee using 3 T MRI. Osteoarthritis and cartilage, 15(7), 789–797. https://doi.org/10.1016/j.joca.2007.01.011.
6.Li, X., Wyatt, C., Rivoire, J., Han, E., Chen, W., Schooler, J., Liang, F., Shet, K., Souza, R., & Majumdar, S. (2014). Simultaneous acquisition of T1ρ and T2 quantification in knee cartilage: repeatability and diurnal variation. Journal of magnetic resonance imaging : JMRI, 39(5), 1287–1293. https://doi.org/10.1002/jmri.24253.
7.X. Li, V. Pedoia, D. Kumar, J. Rivoire, C. Wyatt, D. Lansdown, K. Amano, N. Okazaki, D. Savic, M.F. Koff, J. Felmlee, S.L. Williams, S. Majumdar, Cartilage T1ρ and T2 relaxation times: longitudinal reproducibility and variations using different coils, MR systems and sites, Osteoarthritis and Cartilage. Volume 23, Issue 12, 2015, Pages 2214-2223, ISSN 1063-4584. https://doi.org/10.1016/j.joca.2015.07.006.
8.E. Schneider, M. NessAiver. The Osteoarthritis Initiative (OAI) magnetic resonance imaging quality assurance update, Osteoarthritis and Cartilage. Volume 21, Issue 1, 2013. Pages 110-116. ISSN 1063-4584. https://doi.org/10.1016/j.joca.2012.10.011.
9.Sveinsson B, Chaudhari AS, Gold GE, Hargreaves BA. A simple analytic method for estimating T2 in the knee from DESS. Magn Reson Imaging. 2017 May;38:63-70. doi: 10.1016/j.mri.2016.12.018. Epub 2016 Dec 23. PMID: 28017730; PMCID: PMC5360502.
10.Guan B, Liu F, Mizaian AH, Demehri S, Samsonov A, Guermazi A, Kijowski R. Deep learning approach to predict pain progression in knee osteoarthritis. Skeletal Radiol. 2022 Feb;51(2):363-373. doi: 10.1007/s00256-021-03773-0. Epub 2021 Apr 9. PMID: 33835240; PMCID: PMC9232386.
11.Kim J, Mamoto K, Lartey R, Xu K, Nakamura K, Shin W, Winalski CS, Obuchowski N, Tanaka M, Bahroos E, Link TM, Hardy PA, Peng Q, Reddy R, Botto-van Bemden A, Liu K, Peters RD, Wu C, Li X. Multi-vendor multi-site T1ρ and T2 quantification of knee cartilage. Osteoarthritis Cartilage. 2020 Dec;28(12):1539-1550. doi: 10.1016/j.joca.2020.07.005. Epub 2020 Jul 30. PMID: 32739341; PMCID: PMC8094841.
Figures
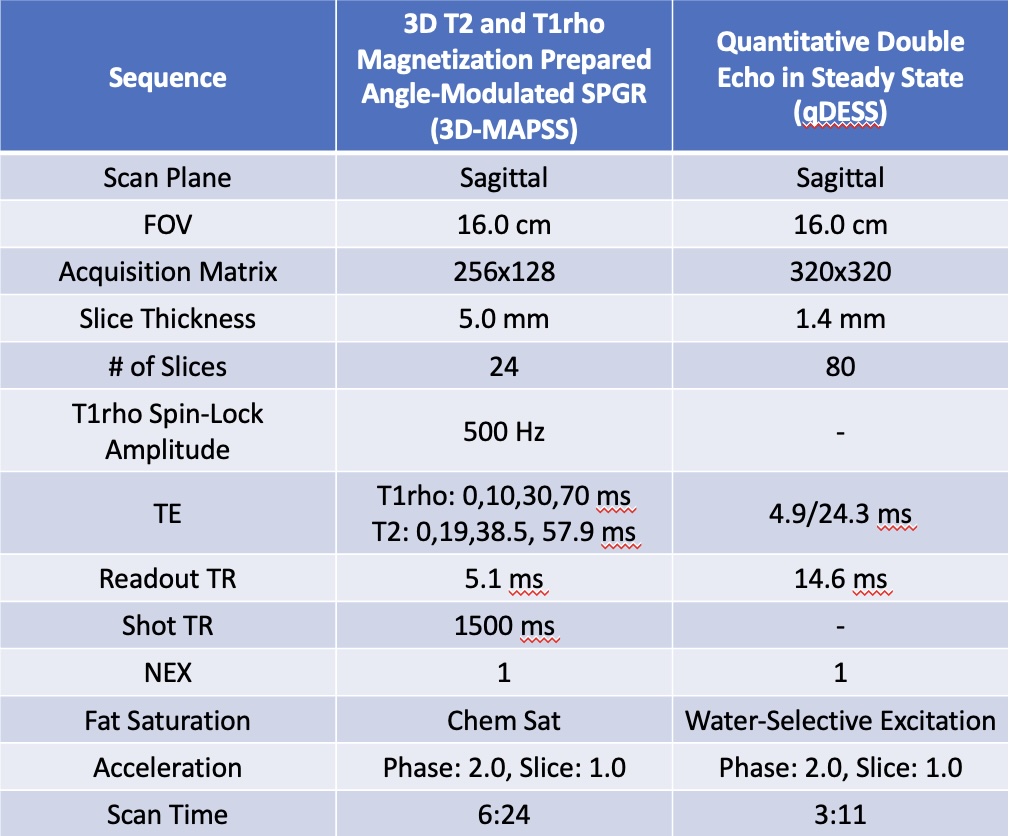
Figure 1. Imaging parameters