2249
Automated pipeline for creating personalized biomechanical knee models and computing personalized cartilage pressures during gait1Department of Mechanical Engineering, Stanford University, Stanford, CA, United States, 2School of Human Kinetics, University of Ottawa, Ottawa, ON, Canada, 3Department of Bioengineering, Stanford University, Stanford, CA, United States, 4Department of Orthopedics and Traumatology, University Hospital Basel, Basel, Switzerland, 5Department of Radiology, Stanford University, Stanford, CA, United States
Synopsis
Keywords: Whole Joint, Cartilage, Cartilage, Biomechanics, Bone, Segmentation, Personalized
Motivation: Automated analysis of MRI and biomechanics data can provide personalized information about cartilage pressures.
Goal(s): Our goal was to develop an automated pipeline to create a personalized biomechanical knee joint model from MRI data, to simulate personalized knee mechanics during gait in comparison to knee mechanics of a generic knee joint geometry.
Approach: Bone and cartilage geometry was automatically segmented from knee MRI scans via deep learning. Gait simulations were performed on musculoskeletal models with personalized and generic knee models.
Results: Personalizing knee joint geometries affected cartilage pressure distributions in the joint but maintained peak cartilage pressures and contact forces.
Impact: Biomechanical models personalized with MRI data enable understanding of how bone geometry influences cartilage pressures during gait, which may lead to better tailoring and evaluation of interventions.
Introduction
Biomechanical variables such as the knee adduction moment are prognostic for osteoarthritis (OA) progression, but these variables simply estimate whole joint loading and cannot precisely determine localized cartilage pressures. Previous work has used generic bone and cartilage shapes to simulate cartilage pressures, ligament forces, and joint contact forces using a musculoskeletal model with cartilage contact1. Systematically varied bone shapes affected simulated joint loading patterns, which may influence disorders related to joint loading, such as knee OA2. This suggests personalizing knee joint models may help understand the role of subject-specific joint loading patterns in disease pathophysiology.Deep learning (DL) has enabled automated segmentation of bones and cartilage from knee MRIs. These automated segmentations provide highly accurate cartilage and bone segmentations with sensitivity to change comparable to expert manual segmenters3. However, it is unknown how subject-specific knee geometries obtained from automated DL-based knee MRI segmentation affect simulated cartilage pressures and joint contact forces; personalized simulation of cartilage pressures has the potential to provide important insights into the pathophysiology of conditions like knee OA.
The purpose of this work was to develop an automated MRI pipeline to create a personalized biomechanical knee joint model for simulating personalized knee mechanics during gait. We compare the resulting mechanics between personalized and generic knee joint geometries to evaluate the efficacy of biomechanical personalization.
Methods
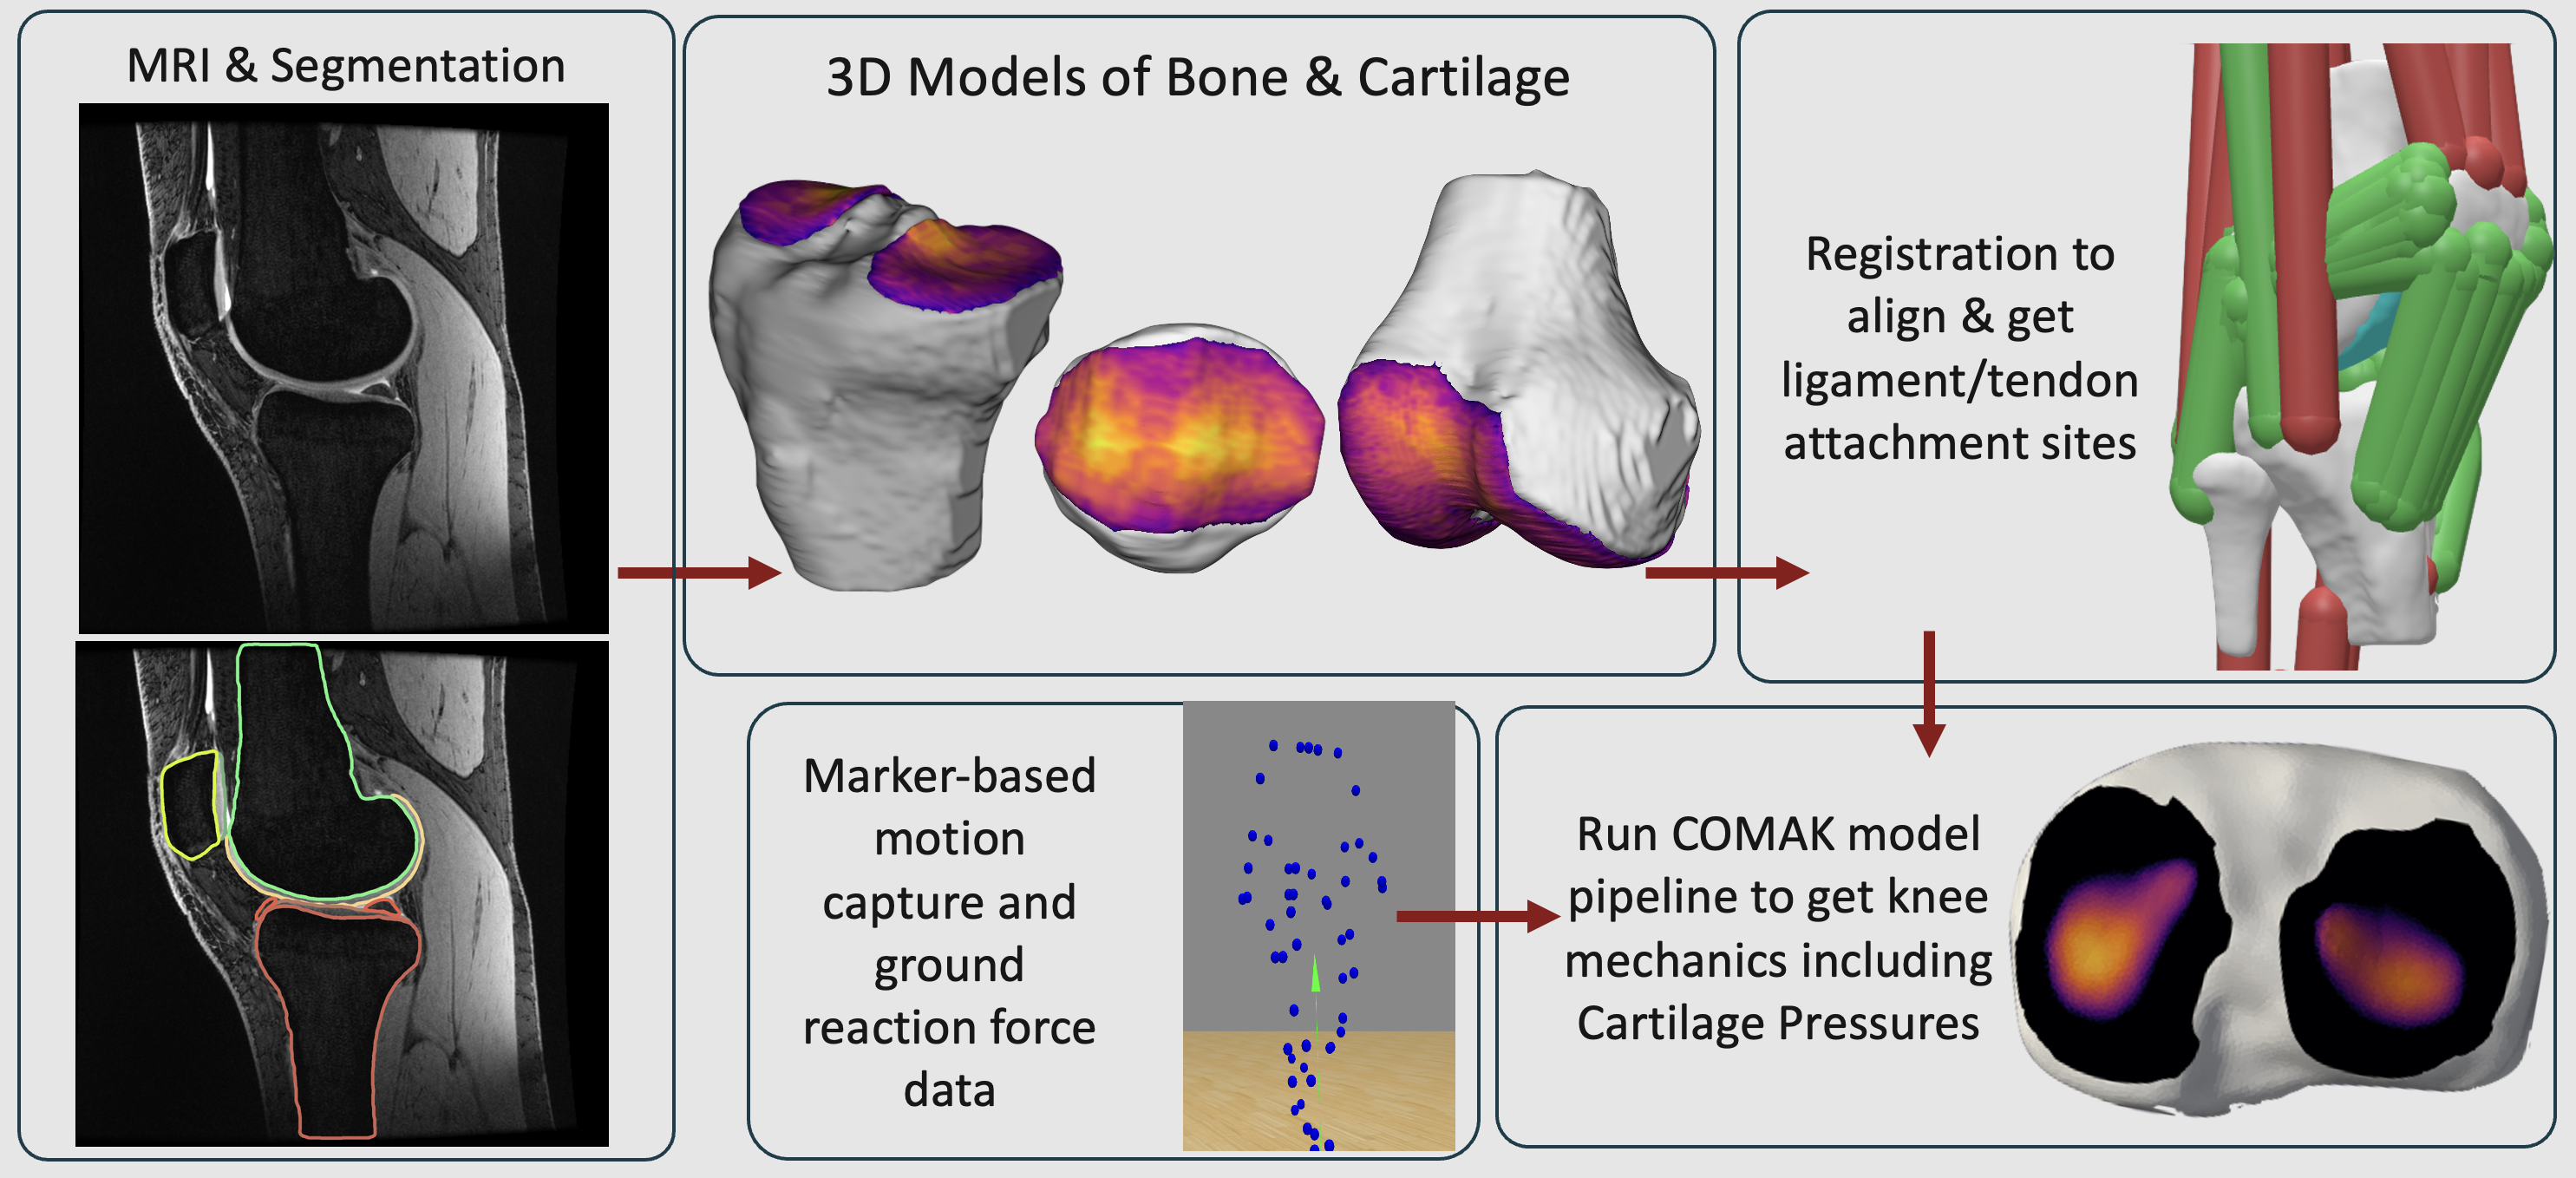
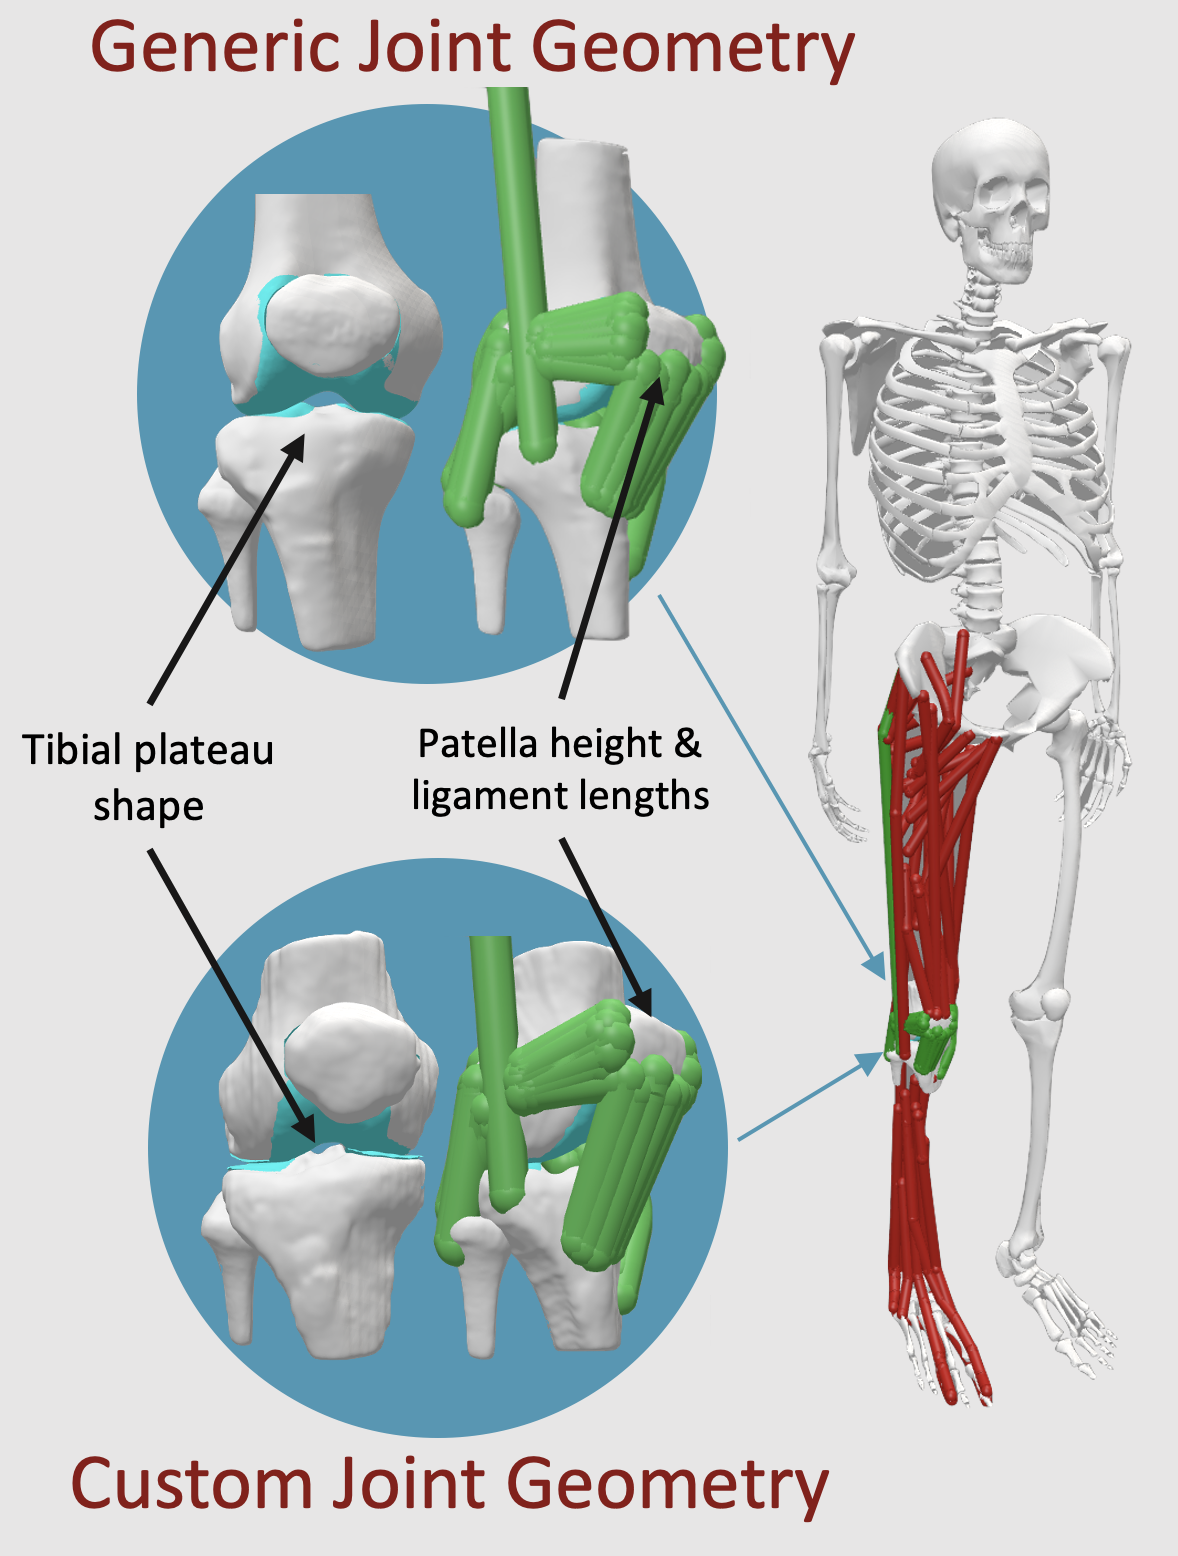
Bilateral quantitative double-echo steady state (qDESS) scans were collected for a single healthy subject (F, height = 1.69 m, weight = 63.5 kg) using 16-channel flexible receive coils on a GE SIGNA Premier (TE1/TE2: 6.4/34.24ms; TR: 20.3ms; slice thickness: 1.4mm; in-plane resolution: 0.31×0.38 mm). Laboratory-based motion capture (Motion Analysis Corp.) and ground reaction force (Bertec Corp.) data were collected from the same subject during normal/overground gait. The right tibial, femoral, and patellar bones and cartilage were automatically segmented from a qDESS MRI scan using an open-source deep-learning model4. The Python Musculoskeletal Toolkit (www.github.com/gattia/pymskt) library was used to create 3D bone and cartilage surface meshes from the segmentations and to identify ligament and tendon attachment sites using a registration-based approach2.AddBiomechanics was used to automatically scale the generic musculoskeletal model and its associated bone and cartilage geometries to the subject, producing the generic knee joint model5. The knee joint in the scaled generic musculoskeletal model was then replaced with the personalized bone and cartilage geometries determined from MRI data, producing the personalized knee joint model.
Using the collected gait data, the Concurrent Optimization of Muscle Activations and Secondary Kinematics (COMAK) pipeline was used to simulate knee contact forces and cartilage pressures6. Standardized simulations were used to determine personalized joint alignment and ligament and tendon lengths. The COMAK optimization pipeline was then performed to compute muscle and ligament forces and cartilage pressures. Simulations were run separately for musculoskeletal models with the generic and personalized knee joint geometries to evaluate cartilage pressures and contact forces.
Results
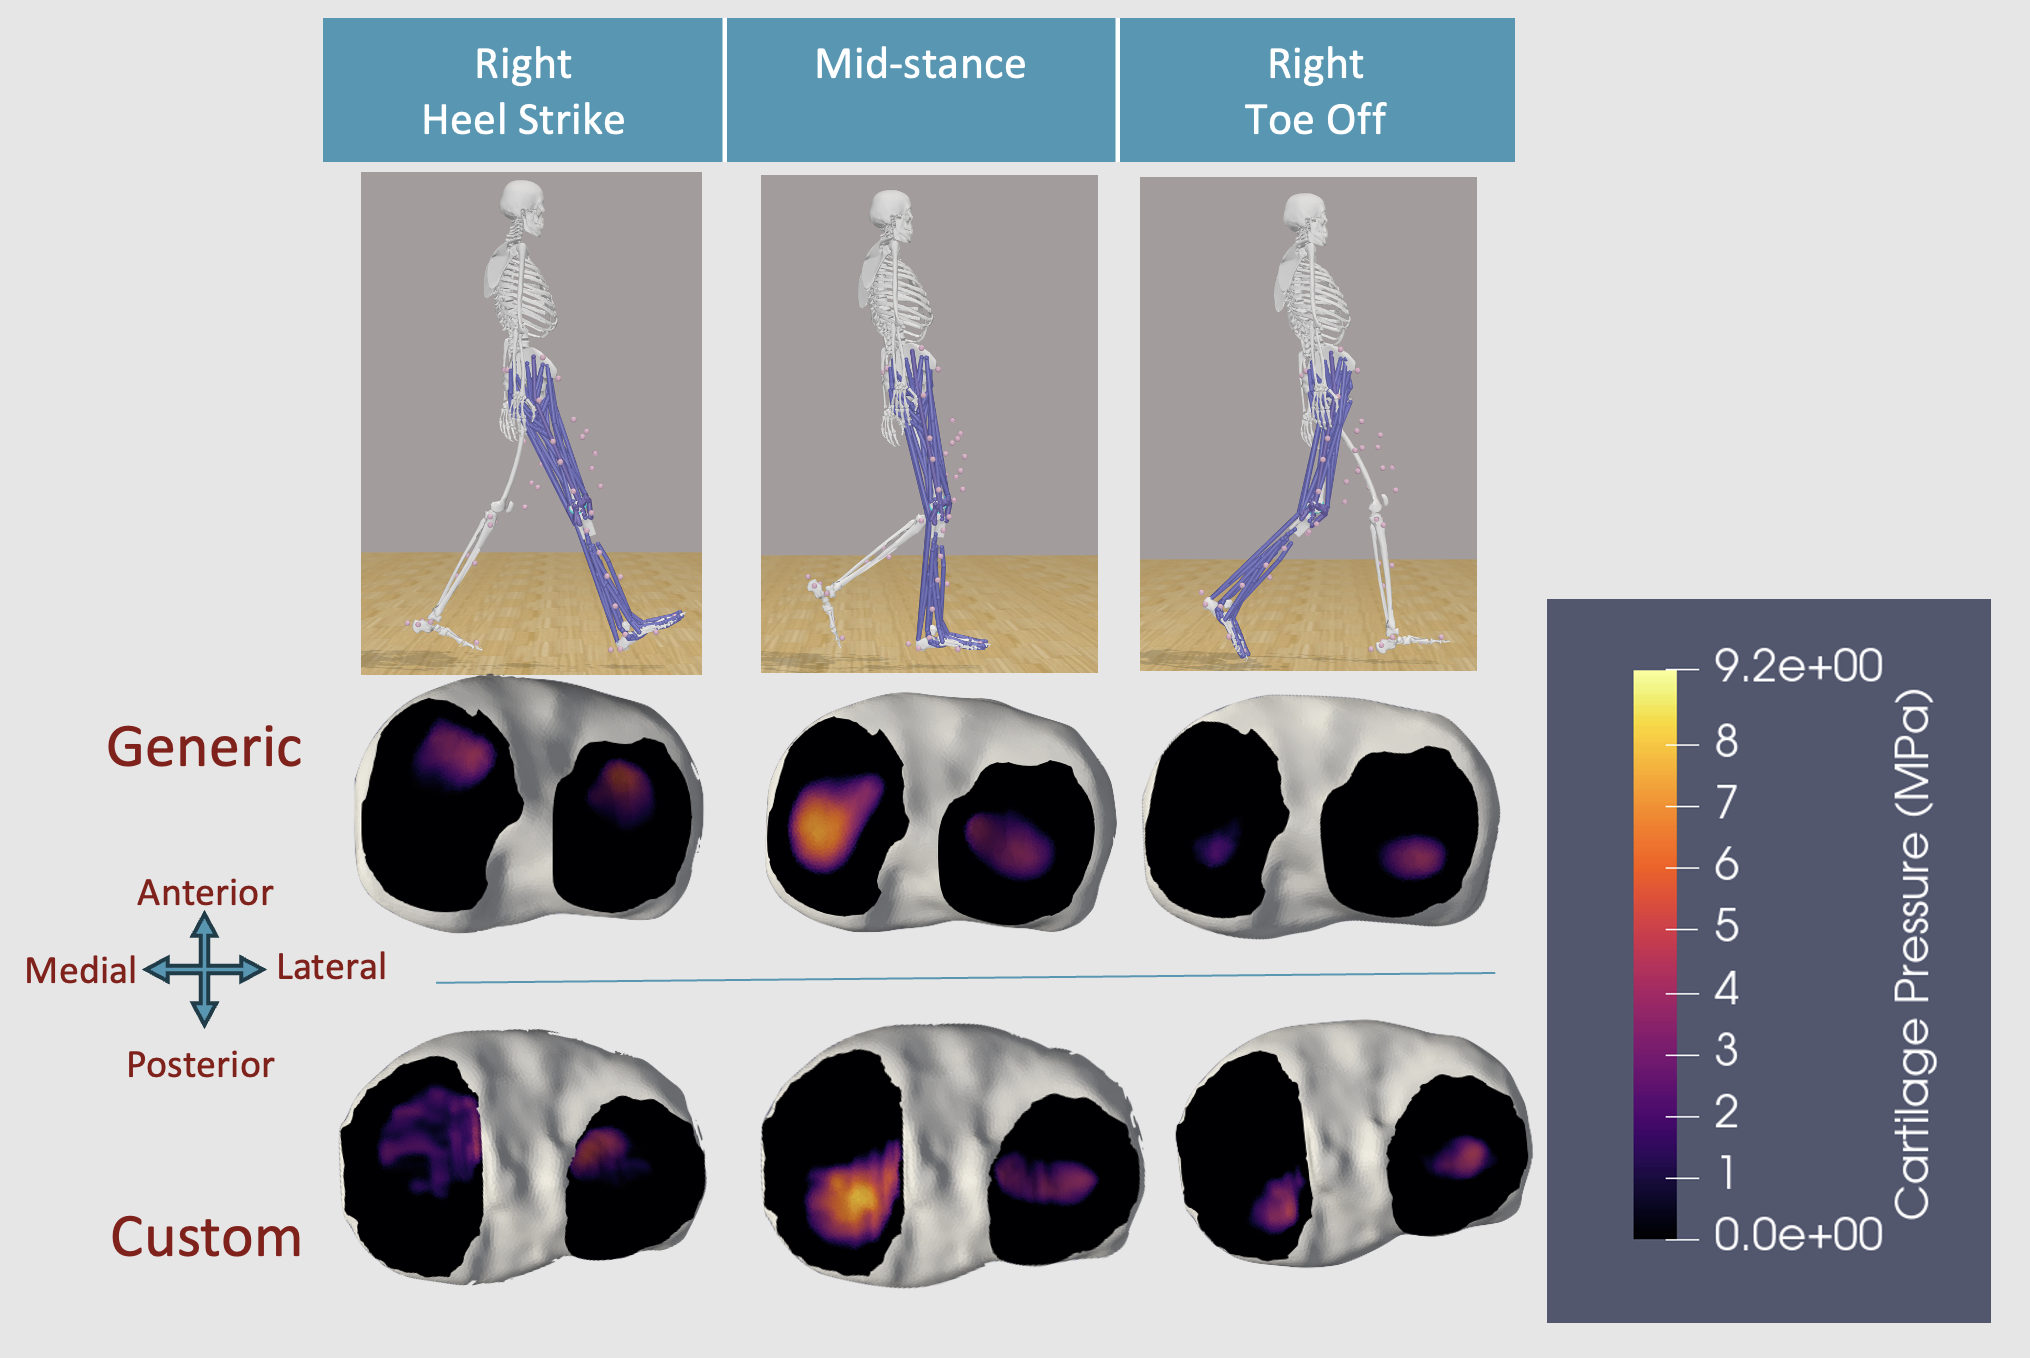
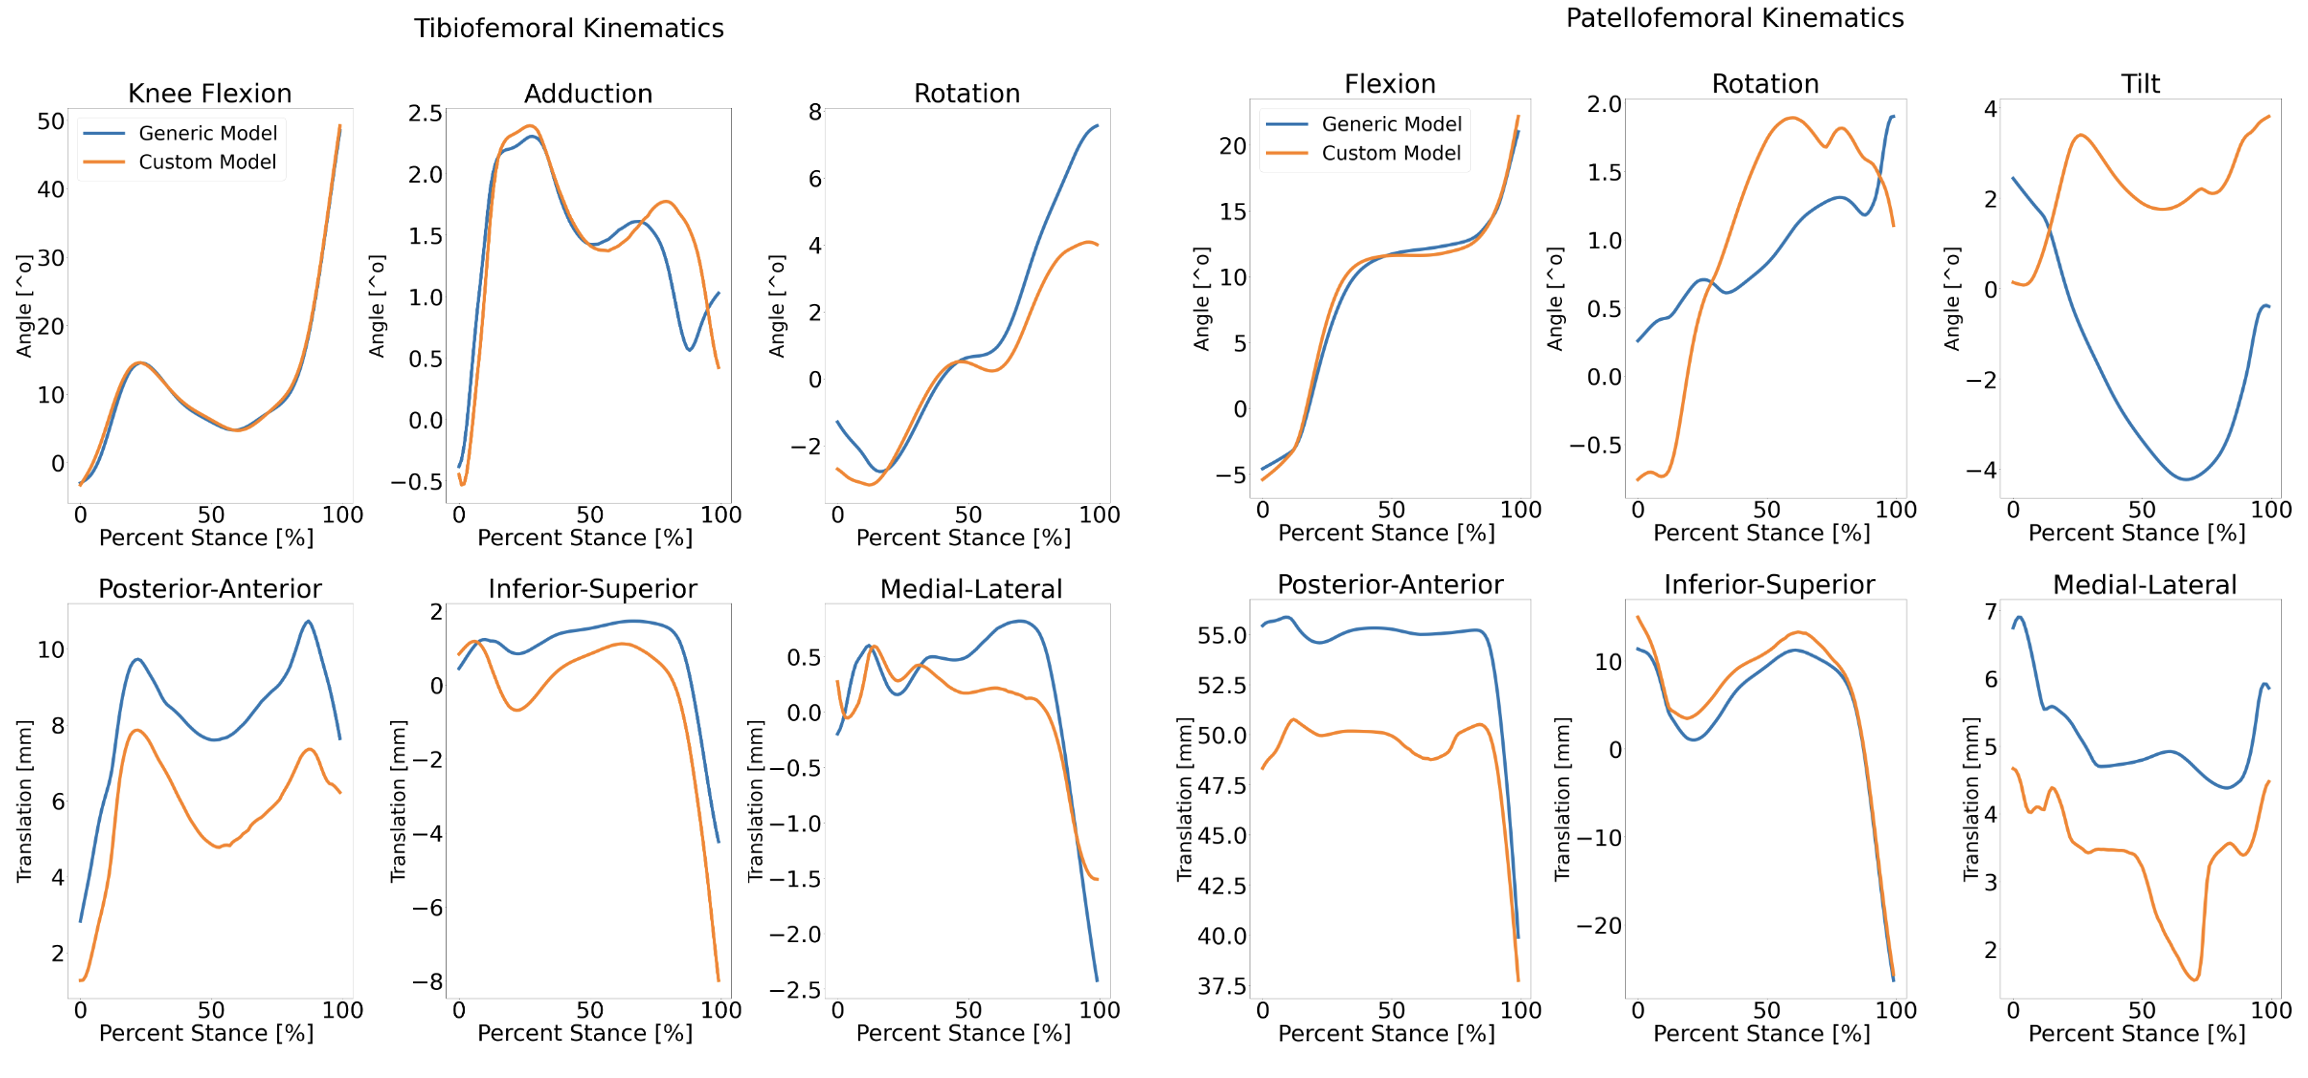
The specific cartilage pressures in the personalized model were more concentrated on the posterior medial tibial plateau compared to the generic knee joint model (Fig 3). The peak contact forces and peak cartilage pressures between the two knee models were similar (custom: 9.2 MPa, 2.53 kN; generic: 8.9 MPa, 2.75 kN). Additionally, the arthrokinematics (relative motion of bone surfaces) differed between the generic and personalized geometries (Fig 4). Tibiofemoral kinematics differed up to 6 mm in translation and 4° in rotation. Patellofemoral kinematics differed up to 6 mm in translation and 6° in rotation.Discussion
This automated MRI-based segmentation pipeline created a personalized knee joint model and simulated cartilage pressures during gait. The personalized knee joint model did not change gross biomechanics, as expected. However, in the healthy subject, there were small but notable differences in the distribution and location of pressures, highlighting that even within healthy states personalized geometry affects in vivo cartilage pressures. The resulting pressures and contact forces are similar in magnitude to previous studies2,6. The tools used for this analysis were all open-source. While personalization changed the distribution of pressures, no work has validated whether these pressures are valid. Future work will validate our pipeline using an experimental MRI-based protocol that measures cartilage deformation induced by walking.Conclusion
Automated analysis of MRI and biomechanics data has the potential to unlock novel insights into cartilage mechanics in subjects with or at risk for musculoskeletal conditions such as knee OA.Acknowledgements
Research supported by NIH R01 AR077604, R01 EB002524, R01 AR079431, P41 EB027060, GE Healthcare, Wu Tsai Human Performance Alliance, CIHR Postdoctoral Fellowship.References
1. Lenhart RL, Kaiser J, Smith CR, Thelen DG. Prediction and Validation of Load-Dependent Behavior of the Tibiofemoral and Patellofemoral Joints During Movement. Ann Biomed Eng. 2015;43(11):2675-85. doi: 10.1007/s10439-015-1326-3.
2. Clouthier, AL, Smith, CR, Vignos, MF, et al. The effect of articular geometry features identified using statistical shape modelling on knee biomechanics. Mechanical Engineering & Physics, 2019;66:47-55. https://doi.org/10.1016/j.medengphy.2019.02.009.
3. Eckstein, F., Chaudhari, A.S., Fuerst, D., Gaisberger, M., Kemnitz, J., Baumgartner, C.F., Konukoglu, E., Hunter, D.J. and Wirth, W. Detection of Differences in Longitudinal Cartilage Thickness Loss Using a Deep-Learning Automated Segmentation Algorithm: Data From the Foundation for the National Institutes of Health Biomarkers Study of the Osteoarthritis Initiative. Arthritis Care Res, 2022;74: 929-936. doi: 10.1002/acr.24539
4. Desai, AD, Barbieri, M, Mazzoli, V, et. al. DOSMA: A deep-learning, open-source framework for musculoskeletal MRI analysis. Proc. Intl. Soc. Mag. Reson. Med. 27 (2019). Montreal, Canada.
5. Werling K, Bianco NA, Raitor M, Stingel J, Hicks JL, Collins SH, Delp SL, Liu CK. AddBiomechanics: Automating model scaling, inverse kinematics, and inverse dynamics from human motion data through sequential optimization. bioRxiv [Preprint]. 2023;06.15.545116. doi: 10.1101/2023.06.15.545116.
6. Colin R. Smith, Kwang Won Choi, Dan Negrut & Darryl G. Thelen (2018) Efficient computation of cartilage contact pressures within dynamic simulations of movement, Computer Methods in Biomechanics and Biomedical Engineering: Imaging & Visualization, 6:5, 491-498, doi: 10.1080/21681163.2016.1172346
Figures