2236
Prospective Quality Metric Assessment of SyntheticCT Images via a Learnable Framework1GE HealthCare, Munich, Germany, 2University of Zurich, Zurich, Switzerland, 3GE HealthCare, Bangalore, India
Synopsis
Keywords: Other AI/ML, Data Analysis, Predictive deep learning, MLOps
Motivation: Prospective quality assessment of synthetic CT images by predicting an accuracy metric. Such a score can be an indication of confidence of model prediction or be used as a feedback for performance of the model.
Goal(s): Prediction of mean absolute value of synthetic CT image without a reference CT image
Approach: A deep learning framework which is trained to predict MAE metric of a given image.
Results: The proposed QMetNet model learns to predict the MAE metric on unseen data in a reliable manner without a reference image.
Impact: This novel framework makes it possible to train models to predict a choice of metrics as suitable for different applications. It could be a potential solution to provide confidence of prediction of a model to ease adoption of AI solutions.
Introduction
Generation of synthetic CT (sCT [HU]) from MR images is of interest for applications such as MR-only radiation therapy (RT) planning and PET/MR attenuation-correction (AC) which depend on quantitative accuracy of the generated sCT images. Different solutions proposed for this problem use various image contrasts [1,2]. Accuracy of the synthesized image can be assessed using qualitative metrics such as peak signal-to-noise ratio (PSNR) or structural similarity index (SSIM), and quantitative accuracy metrics such as mean absolute error (MAE) or mean squared error (MSE). However, computation of these metrics requires a co-registered reference CT image. In the clinical use of a deployed AI solution, the reference image is often unavailable to assess the quality of the output and the performance of sCT conversion for a given model, will differ depending on the quality of the input MR images and its variation from the data included in the training set. In this work, we propose a novel method to prospectively assess accuracy of the sCT image generated from a DL model using a secondary quality metric assessment model (QMetNet). We demonstrate the ability of this model to reliably predict the metric value on a variety of images from mixed anatomical regions.Methods and Materials
Patient data: A set of 465 MR images with corresponding CT was randomly extracted from previously published studies [3,4,5,6] to represent pelvis, brain, head & neck, and shoulder anatomies. The ZTE, T2w CUBE, and Dixon LAVA-Flex MR images were acquired at five different clinical sites on different MRI scanners from GE HealthCare, Chicago, IL, USA. CT to MR registration: Each MR image was registered separately to the patient’s CT image using a combination of rigid and diffeomorphic dense registration algorithms developed in ITK [7]. All MR images were co-registered to the CT image for comparison of each sCT in a normalized geometric space. Deep learning based sCT computation: A 2D supervised multi-task CNN in a UNet like architecture as described in [6] was used to generate sCT images for the different anatomy regions. Multiple DL models were trained to generate sCT from ZTE, T2w, and LAVA-Flex images [8]. sCT quality assessment (QMetNet): The MAE metric for the sCT images generated from different DL models was computed using the corresponding reference CT image. A cohort of various sCT images and their corresponding MAE scores was divided into training, validation, and held-out test sets. A combined 2D convolutional and fully connected neural network adapted to scalar regression architecture (QMetNet) was employed to learn the quality metric of interest. The MAE of input sCT images from the test set was predicted using the trained QMetNet model.Results & Discussion
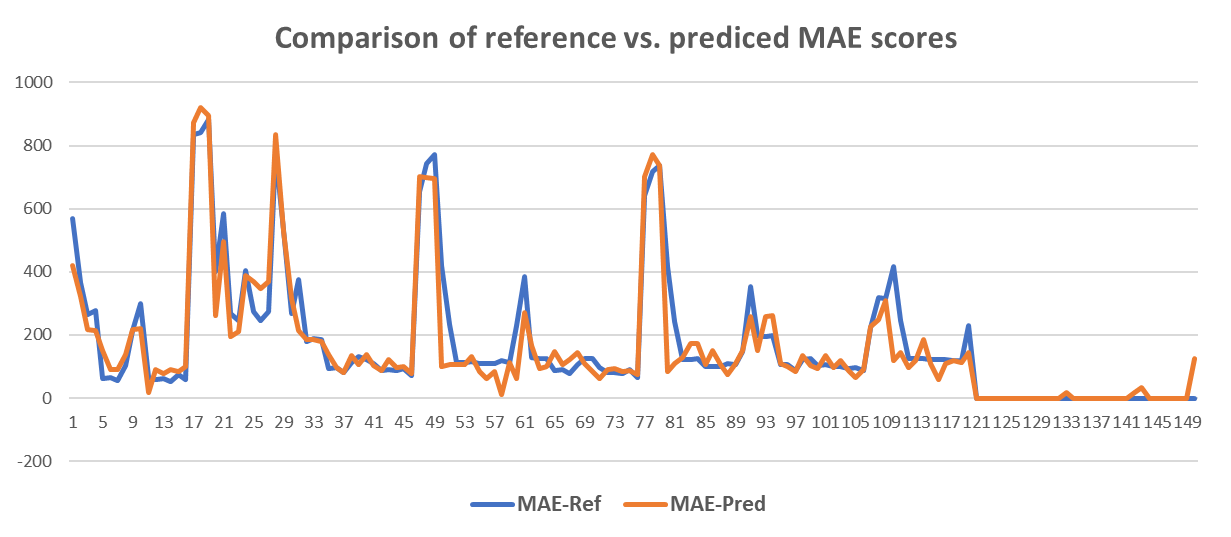
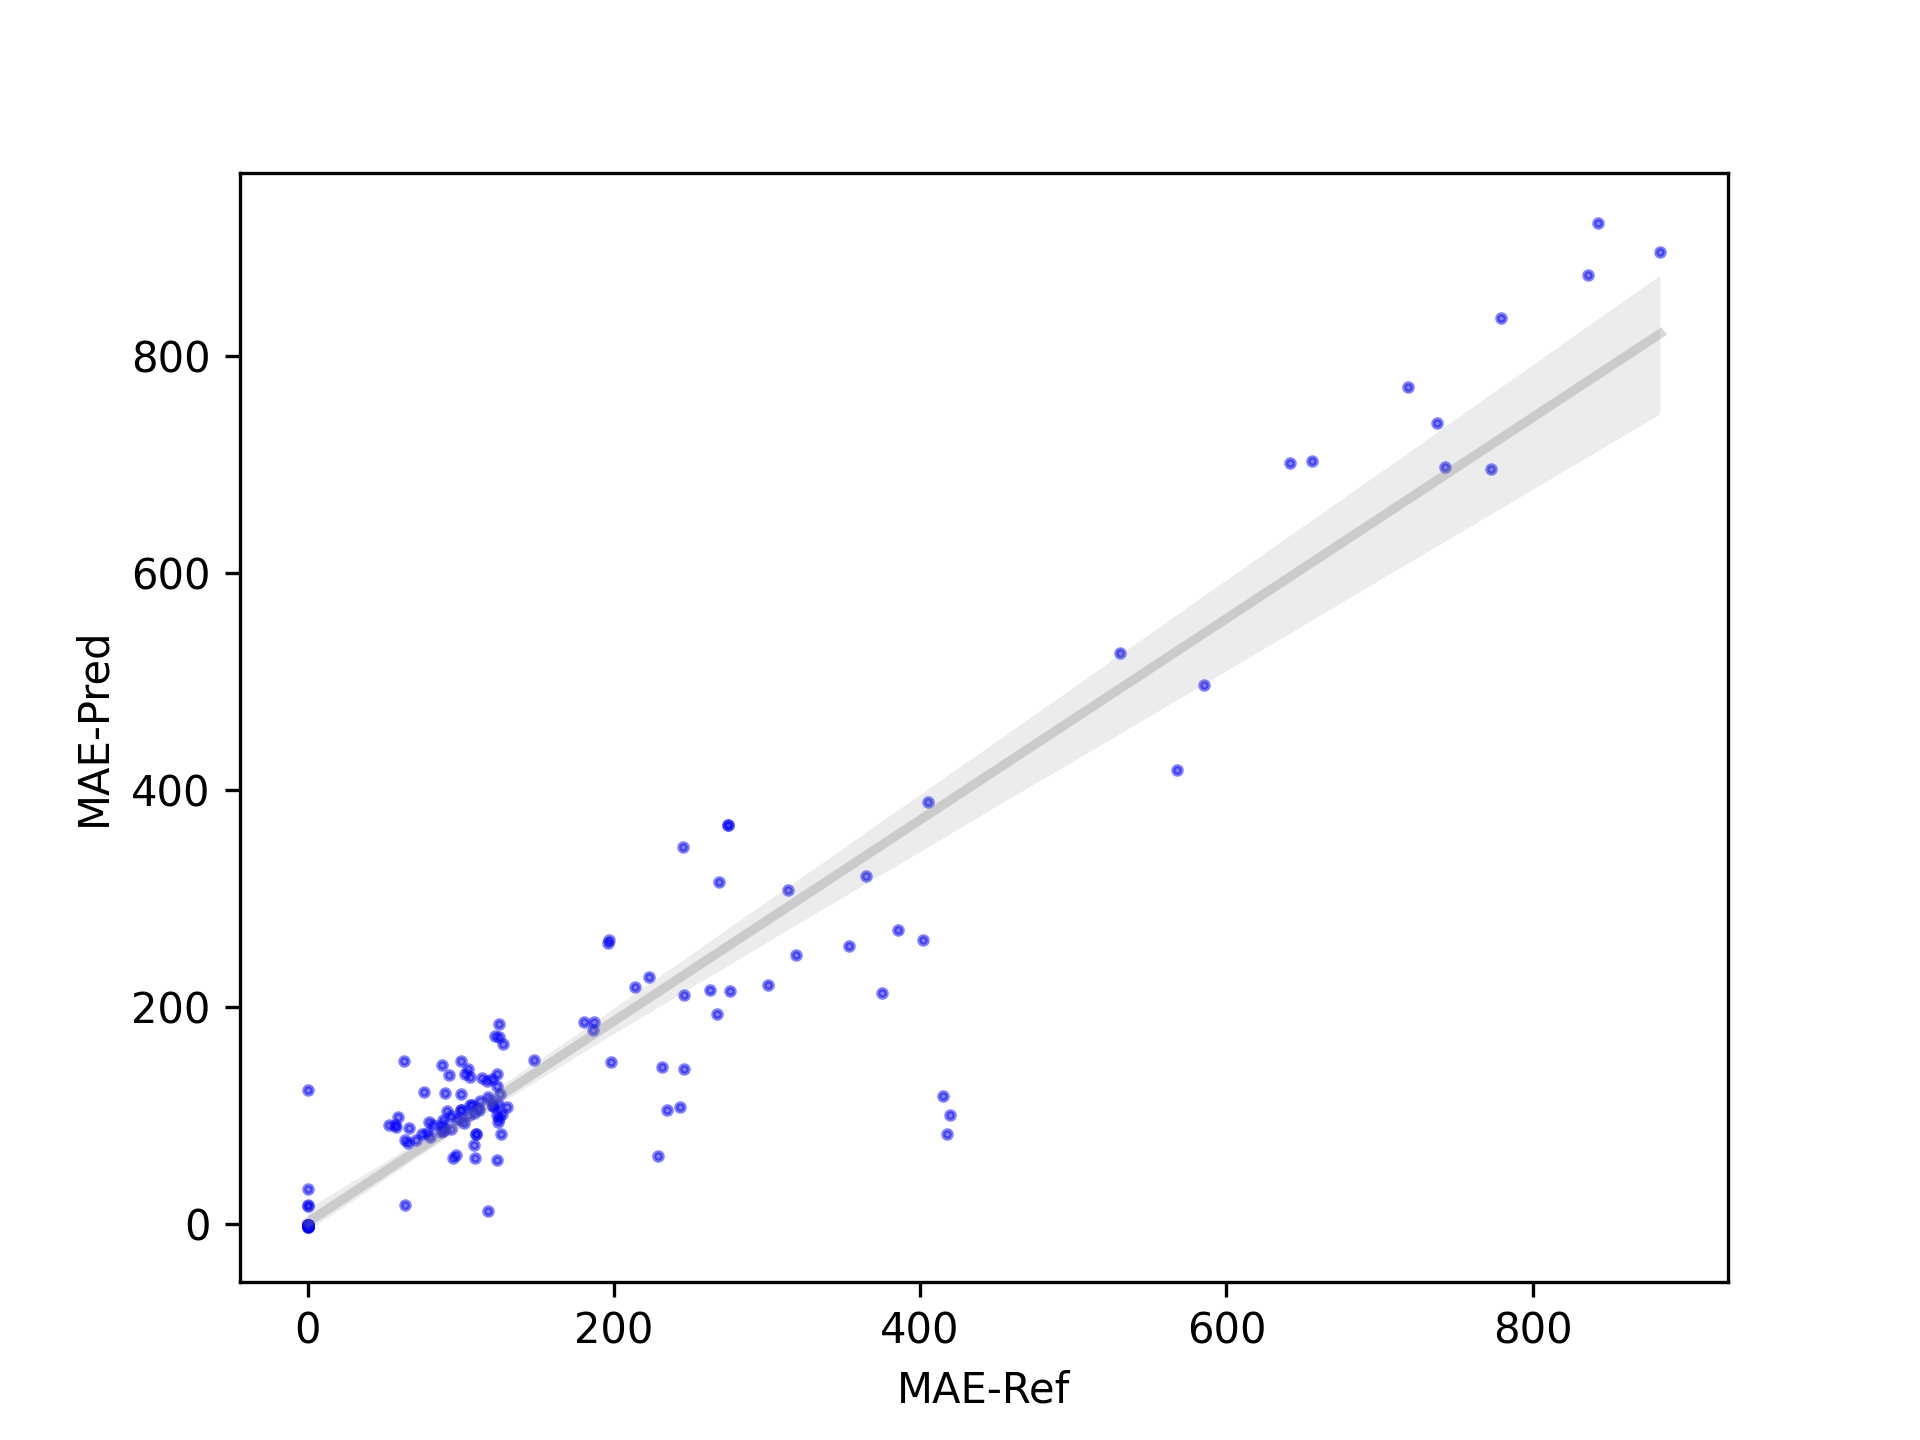
The proposed QMetNet model learns to predict the MAE metric on unseen data in a reliable manner without a reference image. The qualitative performance of the model is shown as a comparison of the scores predicted from the model against the reference score for each image in Fig.1. The scatter plot and the R2 metric in Fig.2 show the quantitative accuracy of prediction of the quality assessment. This performance demonstrates the ability of the model to predict the accuracy of the generated sCT image reliably.Conclusion
We have presented a learnable method for assessment of quality metric for synthetic CT images generated from a DL model. We have shown the efficacy of the proposed method in being able to predict a metric without needing a reference image. This novel framework makes it possible to train models to predict a choice of metrics as suitable for different applications. It could be a potential solution to provide confidence of prediction of a model to ease adoption of AI solutions in clinical applications. This framework is not limited to prediction of MAE or similar quantitative metrics but could also be useful to learn subjective ratings of an image quality from manual experts in image reconstruction, segmentation, and synthesis tasks. With an appropriate model architecture, this method can be further extended to predict multiple metrics for a given image.Acknowledgements
No acknowledgement found.References
[1]. H.A Massa, et al, Phys. Med. Biol. 2020, Vol.65 23NT03
[2]. MF Spadea, et al, Medical Physics 2021; Vol.48 Issue.11, Pages 6537-6566
[3]. JJ Wyatt, et al, Radiother Oncol. 2023 Jul;184:109692
[4]. S Petit, et al, ESTRO 2023
[5]. V Chauhan, et al, ISMRM 2021
[6]. S Kaushik, et al, Physics in Medicine and Biology, Aug. 2023
[7]. B.B Avants, et al, Penn Image Computing and Science Laboratory, 2009
[8]. S Kaushik, et al, ISMRM 2023
Figures