2227
Uncertainty-aware Automated Liver Macromolecular Proton Fraction Quantification1Department of Imaging and Interventional Radiology, The Chinese University of Hong Kong, Hong Kong, China, 2Department of Medicine and Therapeutics, The Chinese University of Hong Kong, Hong Kong, China, 3Illuminatio Medical Technology Limited, Hong Kong, China, 4Philips Healthcare, Hong Kong, China
Synopsis
Keywords: Analysis/Processing, Machine Learning/Artificial Intelligence
Motivation: Macromolecular Proton Fraction quantification based on spin-lock MRI (MPF-SL) is a new technique for non-invasive imaging and characterization of macromolecule environment in tissues.
Goal(s): This study aims to develop an automated method for MPF quantification in the liver.
Approach: We present a deep learning framework for automated liver MPF quantification, incorporating an uncertainty-guided strategy for reliable region-of-interest (ROI) selection.
Results: Evaluation was conducted using clinical MPF data from 44 patients, demonstrating minimal error in MPF quantification and consistent and robust ROI selection. Our method shows promise in automated MPF measurement of the liver, offering both qualitative and quantitative evidence of its efficacy.
Impact: MPF-SL has been recently developed to measure
macromolecule levels, showing potential in the non-invasive diagnosis of
hepatic fibrosis.
This work automates MPF quantification using deep learning, showing the potential to decrease
the cost of MPF-SL post-processing.
Introduction
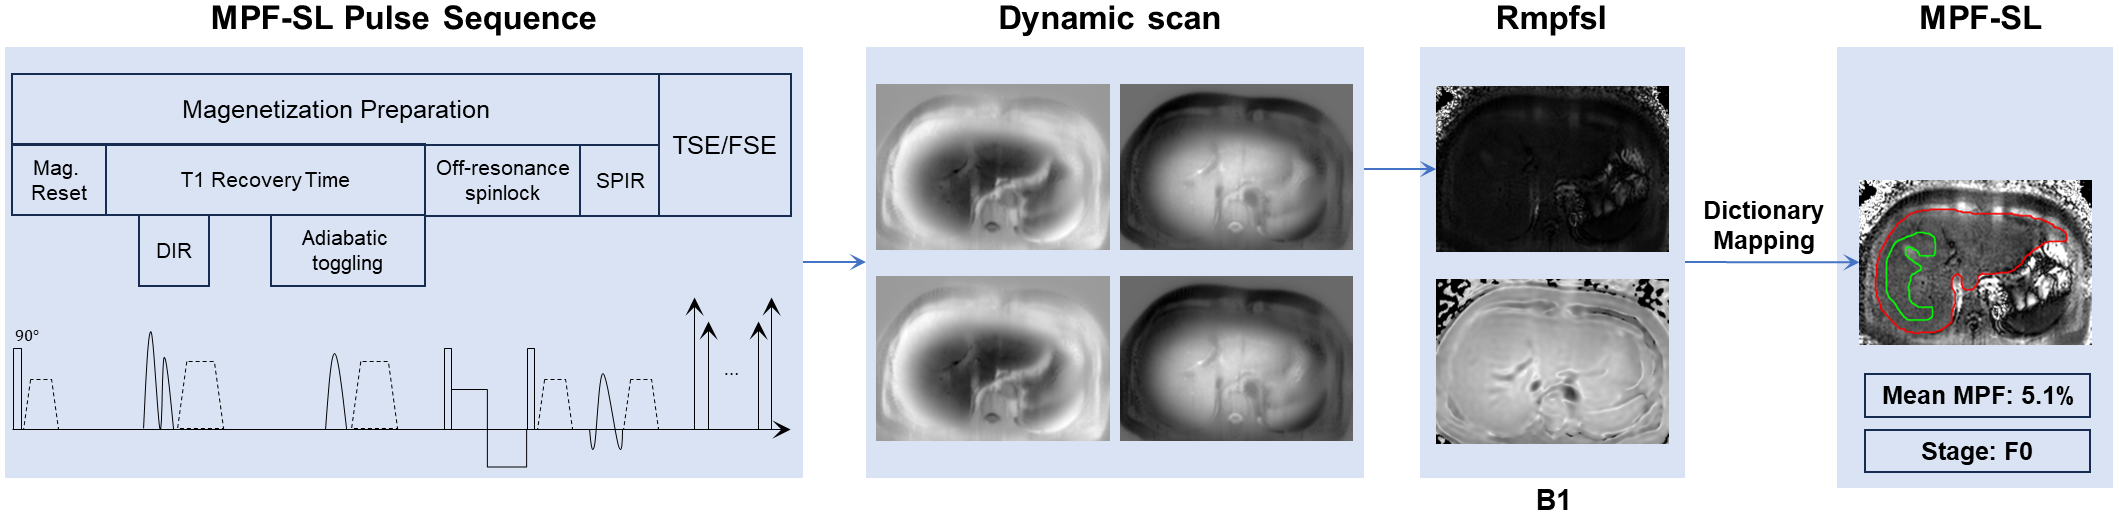
Chronic liver disease presents a significant global healthcare challenge. Liver fibrosis, an excessive extracellular matrix deposition resulting from persistent liver injury, is a key feature of chronic liver disease 1,2. Macromolecular Proton Fraction quantification based on spin-lock MRI (MPF-SL) has been recently developed to measure macromolecule levels, showing potential in the non-invasive diagnosis of hepatic fibrosis 3,4. Figure 1 illustrates the clinical workflow for MPF-SL, involving four dynamic scans (dynascans) and a B1 inhomogeneity map to quantify MPF levels. One challenge, however, is the manual selection of a region of interest (ROI) for mean MPF calculation, which can be time-consuming and requires expertise, making it difficult for routine use in large populations. In this study, we propose an uncertainty-aware deep learning framework as a solution to automate the liver MPF quantification.Methods
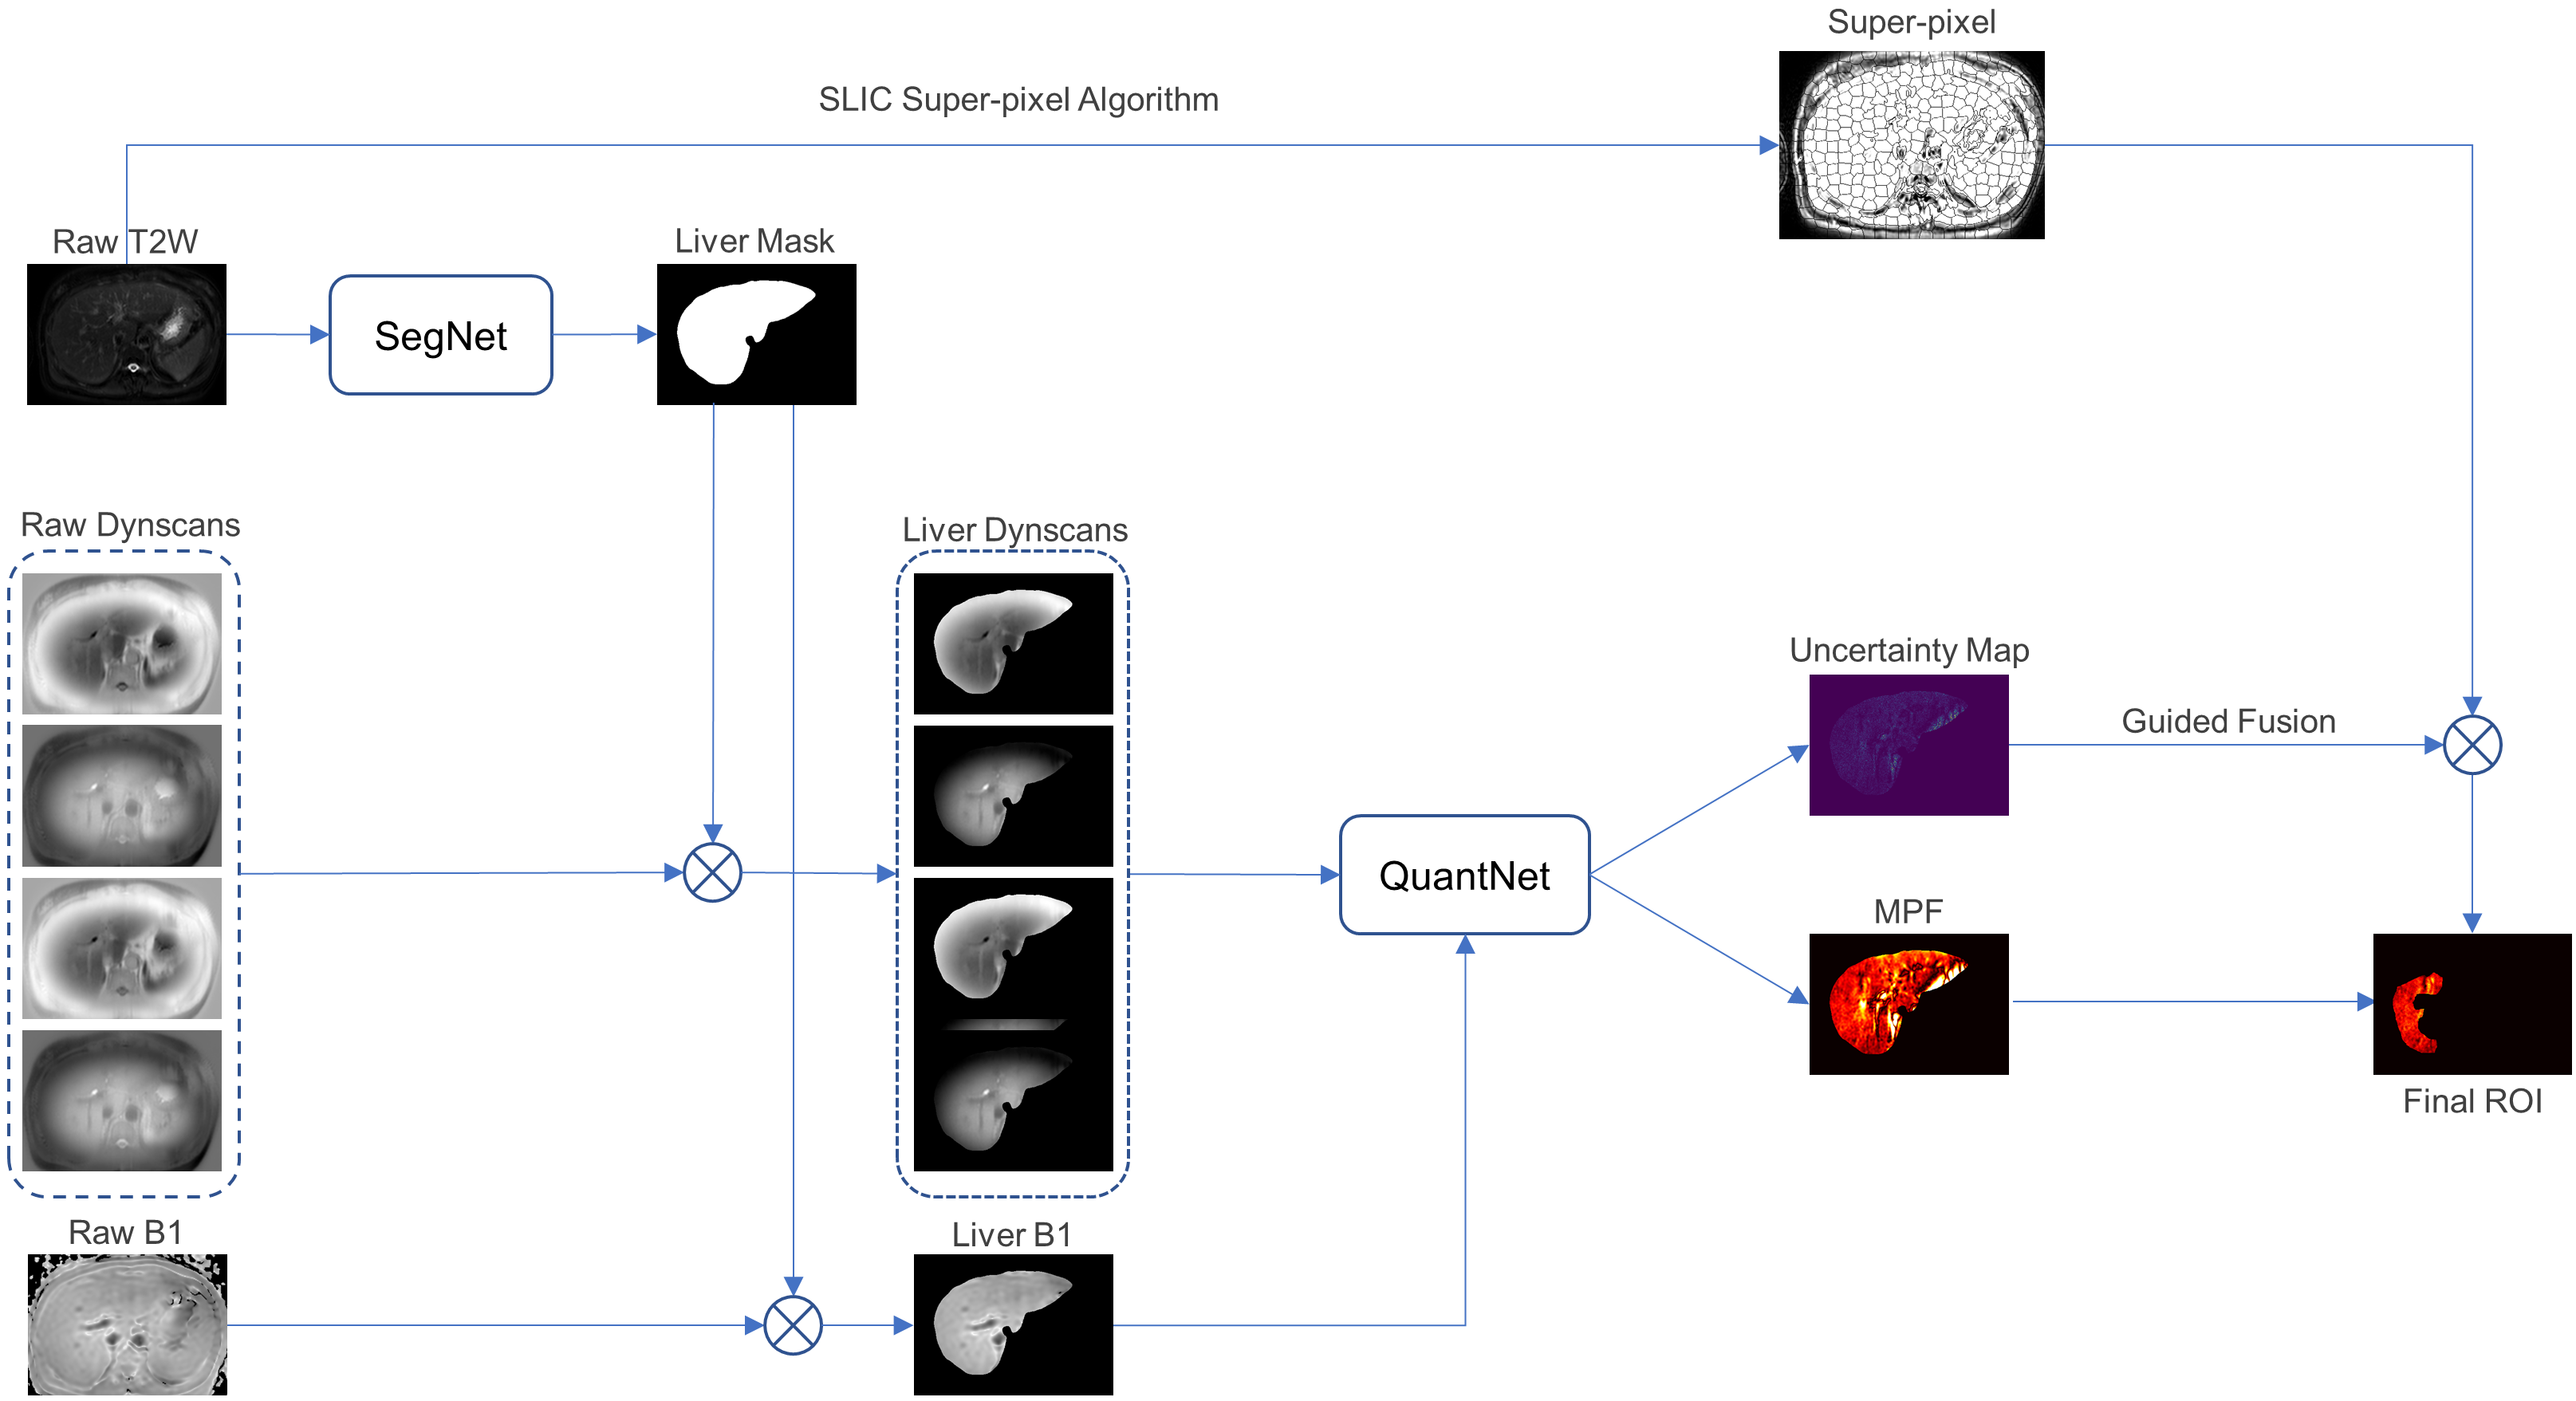
Figure 2 presents an overview of our proposed framework, which primarily comprises two key components: Segmentation and Quantification. In the Segmentation component, T2-weighted (T2w) images serve as the input to the SegNet, a segmentation network to generate liver masks. Meanwhile, a super-pixel map with anatomical similarity is derived from the T2w images using the SLIC algorithm. The Quantification component applies the segmented liver mask on raw dynascans and B1 maps through element-wise multiplication, yielding liver dynascans and a liver B1 map. Then the QuantNet, a quantification network, takes the liver dynascan pixels and the liver B1 as input and outputs the predicted MPF. An uncertainty map is simultaneously generated via the Monte Carlo Dropout method 5. To obtain the final Region of Interest (ROI), we fuse the super-pixel map generated from the T2w image with the uncertainty map using a rule-based strategy below:- Perform element-wise multiplication between the super-pixel map and the uncertainty map.
- Exclude all super-pixel candidates located outside the liver mask.
- Exclude super-pixel candidates containing uncertainty values greater than 0.3 as well as the largest 10% of uncertainty values.
- Preserve the largest connected component. In cases where multiple largest connected components exist, select the one with the lowest uncertainty mean.
Experimental Settings
Data settingAll the MRI scans were conducted on a 3T MRI scanner (Achieva TX, Philips Healthcare, Best, The Netherlands). The body coil was used as the transmitter with the dual-transmit turned on, and a 32-channel cardiac coil (Invivo Corp, FL, USA) was used as the receiver. Axial images were acquired with phase encoding along the anterior–posterior direction. MRI examinations with breath-hold sequences were performed in the transverse plane. B1 maps were acquired covering the entire liver. Data were collected from a total of 44 patients at different hepatic fibrosis stages. 22/11/11 patients were randomly selected as training/validation/testing set.
Network setting
For the SegNet, we employed nnUNet pre-trained on the CHAOS dataset for segmentation. For the QuantNet, a 6-layer DNN was utilized. This DNN takes a vector of four dynamic values along with the corresponding B1 value as input and produces the MPF value as output. Two dropout layers with a dropout rate of 0.2 were introduced in the last two layers, for the purpose of uncertainty estimation. Mean squared error (MSE) was used as the loss function during the training phase.
Results and Discussion
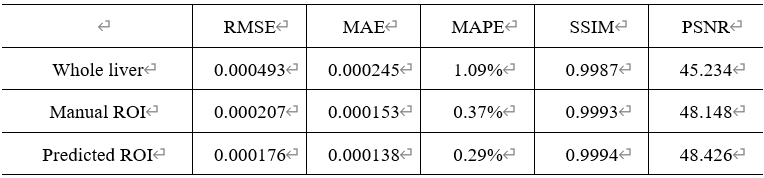
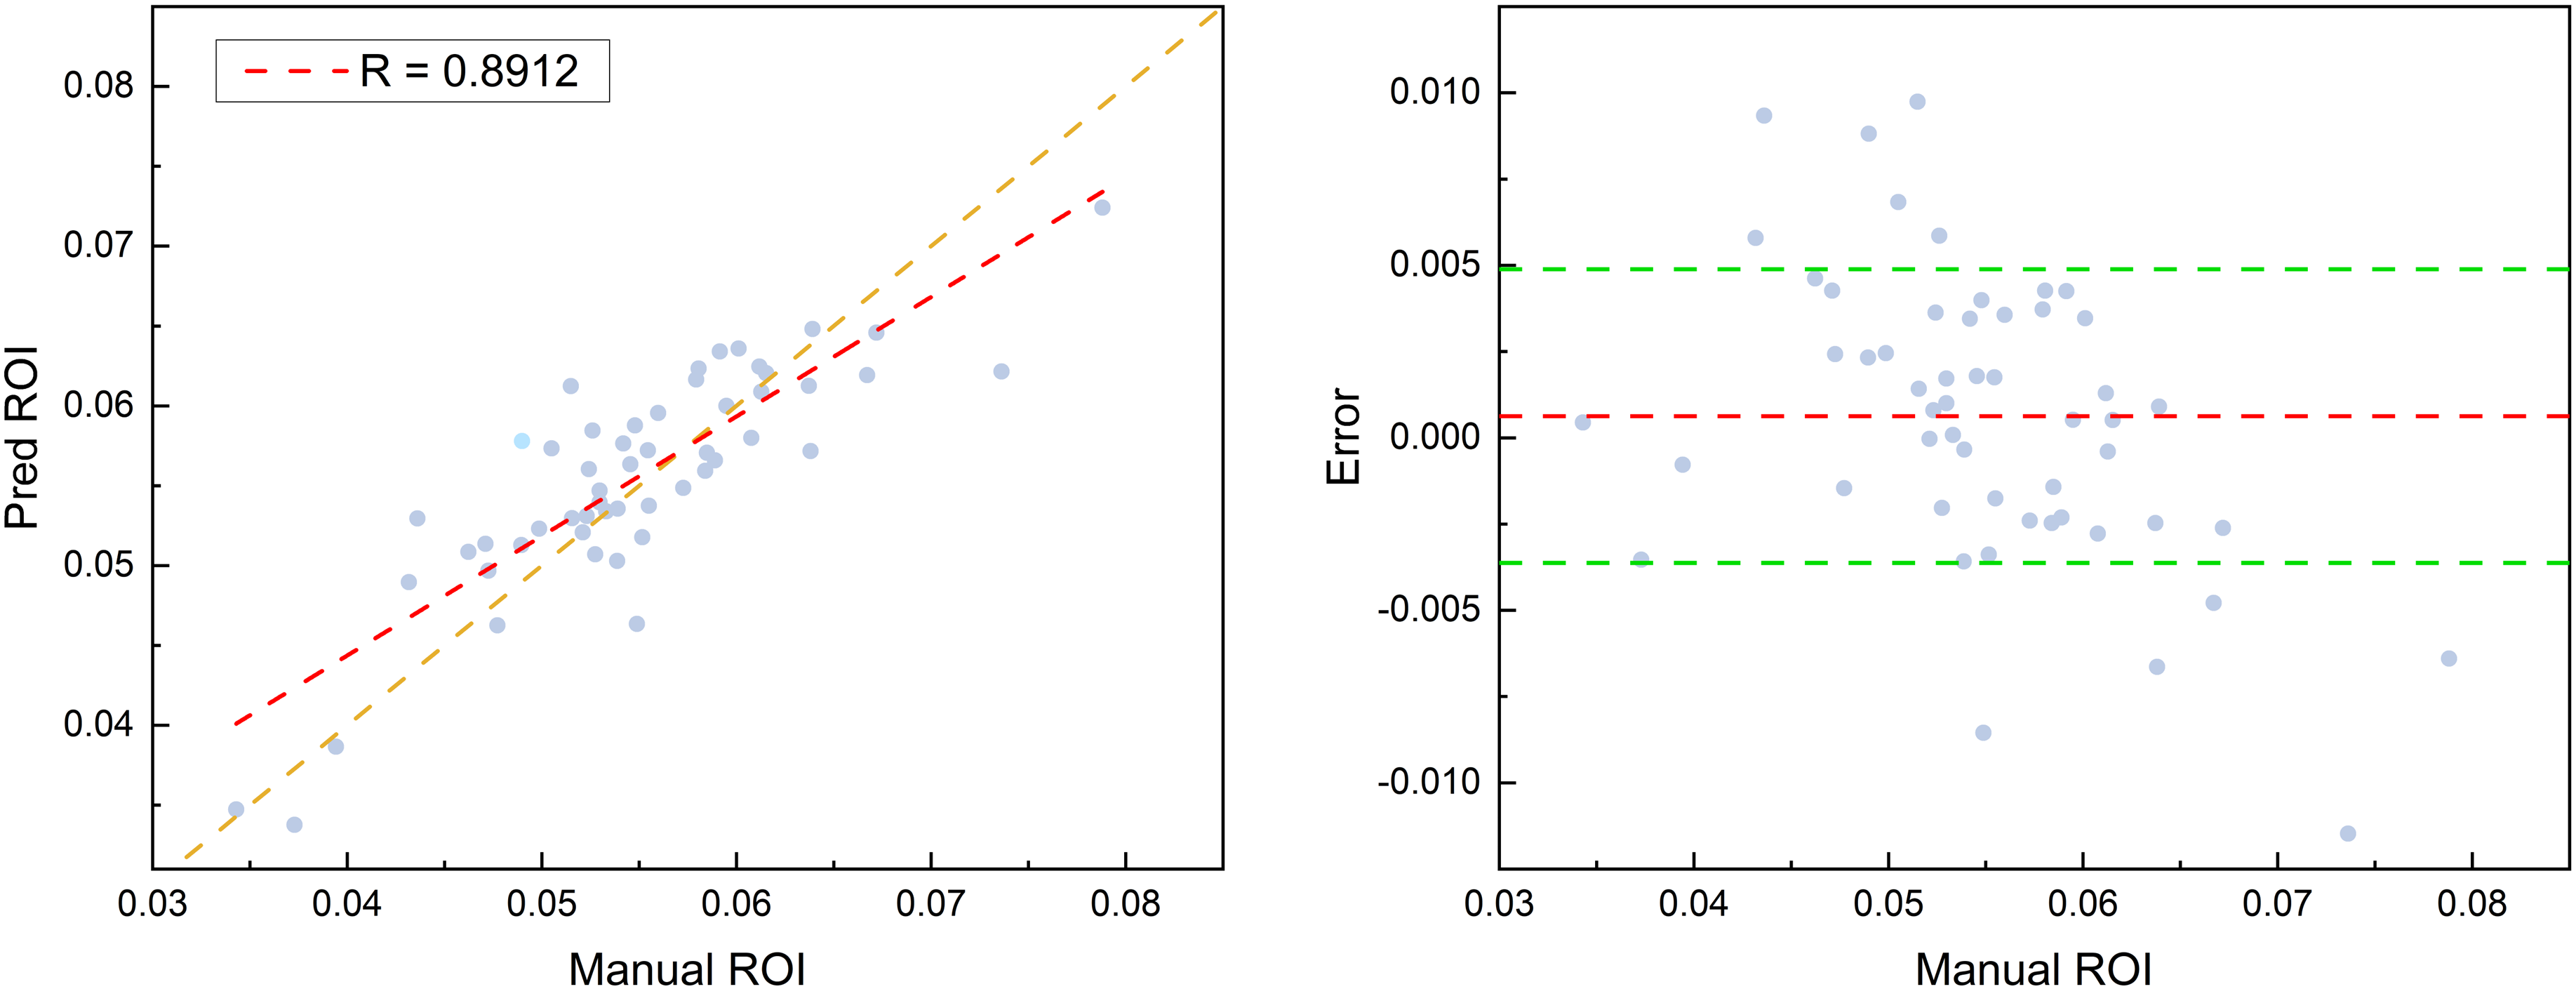
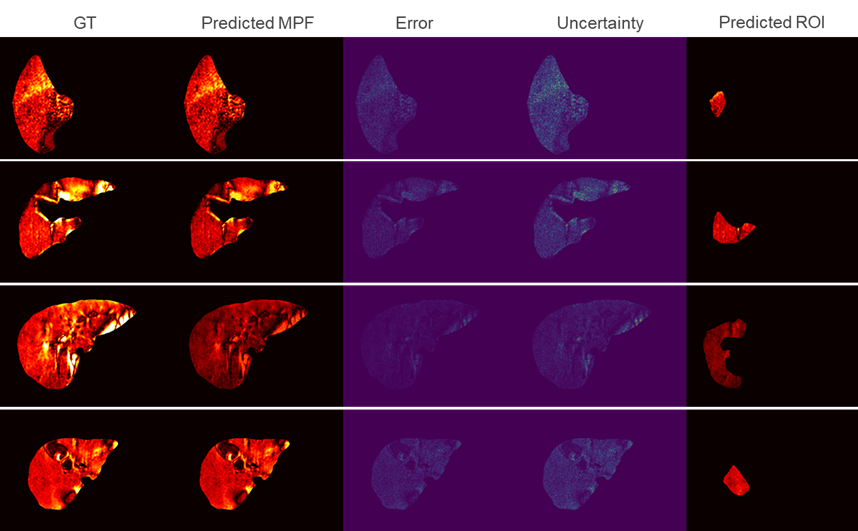
We evaluated our proposed method using five metrics: Root Mean Square Error (RMSE), Mean Absolute Error (MAE), Mean Absolute Percentage Error (MAPE), Structural Similarity Index Measure (SSIM), and Peak Signal-to-Noise Ratio (PSNR). Table 1 provides quantitative results for MPF quantification, showing small error for pixel estimation within both the liver and the ROI. Noteworthy are the quite low MAPE and the high SSIM/PSNR values. We additionally assessed the uncertainty-guided ROI selection method by examining the correlation between the mean MPF values in manually selected ROIs and those predicted automatically. Figure 3 presents a scatter plot and Bland-Altman analysis, demonstrating a strong correlation with a Pearson correlation coefficient of 0.8912 and a small bias. Figure 4 provides a visual representation of the quantification results from four different patients. We can observe that high uncertainty areas generally correspond to uncommon values at areas including blood vessels, bile ducts and artifacts, which we need to avoid when drawing ROIs. Thus by leveraging the estimated uncertainty, we can filter out the unreliable predictions and preserve only the reliable ones. These results in Figure 4 demonstrate reliable predictions of ROIs and quantification results.Conclusion
In this study, we present an uncertainty-aware deep learning framework designed for automated liver MPF quantification. Our research showcases the effectiveness of this method in delivering promising results in both quantification and ROI selection tasks, as validated on our clinically obtained liver MPF-SL dataset from 44 patients.Acknowledgements
This work is supported by a grant from the Innovation and Technology Commission of the Hong Kong SAR (Project MRP/001/18X), and a grant from the Faculty Innovation Award, the Chinese University of Hong Kong.References
- Sanyal A J, Van Natta M L, Clark J, et al. Prospective study of outcomes in adults with nonalcoholic fatty liver disease. New England Journal of Medicine, 2021, 385(17): 1559-1569.
- Heyens L J M, Busschots D, Koek G H, et al. Liver fibrosis in non-alcoholic fatty liver disease: from liver biopsy to non-invasive biomarkers in diagnosis and treatment. Frontiers in medicine, 2021, 8: 615978.
- Hou J, Wong V W S, Jiang B, et al. Macromolecular proton fraction mapping based on spin‐lock magnetic resonance imaging. Magnetic Resonance in Medicine, 2020, 84(6): 3157-3171.
- Hou J, Wong V W S, Qian Y, et al. Detecting Early‐Stage Liver Fibrosis Using Macromolecular Proton Fraction Mapping Based on Spin‐Lock MRI: Preliminary Observations. Journal of Magnetic Resonance Imaging, 2023, 57(2): 485-492.
- Kendall A, Gal Y. What uncertainties do we need in bayesian deep learning for computer vision? Advances in neural information processing systems, 2017, 30.
Figures