2226
A sophisticated method for encoding StyleGAN-based synthetic MR images for disease progression prediction in multiple sclerosis1Institut of Diagnostic and Interventional Radiology / Medical Physics Group, Jena University Hospital, Jena, Germany, 2Michael-Stifel-Center for Data-Driven and Simulation Science Jena, Jena, Germany, 3Institut of Diagnostic and Interventional Radiology / Section of Neuroradiology, Jena University Hospital, Jena, Germany
Synopsis
Keywords: Analysis/Processing, Machine Learning/Artificial Intelligence
Motivation: Diseases related progress simulated through latent space image manipulation is difficult to interpret.
Goal(s): The goal was to develop an approach allowing for an improved interpretation of latent space image manipulation.
Approach: A StyleGAN model trained on MRI data from MS patients and healthy controls was used for image manipulation. The direction in latent space for generating images mimicking diseases progression towards MS was determined. The spatial changes were analyzed through eigenvalue decomposition.
Results: The decomposition approach revealed a pattern resembling a polynomial series, suggesting a parameterized data manipulation, with the second component being the most informative for illustrating disease related image changes.
Impact: The analysis method for disentanglement complex image changes through latent space manipulation offers improved predictive accuracy and enhances our understanding of disease progression in neuroimaging research by isolating disease-related image features with a parameter-free approach.
Introduction
We propose using a StyleGAN-based approach1 for MS research, which simulates disease progression in MR images by encoding them in a perceptually meaningful latent space. This space disentangles attributes, allowing for easy attribute manipulation. Similar to previous studies2-4, we identified the MS progression direction in the latent space and manipulated images to reveal disease patterns. We also analyzed StyleGAN-synthesized images, generated to mimic changes from a healthy subject to one with multiple sclerosis, using a parameter-free method that goes beyond simple image subtraction to detect differences.Material and Methods
A StyleGAN model was trained on a dataset of 29,181 T1-weighted multi-echo gradient-echo MR images obtained from 327 MS patients and 84 healthy controls (HCs). These images were captured using a 3T MRI scanner (Prisma Fit, Siemens Healthineers) and were preprocessed through skull stripping and inhomogeneity correction. To manipulate the images, we first needed to reconstruct them using the trained model to obtain their corresponding latent codes. The direction for image manipulation from healthy to diseased subjects was determined via a supervised approach5. This vector in latent space was used to generate synthesized images starting from an MR image representation a healthy subject. First, the corresponding position in latent space needed to be identified. Starting from that position in latent space, new positions were computed by adding the previously determined vector to the starting position in combination with increasing scale factor alpha (0 .. 50, 15 steps). Synthesized MR images were generated based on these positions. These images were then vectorized (foreground voxels were rearranged to form a vector for each generated image) and stacked to a matrix M with the dimensions <N object voxels> X <N different manipulated images ordered by the corresponding scale factor alpha). Finally, an eigenvalue decomposition of the covariance matrix of the previously generated matrix M was performed. The resulting eigenvectors reflect the spatially correlated changes with respect to the scaling factor in decreasing order. The first eigenvector usually contains the general offset and does not vary with respect to the scaling factor. In order to reconstruct the spatial distribution of the contribution of each eigenvector or component, the input matrix M was multiplied to the eigenvector of interest and the resulting vector was remapped to the image space. For comparison, a simple image subtraction between the baseline image (factor alpha = 0) and the MR images, which were synthesized by shifting the corresponding latent space position towards the initially determined latent space vector.Results
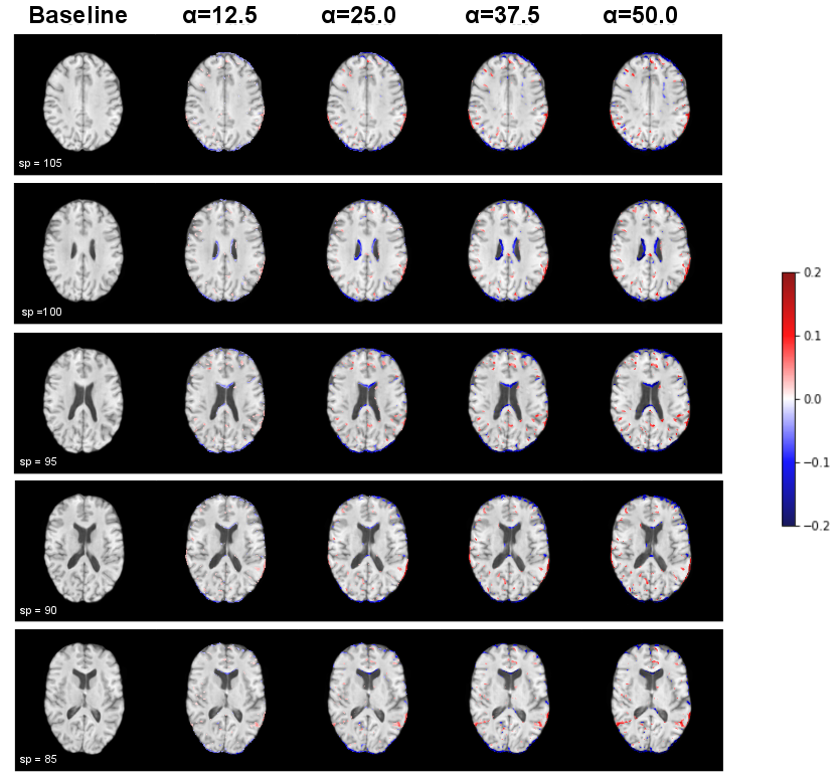
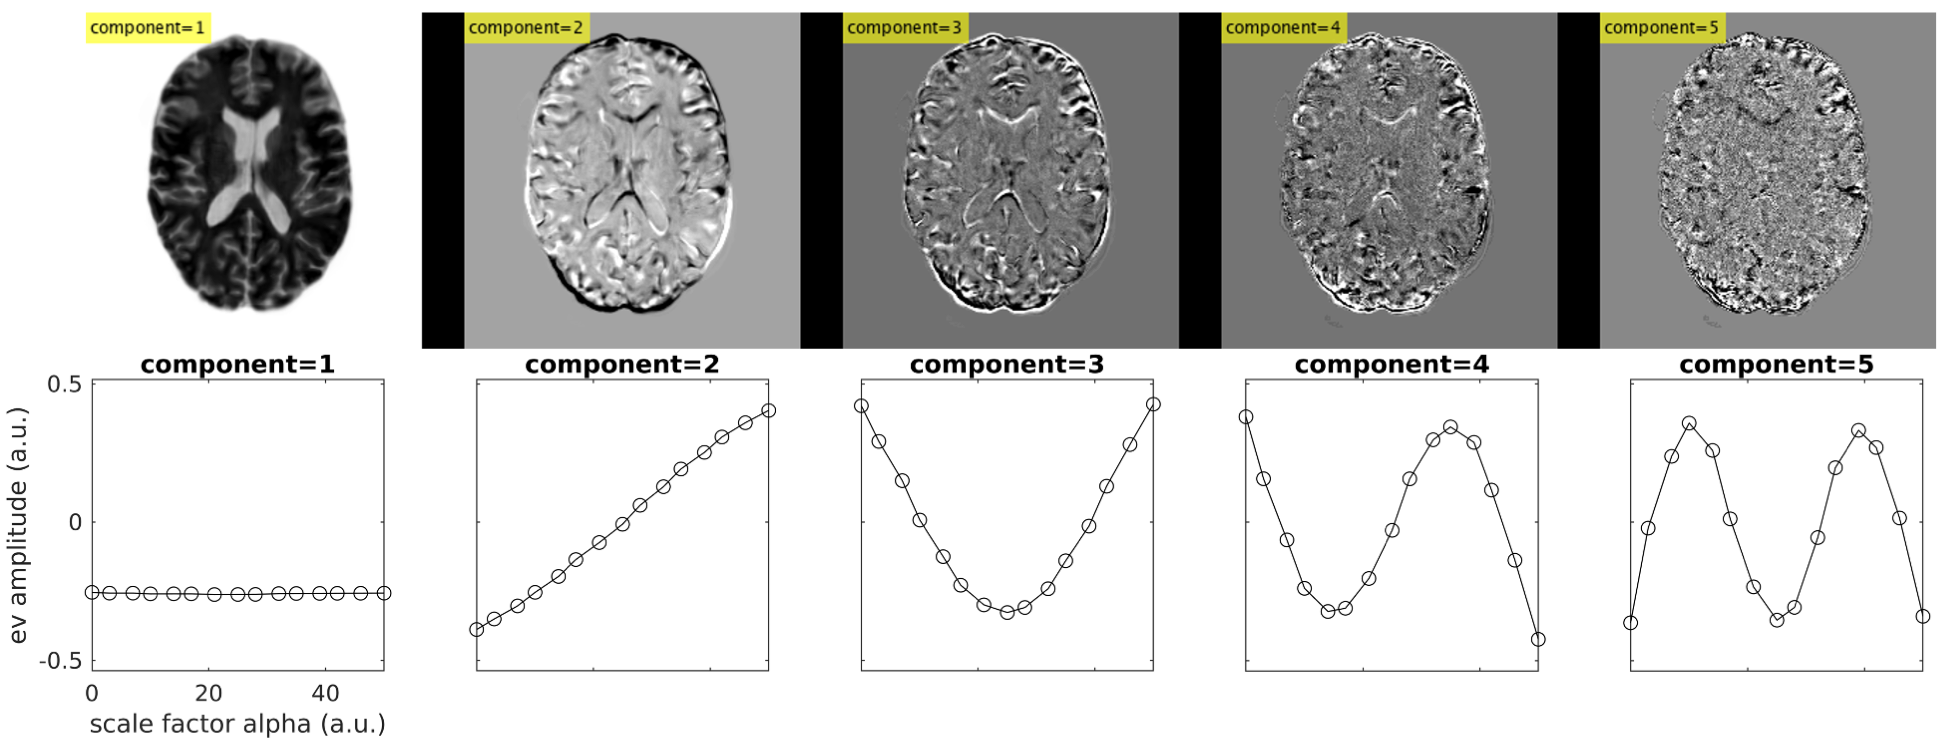
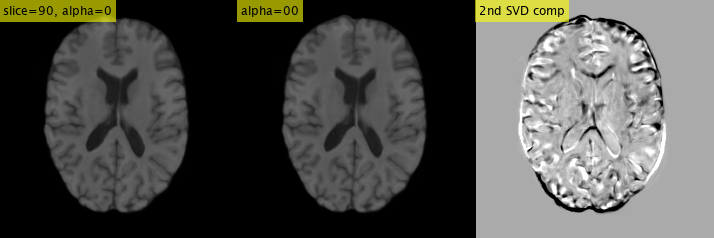
Fig. 1 shows synthesized images for six different slice positions generated from an initial position in latent space corresponding to a real data set of a randomly selected healthy control. The different versions with increasing scaling factor alpha manipulated the image pattern towards multiple sclerosis. Simple image differences (compared to baseline (alpha=0)) were superimposed over the T1-weighted images, with blue patterns indicating ventricular enlargement around the lateral ventricle and the occipital cortex and red patterns indicate brain atrophy in different areas. The examples show, however, that the patterns are difficult to recognize and interpret. Fig. 2 shows for a random data set (same data set as in Fig. 1) the first five assigned components and the corresponding eigenvectors of the covariance matrix at a selected slice position (slice position=90). It should be noted here that the determined eigenvectors (second row in Fig. 2.) appear to follow a pattern that resembles a polynomial series. This pattern was found to be independent of the selected data set or the selected slice position and it is directly related to the selected distribution of the scaling factor alpha. These patterns make it clear that this is a parameterized data manipulation. The second component is always almost linearly related to the scaling factor. This second component most clearly indicated the dynamic image change and is therefore preferable to the simple reference method. In addition to the initial image state (alpha=0), Fig. 3 shows the dynamic change with increasing factor alpha, as well as the remapped isolated component 2.Discussion
We have developed a method with which image changes through latent space vector manipulation can be better analysed. The patterns that emerged seem to offer a very interesting way of breaking down the complex image changes into ordered components and thus to better interpret the latent space vector manipulation and thus, better understand changes in the image representation of disease progression.Acknowledgements
No acknowledgement found.References
- Karras, T., et al., (2020). Analyzing and improving the image quality of stylegan. In Proceedings of the IEEE/CVF conference on computer vision and pattern recognition (pp. 8110-8119).
- Fetty, L., et al. (2020). Latent space manipulation for high-resolution medical image synthesis via the StyleGAN. Zeitschrift für Medizinische Physik, 30(4), 305-314.
- Schutte, K., et al. (2021). Using stylegan for visual interpretability of deep learning models on medical images. arXiv preprint arXiv:2101.07563.
- Han, T., et al. (2022). Image prediction of disease progression for osteoarthritis by style-based manifold extrapolation. Nature Machine Intelligence, 1-11.
- Shen, Y., et al. (2020). Interpreting the latent space of gans for semantic face editing. In Proceedings of the IEEE/CVF conference on computer vision and pattern recognition (pp. 9243-9252).
Figures