2225
An Interpretable Deep Learning Approach for Identifying Working Memory-related Regions in fMRI using Three Large Cohorts1Radiology and Imaging Science, Emory University School of Medicine, Atlanta, GA, United States, 2Biomedical Engineering, Stony Brook University, Stony Brook, NY, United States, 3Psychiatry and Behavioral Health, Renaissance School of Medicine at Stony Brook University, Stony Brook, NY, United States, 4Psychology, Stony Brook University, Stony Brook, NY, United States, 5Biomedical Engineering, Georgia Institute of Technology, Atalnta, GA, United States
Synopsis
Keywords: Analysis/Processing, Machine Learning/Artificial Intelligence, fMRI, Working memory
Goal(s): To evaluate our interpretable DL pipeline in fMRI analysis using three large cohorts to demonstrate its generalizability and reproducibility.
Approach: We built a VGG-like network to predict task performance and generate saliency maps that can show brain regions important for task performance using three independent datasets.
Results: The DL generated saliency maps are consistent between each dataset.
Impact: We demonstrated that interpretable deep learning can be used as a reliable and generalizable tool to gain insight into brain regions whose activation impacts task performance.
Introduction
Working memory (WM) is a cognitive function that allows for the temporary storage and manipulation of consciously accessible information, which is crucial for decision-making and comprehension1 and is often impaired in various psychiatric and neurological disorders. Traditional generalized linear modeling has been used to analyze functional magnetic resonance imaging (fMRI) task data, revealing regions activated during WM tasks and associated with task performance. However, this method does not capture nonlinear relationships between the fMRI region activation/deactivation and task performance. Moreover, they are typically performed on a voxel- or region-wise basis without considering potential complex interactions across multiple regions, potentially obscuring other WM-related neural processes. Deep learning (DL), specifically convolutional neural networks (CNN), offers a way to analyze fMRI data in a nonlinear, data-driven manner. While CNNs are often used as a “black box,” recent advancements in computer vision may allow for a meaningful understanding of how neural networks generate results. A saliency map – a visual depiction of the gradient backpropagation process during CNN training – can identify the brain regions that most significantly influence network performance. We have previously created an interpretable DL network that generates saliency maps reflecting network performance for input cortical fMRI data, yielding intriguing results.In this study, we evaluated the generalizability of our DL model in synthesizing saliency maps that highlight regions in which neural activation/deactivation was most predictive of task performance, using fMRI data from a WM task.
Method
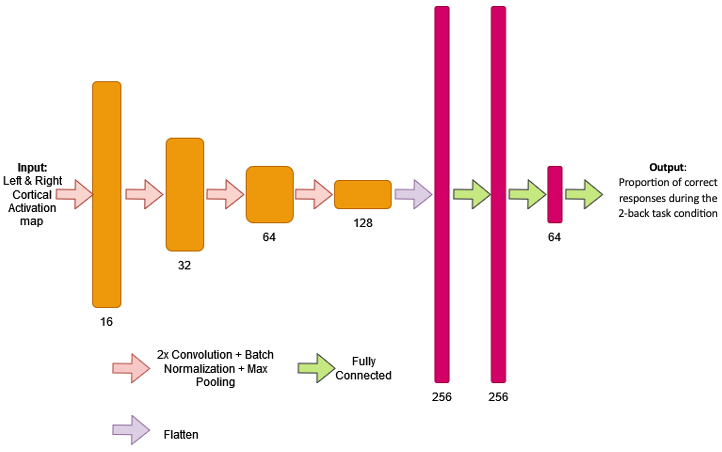
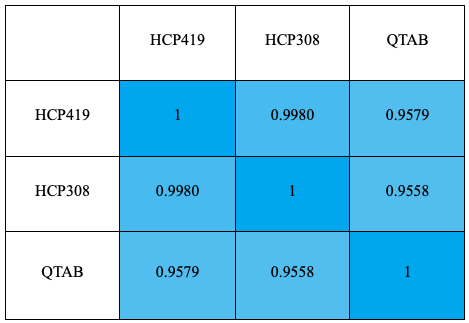
Our pipeline was initially designed using WM task fMRI data from 419 unrelated subjects from the Human Connectome Project (HCP)2 herein referred to as HCP419. We evaluated the prediction performance and the saliency maps generated using the same pipeline on two additional datasets. One dataset consists of an additional 308 unrelated subjects from the HCP, herein referred to as HCP308, while the other and WM task singleband fMRI data from 520 unrelated subjects from the Queensland Twin Adolescent Brain Project (QTAB), preprocessed in fMRIPrep3,4. Cortical 2-back minus 0-back t-contrast maps from an n-back WM task were collected and stored in CIFTI format. In data from QTAB, vertices in regions of unstable contrast values due to signal dropout were removed from the contrast maps. The pipeline below was performed independently on the three datasets.The left and right hemispheres were combined into a single 2D image as the input to the CNN. We utilized an architecture resembling the VGGNet5 shown in Figure 1. The network was trained to predict each participant’s proportion of correct responses during the 2-back task condition. We performed 5-fold cross-validation and trained 10 independent networks that were initialized randomly for each fold to account for network stochasticity. Interpretability analysis was performed by generating saliency maps via backpropagation and smoothed using the SmoothGrad algorithm6. The Pearson correlation between average saliency maps from each dataset was calculated to verify spatial similarity. The overlap region of the average saliency map between each dataset was generated, containing regions with saliency at the top 30% in each map.
Results
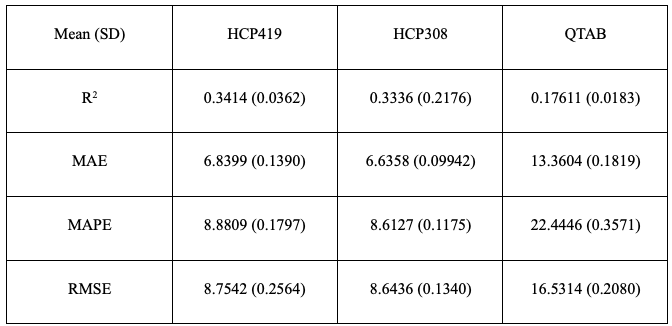
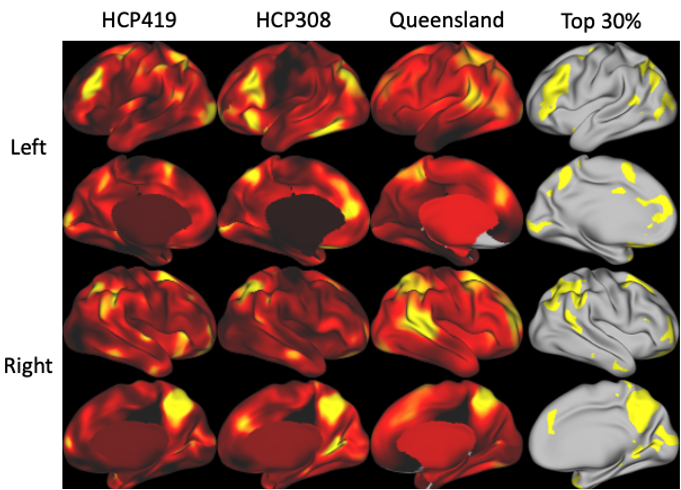
The DL model was able to predict WM performance in all three data sets. As shown in Figure 2, the prediction performance as measured by R2, mean absolute error (MAE), mean absolute percentage error (MAPE), and root mean square error (RMSE) was similar between HCP419 and HCP308, while performance was lower in QTAB dataset. Figure 3 presents the average saliency maps for each dataset. As demonstrated by this figure, the three average saliency maps show a high degree of similarity. This is further demonstrated by their high Pearson correlation (>0.95), which can be found in Figure 4.Discussion
The performance of the DL model on HCP419 and HCP308 data sets showed remarkable similarities, while its performance on the QTAB dataset was slightly reduced, likely due to the lower spatial and temporal resolution of this singleband dataset. Despite this difference in performance, high saliency regions (indicated by yellow) were consistent across all three datasets. This demonstrates that the saliency maps generated using our pipeline are consistent for different variations of similar WM tasks, even when using an independent dataset (QTAB), highlighting its reproducibility across data sets.The average saliency map not only highlights traditional WM task-positive regions, including the dorsolateral prefrontal cortex and posterior parietal cortex, but also some task-negative default mode network regions like the medial prefrontal cortex and posterior cingulate cortex.
Conclusion
The consistency of the saliency maps suggests that DL models hold promise as a reliable method for gaining insight into brain regions whose activation or deactivation is associated with WM task performance in human health and disease.Acknowledgements
This work was funded by NIH grants R01MH120293 to JXVS, F30MH122136 to JCW, and a Stony Brook GAANN Fellowship to PNT.References
1. Baddeley A. Working memory. Current Biology. 2010;20(4):R136-R140. doi:10.1016/j.cub.2009.12.014
2. Van Essen DC, Ugurbil K, Auerbach E, et al. The Human Connectome Project: A data acquisition perspective. Neuroimage. 2012;62(4):2222-2231. doi:10.1016/j.neuroimage.2012.02.018
3. Strike LT, Hansell NK, Chuang KH, et al. The Queensland Twin Adolescent Brain Project, a longitudinal study of adolescent brain development. Sci Data. 2023;10(1):195. doi:10.1038/s41597-023-02038-w
4. Esteban O, Markiewicz CJ, Blair RW, et al. fMRIPrep: a robust preprocessing pipeline for functional MRI. Nat Methods. 2019;16(1):111-116. doi:10.1038/s41592-018-0235-4
5. Simonyan K, Zisserman A. Very Deep Convolutional Networks for Large-Scale Image Recognition. Published online April 10, 2015. Accessed November 6, 2023. http://arxiv.org/abs/1409.1556
6. Smilkov D, Thorat N, Kim B, Viégas F, Wattenberg M. SmoothGrad: removing noise by adding noise. Published online June 12, 2017. doi:10.48550/arXiv.1706.03825
Figures