2218
Cartilage and Meniscus Segmentation for Knee MRIs: 2D, 3D and Foundational Models1GE HealthCare, san mateo, CA, United States, 2Columbia University, New York, NY, United States, 3GE HealthCare, Munich, Germany, 4Rey Juan Carlos University, Madrid, Spain, 5GE HealthCare, Bangalore, India, 6Clinica Cemtro, Madrid, Spain, 7GE HealthCare, San Ramon, CA, United States, 8GE HealthCare, Seattle, WA, United States
Synopsis
Keywords: Analysis/Processing, Machine Learning/Artificial Intelligence
Motivation: Morphometric assessment of cartilage(e.g.,thickness), through MRI yields accurate measurements on the progression of Osteoarthritis(OA). Such quantitative measurements require image segmentation techniques. Recent developments in Visual Foundational Models(VFM) bring opportunities to increasing generality and robustness.
Goal(s): What improvements can VFM-based approaches bring to automatic segmentation of knee 3DMRIs, and how it compares to traditional convolution networks(CNNs)?
Approach: Trained 2DVFM, 3DCNN, and a modified 3DVFM on 500MRI volumes. Evaluated qualitative and quantitatively on external datasets.
Results: The proposed 3D-VFM, demonstrates a slight advantage on quantitative morphological assessment, but strongly outperforms others when qualitatively assessed by radiologists, presenting a promising direction and better generalization.
Impact: By leveraging Visual Foundational Models (VFM) in the morphometric assessment of cartilage through 3D MRIs, our research demonstrates significant promise in enhancing the accuracy and generalization of knee segmentation to be applied to osteoarthritis progression measurements.
Introduction
Recent advances in MR imaging and deep-learning(DL) have created opportunities in terms of automating morphometric assessment of cartilage, such as thickness, and have the potential to increase our understanding of the pathophysiologic changes in cartilage associated with Osteoarthritis(OA). It is, however, known that DL models largely miss generality outside the training domain and validation on external datasets is needed. Moreover, the recent work in VFM, networks trained on extensive, diverse datasets, that can be employed in a wide range of tasks, e.g.Visual-Transformers-Based(ViT) have caught the attention of research and medical communities, with perspectives of increasing generality. We aim to accurately segment soft tissue on MRIs of the knee joint, and evaluate traditional DL against recent developments on ViT-based FMs. Specifically, we (i)propose accurate cartilage and meniscus segmentation for 3DMRIs for morphometric assessment, (ii)show that modulating 3D information on FM-based approaches can improve segmentation quality/generalization, (iii)evaluate the application of 3D CNNs against 2D per-slice and 3D VFM-based methods.Methods
A 3DVnet1 architecture, trained from scratch, was used to learn segmentations for 4-classes: femoral, patellar, and tibial cartilages, the four meniscus horns2. Alternatively, the new VFM called Segment Anything Model(SAM)3 was finetuned on a 2D slice-by-slice approach using the same data/labels (SaMRI2D). Finally, we propose SaMRI3D, a modified SAM architecture able to modulate 3D information via cross-view attention4, using random 3D patches of the images during training. Both SaMRI3D and SaMRI2D were finetuned starting from its original pretrained weights3. Training set2 is composed by 500 knee MRI from subjects with and without OA and after ACL injury (age=42.79±14.75years,BMI=24.28±3.22Kg/m2,52%female). All studies used a high-resolution 3D fast spin-echo(FSE) CUBE sequence, TR/TE=1500/26.69ms, field-of-view=140mm, matrix=512-by-512pixels, slice-thickness=0.5mm, bandwidth=50.0kHz, fat-saturated=1.0. Quantitative external holdout-testset is composed by 7 clinical cases acquired with similar acquisition parameters and were independently manually segmented by two 20+ years of experience(YOE) radiologists(RadA and RadB) from two different sites. Quantitative measurements of interobserver variability in terms of dice score(DS), intersection-over-union(IoU) and cartilage thickness5 were extracted from this dataset. A different qualitative external holdout-testset, is composed by 20 clinical cases, 11/20 present cartilage implantation in different compartments, 2/20 ACL repair, and all lacking manual segmentations. Other two radiologists Rad1 and Rad2(20+ YOE) independently and blindly ranked the quality of all AI-driven segmentations for each case as best, middle and worst.Results
Figure1(A) shows average(standard-deviation) DSs, and IoU computed for all AI-models against both sets of manual annotations. These results can be compared with inter-reader variability shown in Figure1(B). Femoral segmentation seems to be more challenging as interobserver results are 2.5 dice points higher on average than the best models result. All other compartments are within inter-observer variability as shown in Figure1(A), where p-values imply that there is no significant difference between models and inter-observer computed distribution of quantitative metrics. Figure2 presents the blind qualitative assessment of the 3 models that shows SaMRI3D outperforming 3DVnet and SaMRI2D, where the latter is dimmed the worst quality segmentation most of the time. Agreement between radiologists was substantial6(Cohen’sKappa=0.65). Despite of slightly higher quantitative metrics, SaMRI2D suffers from spurious segmentation and does not generalize well for different contrast intensities driven by different fat saturation settings, see Figure3. Figure4(A) shows average(standard-deviation) cartilage thickness measurements, for all three AI-driven, and the two manual segmentations. Figure4(B) presents mean cartilage thickness error per-compartment computed between AI-driven and manual segmentations. Differences in thickness distributions between AI and radiologists were found to be non-significant. Figure4(C) shows interobserver thickness absolute difference, which are very close to the errors computed against the models, slightly favoring SaMRI3D, which presents the smallest error overall.Discussion and Conclusion
Dice and IoU for all compartments and models are not statistically different, implying similar quantitative performance. That may come from the fact that all models appear to be performing within interobserver variability. However, qualitative evaluation showed that 3D approaches present higher quality and were preferred by radiologists in a blind study. Moreover, the qualitative assessment of AI-driven segmentations suggests that 2D VFM-based approach may not be suitable due to spurious segmentations, and favors the 3D approaches, with emphasis on the SaMRI3D. SaMRI3D also presented itself as more robust to changes in contrast. Important to mention that convolutional 3D approaches are less computationally demanding for such similar performance. Finally, on morphometric assessment of cartilage thickness all approaches yield miniscule cartilage thickness errors between 0.1 and 0.3mm. However, SaMRI3D presented thickness values closer to ground-truth, in other words modulating 3D image information into the VFM model improves quality, which may translate to more accurate measurements on the progression of OA.Acknowledgements
This work was funded by GEHC. Xuzhe Zhang was an intern at GEHC San Ramon, CA, USA when this work was developed.References
1. F. Milletari, N. Navab, S. Ahmadi. V-Net: Fully Convolutional Neural Networks for Volumetric Medical Image Segmentation. arXiv: 1606.04797. 2016
2. B. A. A. Nunes, I. Flament, N. Namiri, R. Shah, U. Bharadwaj, T. Link, M. Bucknor, V. Pedoia, S. Majumdar, “Automatic Deep Learning Assisted Detection and Grading of Abnormalities in Knee MRI Studies”, Radiology: AI, Jan 2021, doi: 10.1148/ryai.2021200165.
3. A. Kirillov, et al. "Segment anything." arXiv preprint arXiv:2304.02643 (2023).
4. J. Wu, et al. "Medical sam adapter: Adapting segment anything model for medical image segmentation." arXiv preprint arXiv:2304.12620 (2023).
5. V. Mudiyam, D. Sundaran, J. Dholakia, M. Fung, “An Automated Technique To Estimate Knee Cartilage Thickness”, ESSR2023, https://www.essr2023.org/formulario-comunicaciones/posters/6571cdc598745728a64fdf67fb038ed2.pdf
6. McHugh, M.L., “Interrater reliability: the kappa statistic”. BiochemMed(Zagreb) 2012;22(3):276–282.
Figures
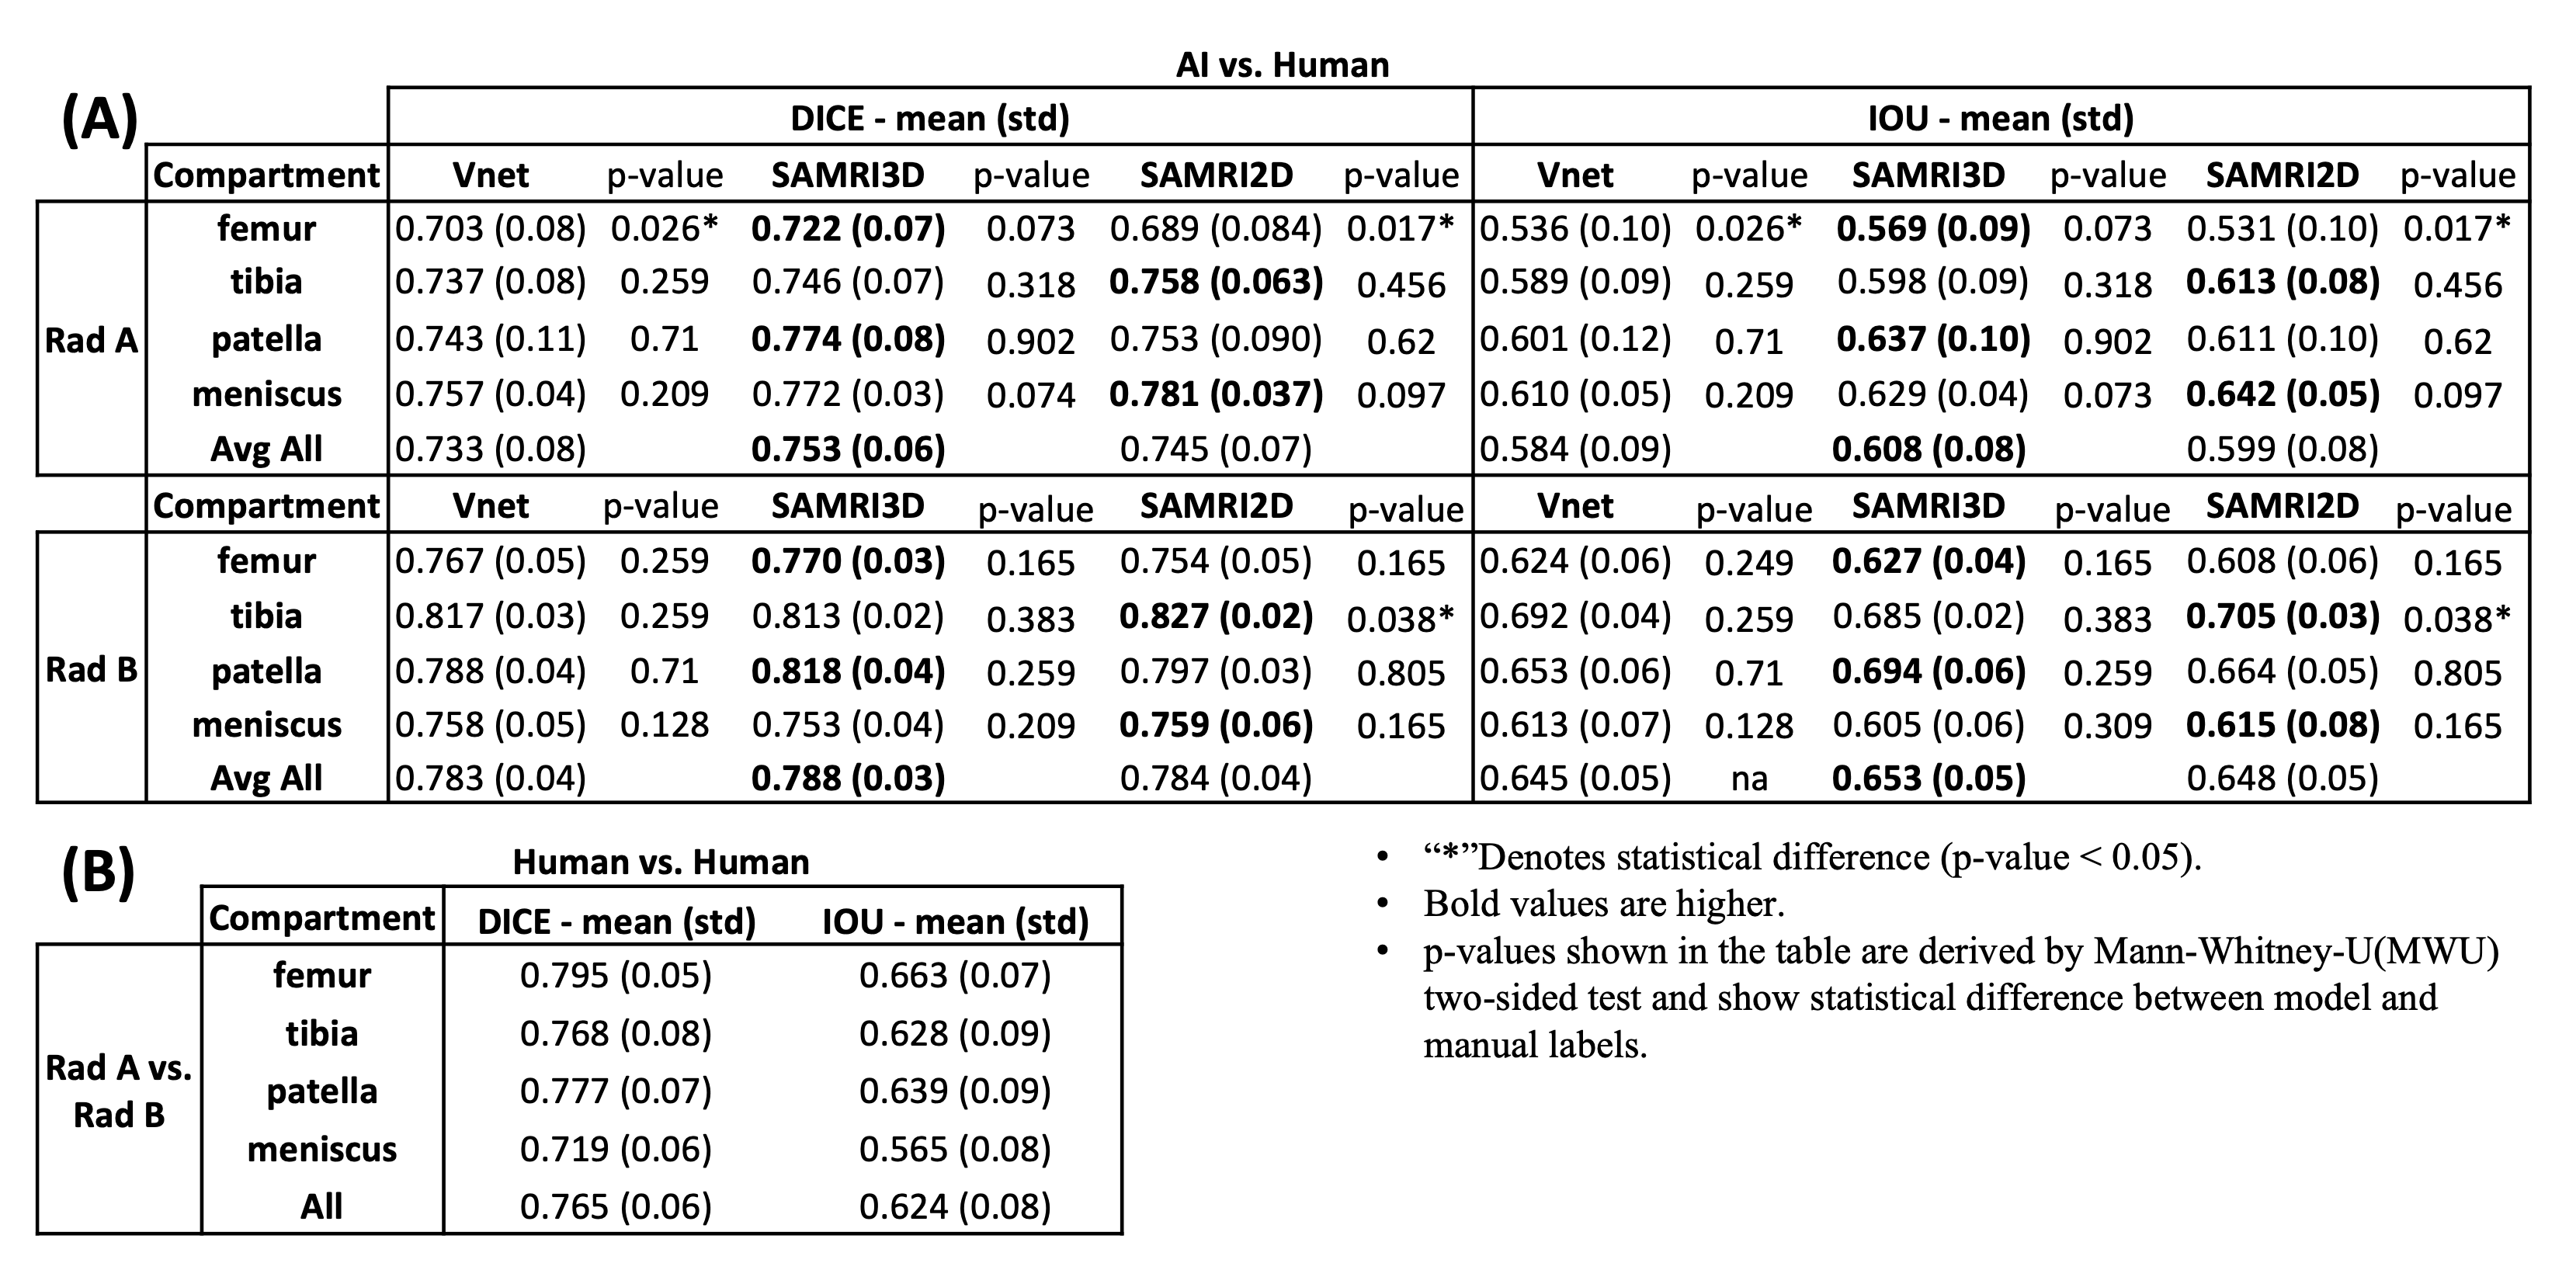
Figure 1:(A) Dice scores and IoU metrics, for 7 cases, computed between AI models and both manual segmentations independently annotated by radiologists, RadA and RadB, from distinct clinical institutions. VFM-based architectures seem to consistently produce slightly better results when compared to the 3DVnet. However, these differences between models are not significant according to MWU-two-sided test (p-values not shown. Highest p-value computed between metrics was p=0.136>0.05). (B) Interobserver variability: Dice and IoU computed between RadA and RadB.
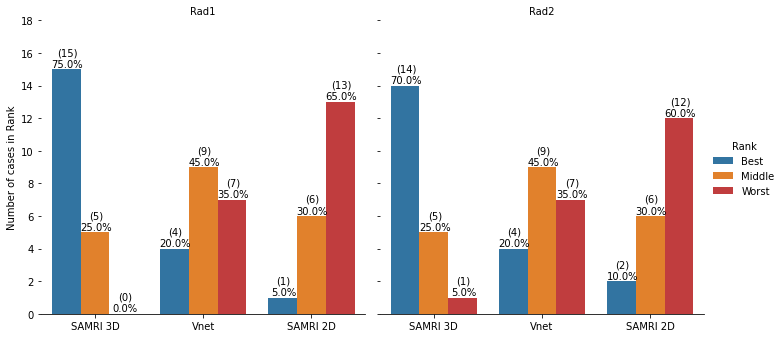
Figure 2: Two radiologists, Rad1 and Rad2, independently and blindly compared 3 AI-driven segmentations for each case (N=20), electing best, middle, and worst segmentations. SaMRI3D was ranked the best, 15 and 14 times respectively. SaMRI2D was ranked the worst model in 13 and 12 times. Overall agreement was substantial (Cohen’sKappa=0.65). Radiologists agreed on the same ranking for 13 cases; agreed on the best but disagreed on ranking middle and worst on 4 cases; agreed on worst but disagreed on best and middle on 2 cases; and completely disagreed on best and worst only for 1 case.
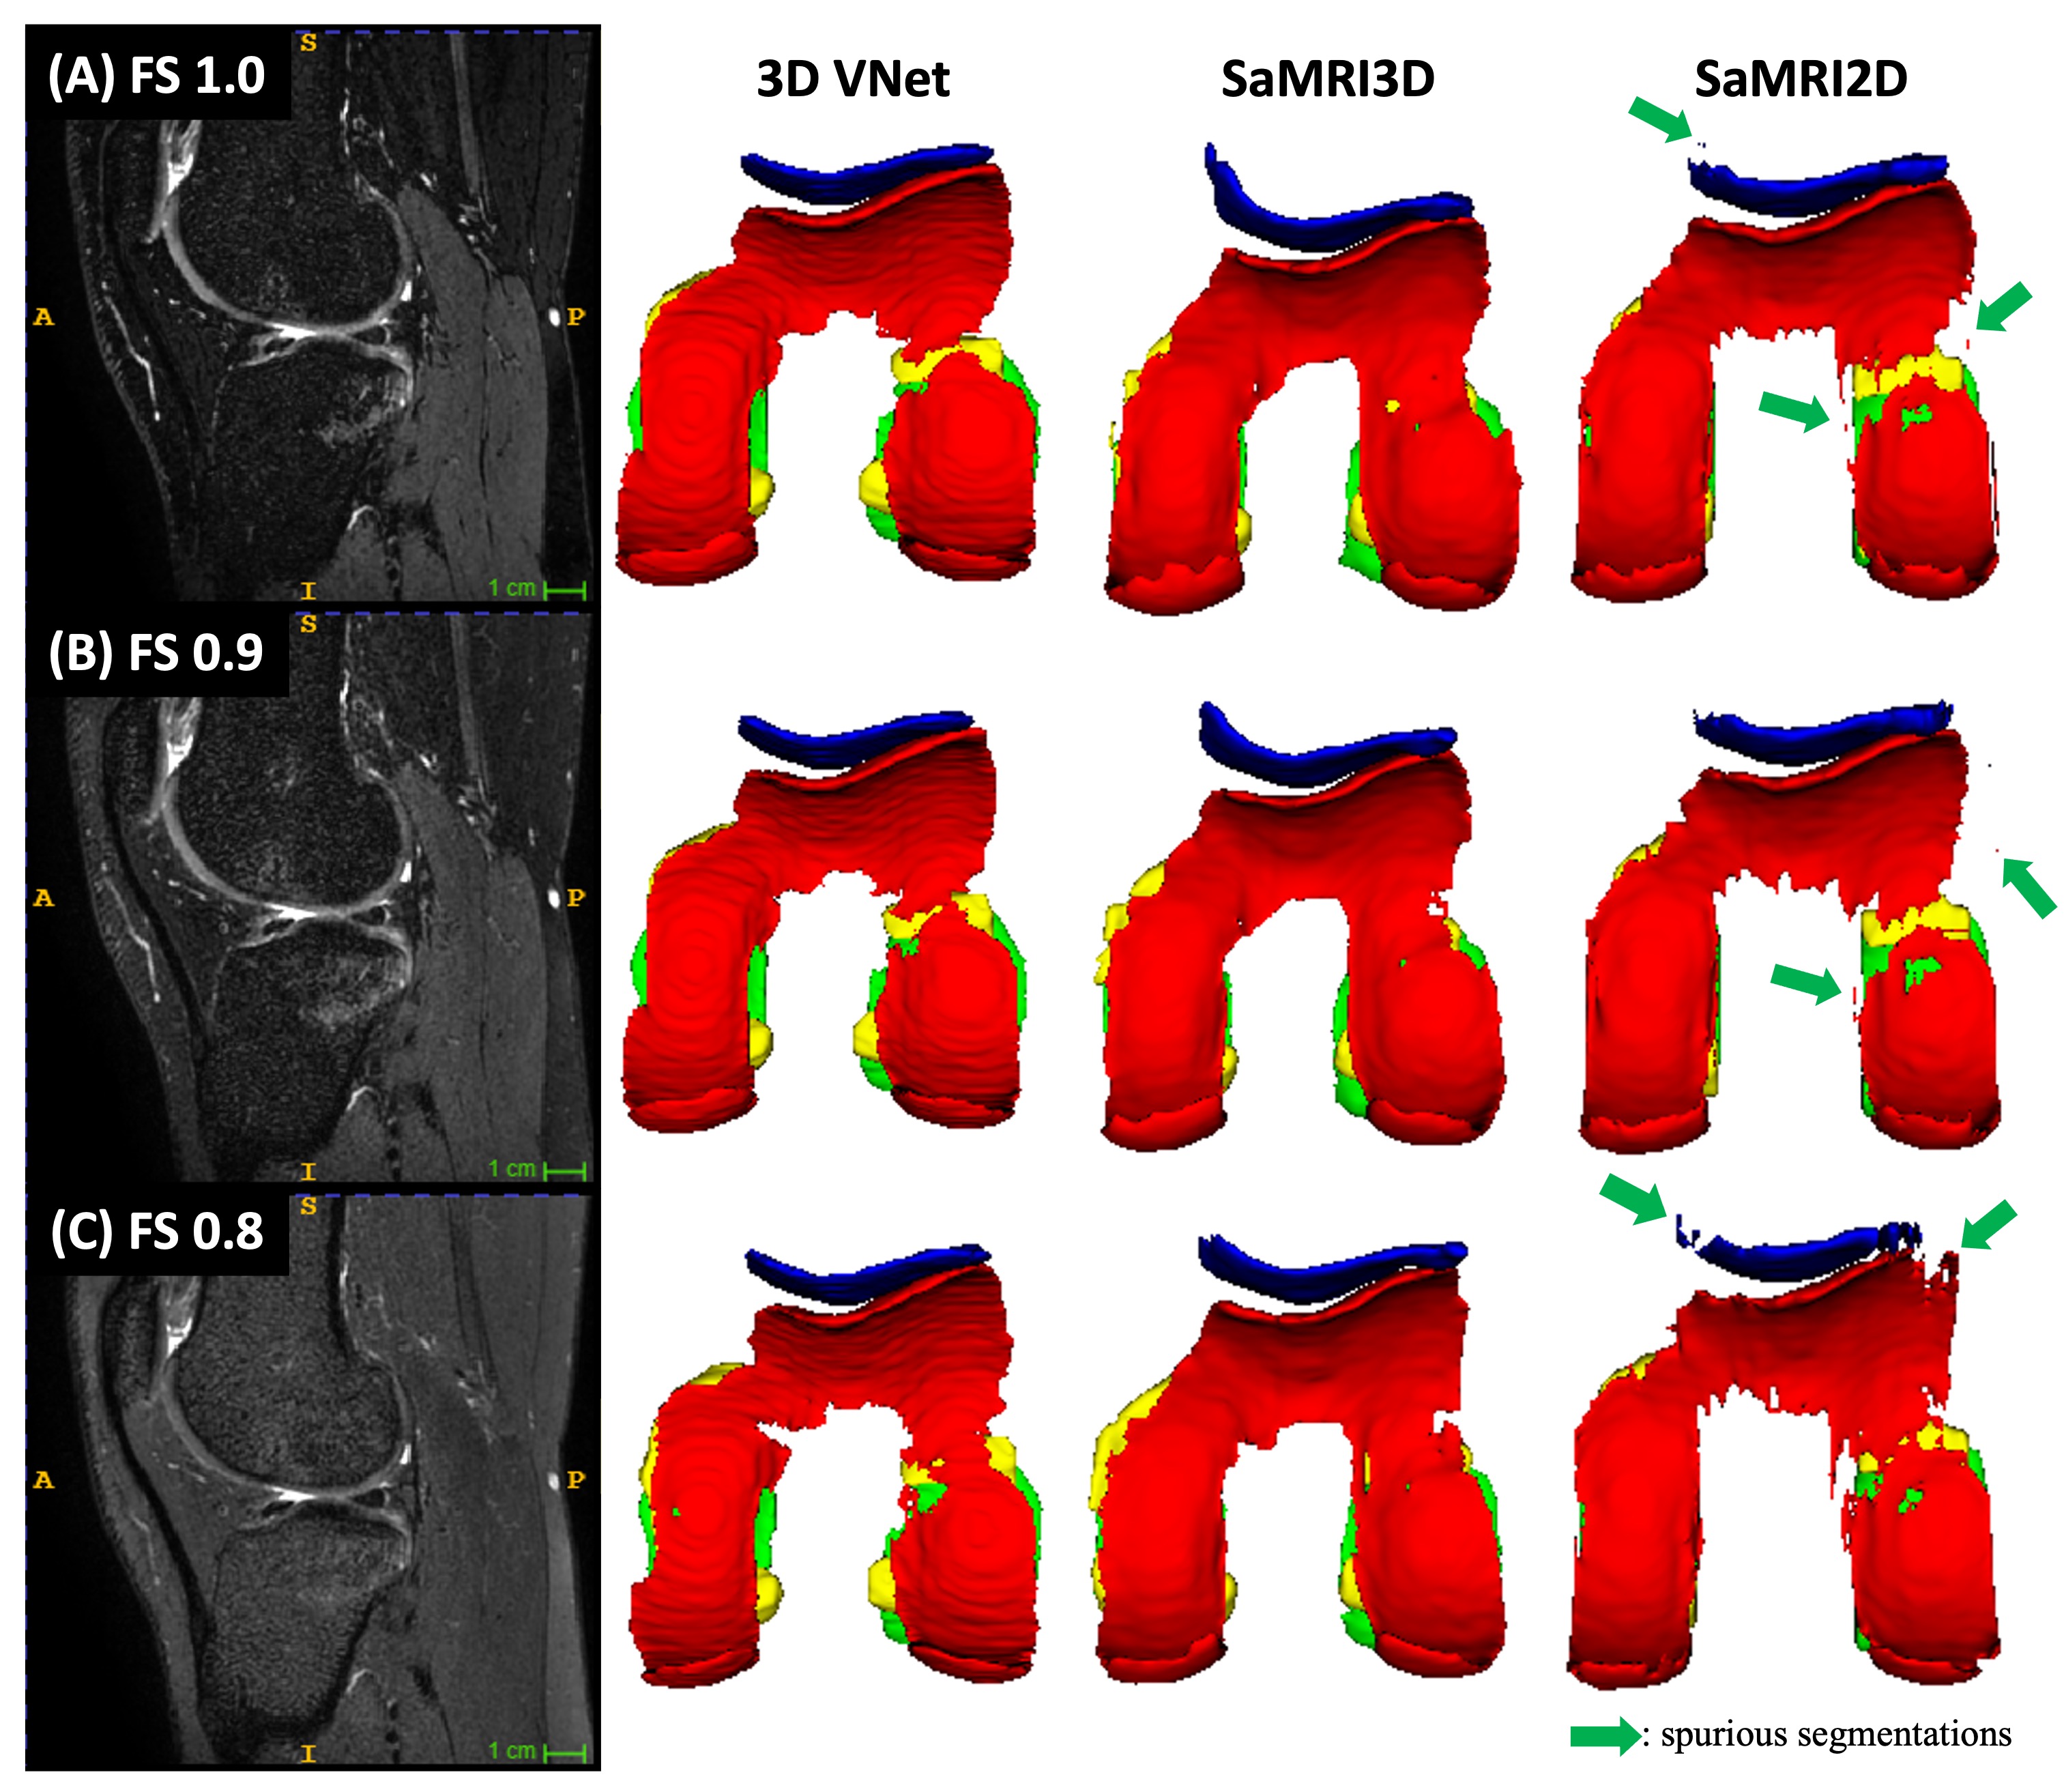
Figure 3: All models trained on fat saturated (FS=1.0) images. This case within the qualitative testset had 3 sequences with different FS settings (left column). Each AI model was inferred on all sequences and the 3D rendering of each output is displayed in the 3 right columns. Yellow = menisci, blue = patellar cartilage, red = femoral, and green = tibial. SaMRI2D, suffers from spurious segmentations possibly due to lack of 3D spatial correlation. The Vnet does not suffer from it, but SaMRI3D appears to generalize better and be more robust to changing FS contrast.
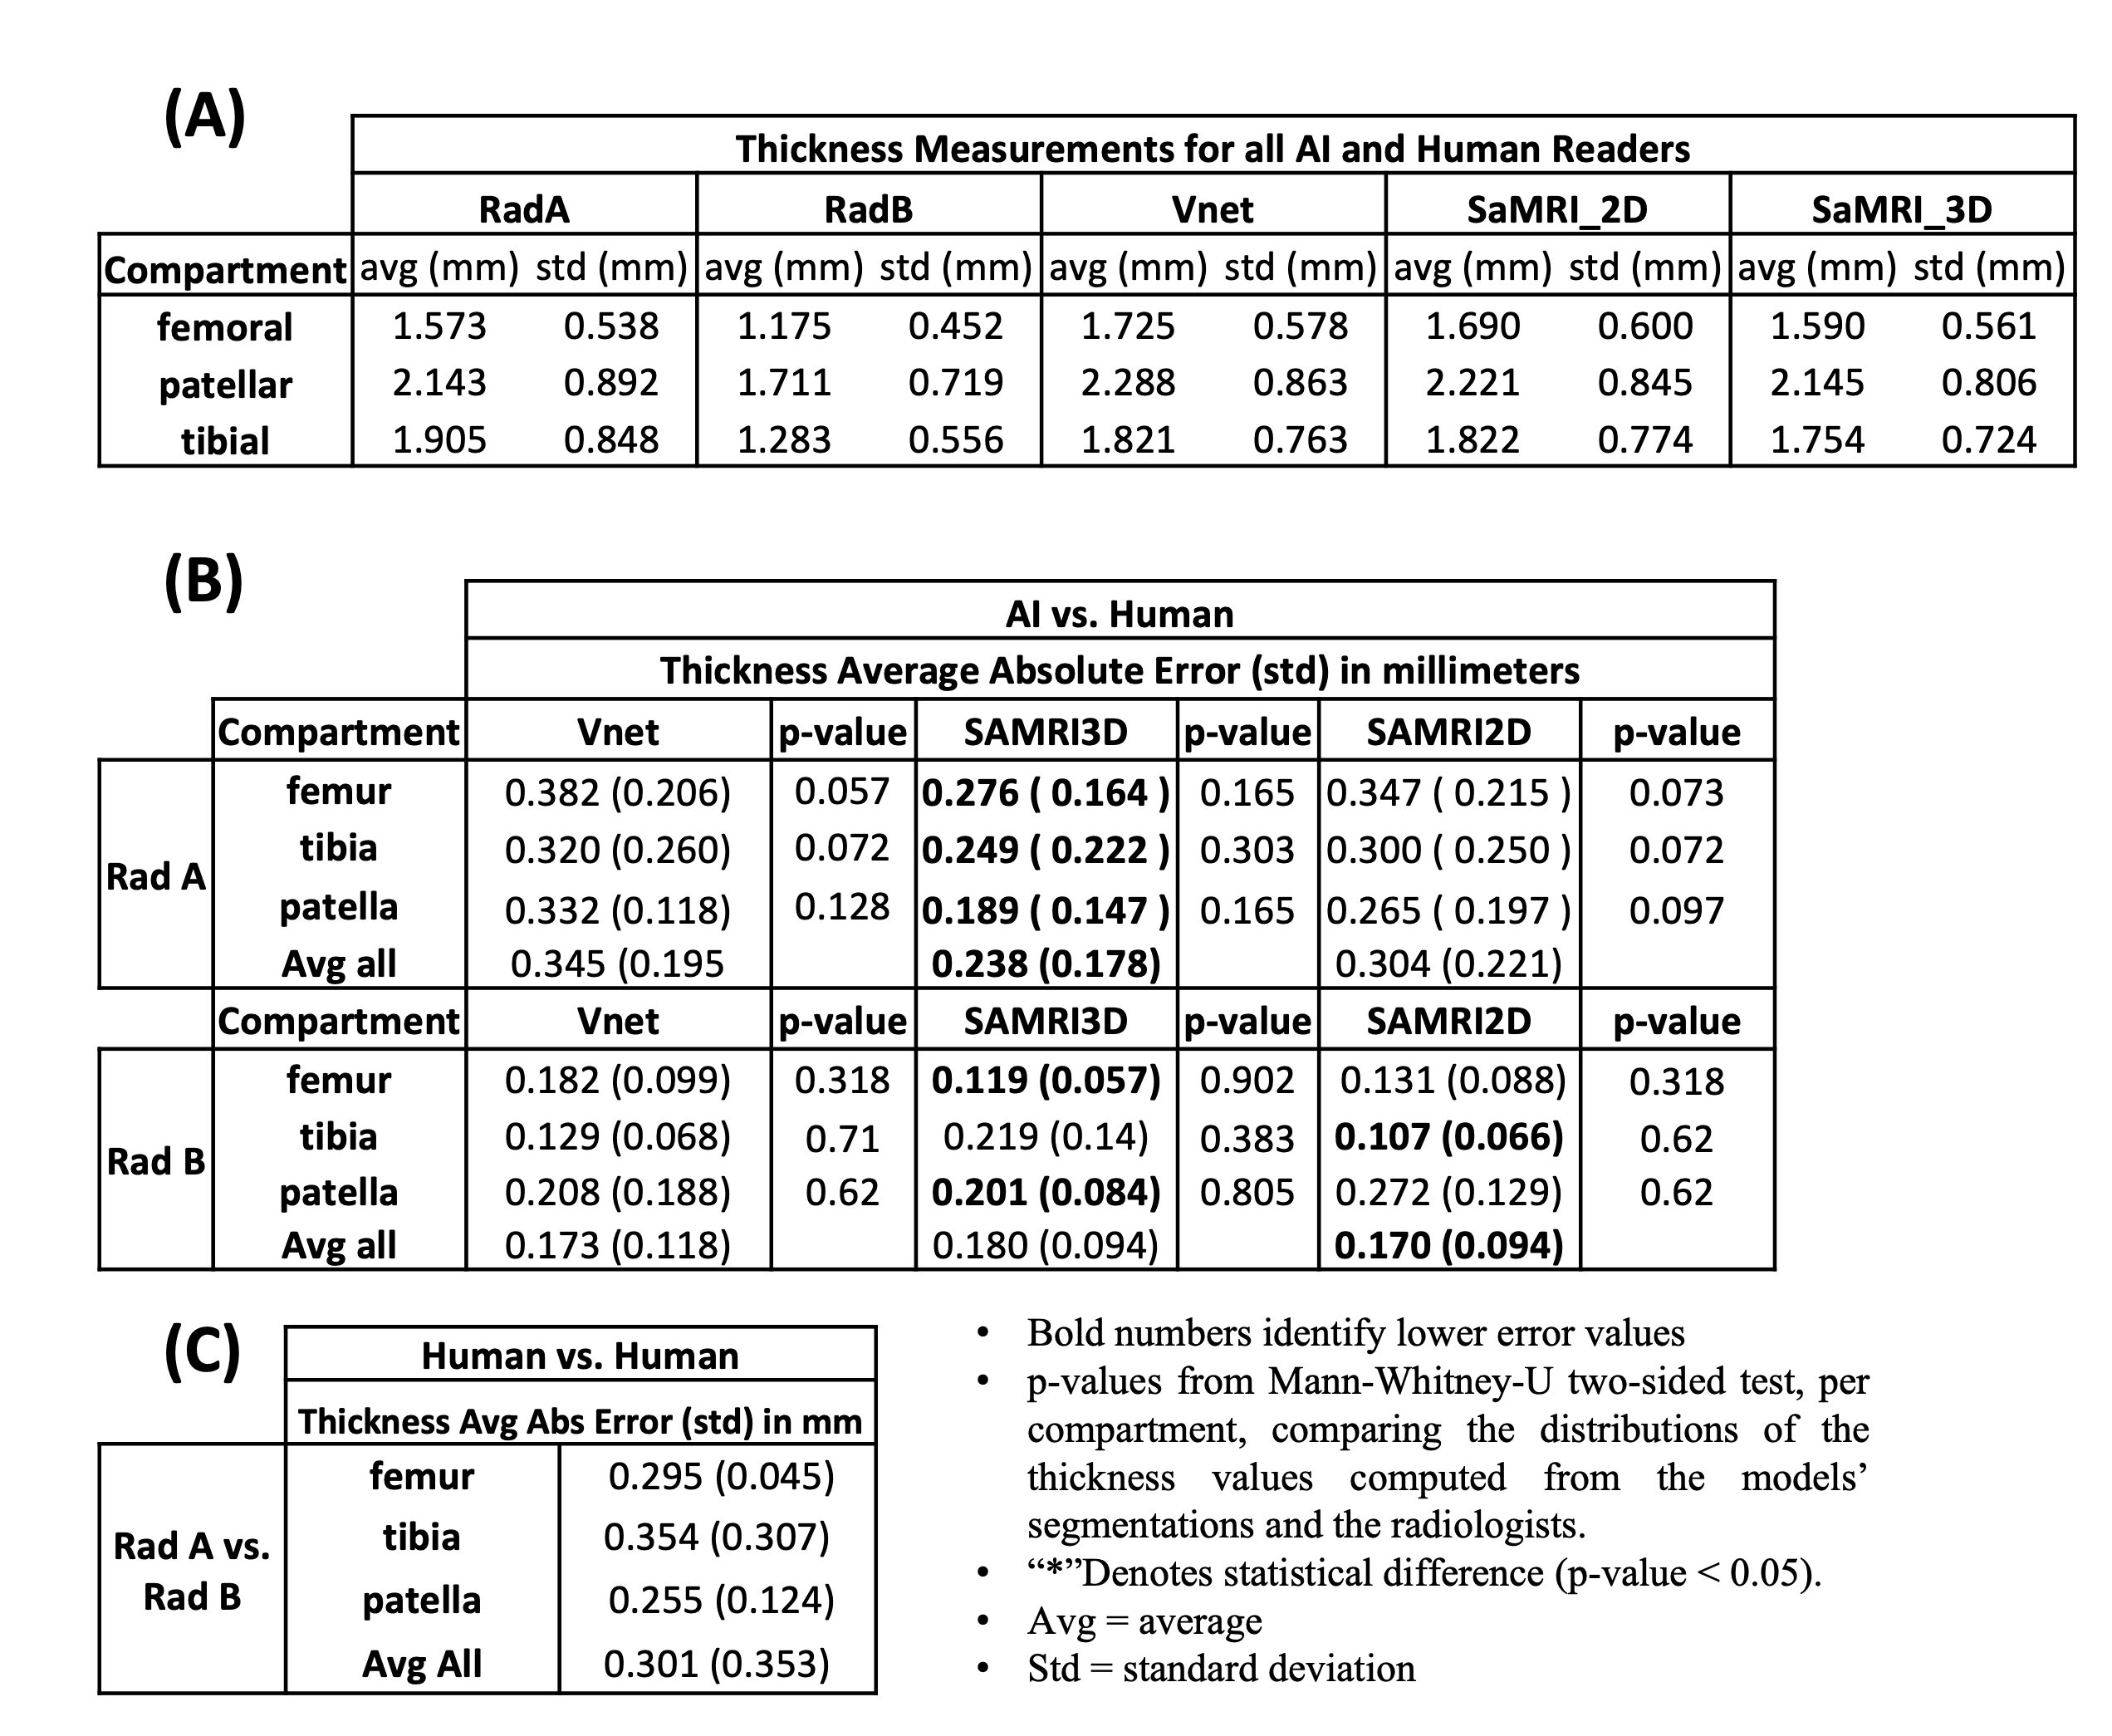
Figure 4: (A) Average cartilage thickness computed based on automated cartilage segmentations and based on two manual segmentations from 2 radiologists, RadA and RadB, for 7 cases. (B) Absolute difference between cartilage thickness computed based on AI models, and RadA and RadB manual segmentations. P-values imply that the difference in the distribution of cartilage thickness values between each model and the radiologists in not significant. (C) Interobserver variability: Absolute difference computed based on the manual segmentations between RadA and RadB.