2214
How Does the Function of “Small” Vessels Change in Small Vessel Disease?: Insights from Multimodal Cerebral Hemodynamics Imaging at High-fields1Institute of Biophysics, Chinese Academy of Sciences, Beijing, China, 2The Innovation Center of Excellence on Brain Science, Chinese Academy of Sciences, Beijing, China, 3University of Chinese Academy of Sciences, Beijing, China, 4Department of Neurology, Peking University First Hospital, Beijing, China, 5Department of Neurology, Peking University People’s Hospital, Beijing, China, 6Department of Radiology, University of Southern California, Los Angeles, CA, United States, 7Siemens Shenzhen Magnetic Resonance Ltd, Shenzhen, China, 8Institute of Artificial Intelligence, Hefei Comprehensive National Science Center, Hefei, China
Synopsis
Keywords: Blood Vessels, Velocity & Flow, small vessel disease, vascular function, cerebral blood flow
Motivation: Given the limitations in resolution and sensitivity, in vivo studies of microvascular function in small vessel disease(SVD) have been notably scarce.
Goal(s): Advanced cerebral-hemodynamic techniques have made it possible to unveil functional alterations in SVD explored in this study.
Approach: Utilizing a comprehensive microvascular-functional measurement, including 7T-high-resolution phase-contrast and 3T-ASL modeling, we examined the hemodynamics change and its associations with severity of SVD reflected by multidomain cognitive impairments.
Results: Flow velocity in lenticulostriate arteries emerged as the most sensitive indicator, while ASL-derived arterial-transit-time(ATT) and cerebral-blood-flow(CBF), reflecting capillary functions, exhibited reduced sensitivity. Our exploration unveiled insights into microvascular pathology and compensatory mechanisms in SVD.
Impact: Utilizing cutting-edge cerebrovascular MRI techniques, multiple
microvascular hemodynamic metrics provide novel insights into small vessel
disease(SVD) pathology in-vivo, revealing the functional damage and compensatory
mechanisms.
Also, flow velocity in small arteries is proved a promising imaging marker
for SVD progression.
Introduction
Small vessel diseases (SVD) are a group of disorders that result from pathological alteration of the small vessels in the brain, including small arteries, veins and capillaries1,2. However, the difficulty in visualizing small vessels in vivo hampered the research into the pathophysiological mechanisms of SVD3.Advancements of MRI techniques, such as 7T phase-contrast (PC) imaging for directly measuring flow velocity in small arteries4,5, and arterial spin labeling (ASL) modeling for tissue capillary perfusion6, has shed light on investigation to the function of cerebral microvascular system in SVD. Nevertheless, preliminary studies yielded contradictory findings, such as whether reduction in PC-measured velocity of perforating arteries occurred4,7 and whether ASL-derived cerebral blood flow (CBF) and arterial transit-time (ATT) correlated with clinical characteristics8,9. These discrepancies may arise from the reduced comparability due to the lack of comprehensive assessment of multiple hemodynamic parameters within the same patient. Moreover, leveraging well-established neuropsychological tests covering multiple cognitive domains can evaluate disease progression at a finer granularity10,11.
On these bases, this study employed multimodal vascular functional imaging techniques, including high-resolution PC at 7T and pseudo-continuous ASL (pCASL) at 3T12, to assess the alteration of cerebral hemodynamics in cerebral autosomal dominant arteriopathy with subcortical infarcts and leukoencephalopathy (CADASIL), the most common monogenic SVD. Further, investigating its association with disease progression by fine-grained cognitive impairment to unveil potential mechanisms of vascular dysfunction in CADASIL.
Methods
Thirty CADASIL patients were approved to underwent clinical evaluation and MR examinations on 7T Terrafit MRI system (Siemens, Erlangen, Germany) with 32-channel head coil (NOVA medical, USA), and 3T Prisma MRI system with 64-channel head coil.Flow velocity measurements in the proximal segment of lenticulostriate arteries (LSA) were conducted using a specialized PC-based acquisition and analysis workflow developed in-house4. CBF and ATT were calculated using FSL-BASIL based on pCASL13, and analysis was performed using two ROIs generated by SPM12 including cortical gray matter (CGM) and deep nuclei (DGM)14. Due to the space limitation, sequence parameters and neuropsychological assessment metrics are listed in Table 1.1&1.2.
Results
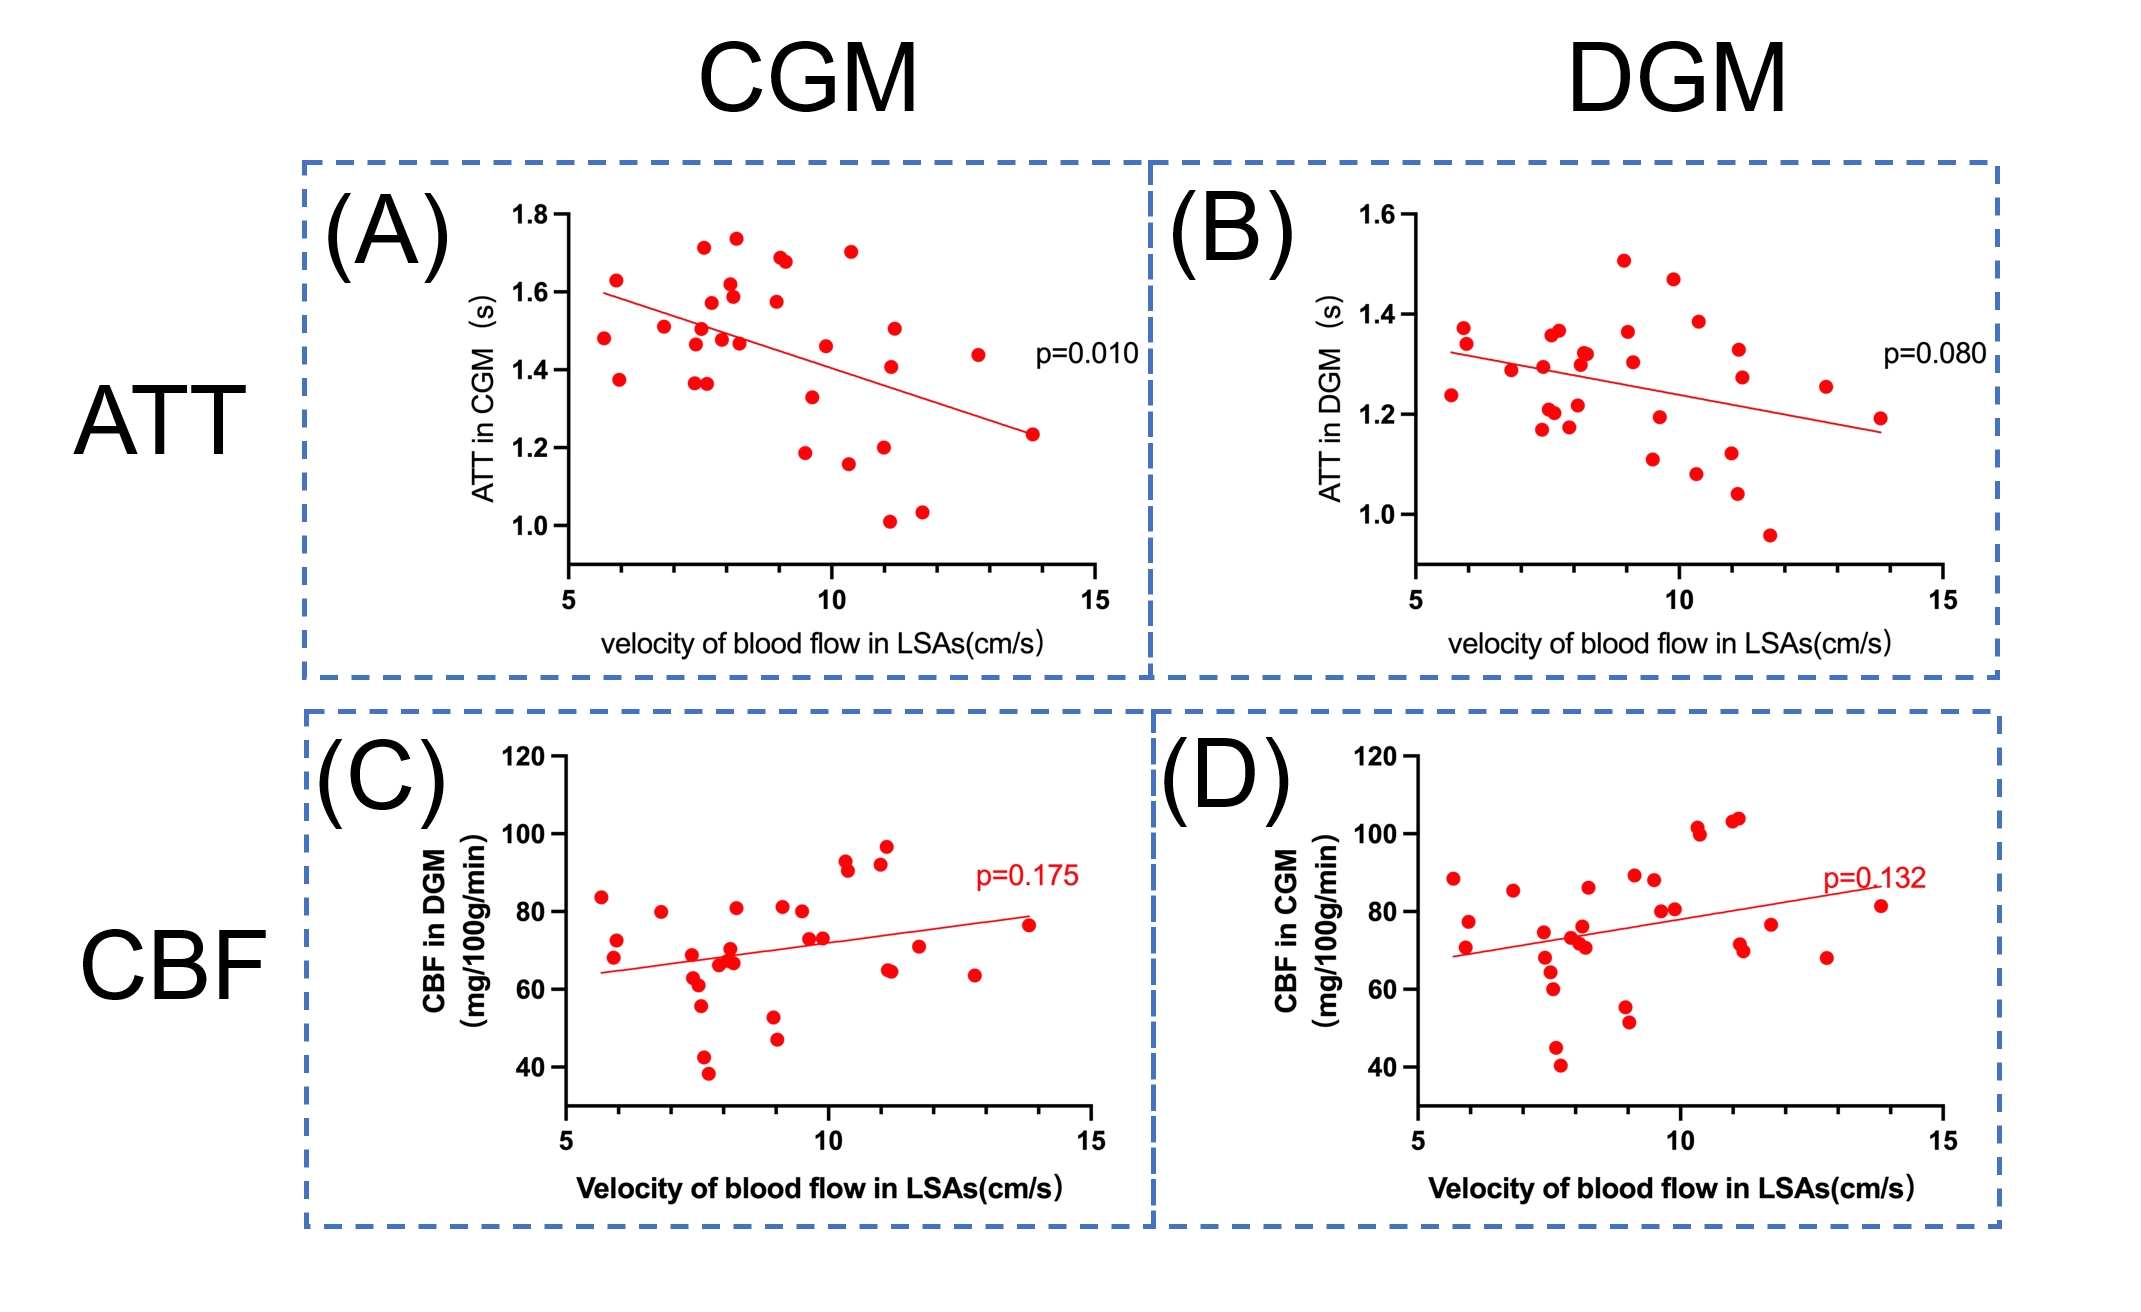
Previous findings4 regarding decline in LSA velocity and its association with MRI lesions and general cognitive changes were confirmed and not reiterated in this abstract.Correlation analysis showed that LSA velocity is associated with all six cognitive metrics including memory, attention and executive function, while ATT in CGM and DGM are related with four and three of them, and CBF showed no significant correlations.
Moreover, after adjusting for age and education years, LSA velocity still independently correlated with functions in all three cognitive domains, while only ATT in CGM correlated with attention performance.
Due to space limitations, detailed statistics were provided in Tables.2.
Discussion
Our study found that LSA velocity is a sensitive indicator for severity of CADASIL. Specifically, it was independently associated with cognitive impairments in multiple domains, including attention, memory, and executive function. In contrast, global ATT prolongation was also associated with cognitive performance in certain domains, albeit to a lesser extent, while no correlation was observed between CBF and any cognitive function. Interestingly, our analysis of the relationships among hemodynamic parameters also revealed a significant correlation between LSA velocity and ATT, while no such correlation exists with CBF.(Figure.4)Our imaging findings correspond with theories of progressive microvascular lesions and compensatory mechanisms established in pathological studies1. CADASIL manifested as the loss of vascular smooth-muscle cells, and thus, direct involvement of small arteries, represented by LSA. At the distal end, it caused decline in tissue perfusion across the entire brain, which is vital for oxygen and energy supply.
Compensatory mechanisms are initiated to maintain stable CBF, but as a consequence, ATT is prolonged due to increased involvement of collateral pathways and vascular reserve15,16. In line with results of this study, compensatory mechanisms prevents CBF from closely tracking the downstream cognitive impairment, reducing the sensitivity of ATT, while LSA flow velocity, as a direct representation of small arterial pathology, can still sensitively detect changes in disease severity.
Longitudinal studies designed to illuminate causation is needed to confirm the exact role of vascular dysfunction in SVD pathogenesis.
Conclusion
Our study has, for the first time, in vivo unveiled bilevel vascular dysfunction in small arteries and capilluries and corresponding compensatory mechanisms in the progress of SVD by utilizing multimodal hemodynamic measurement techniques, including 7T-PC and 3T-ASL. Notably, LSA blood flow velocity, as representative of small arterial pathology, was high-lightened as a potential biomarker to sensitively gauge the severity of SVD.Acknowledgements
This work was supported in part by National Natural Science Foundation of China (82271985, 82001804, 81961128030), Youth Innovation Promotion Association CAS (2022093), National Science and Technology Innovation 2030 Major Program (2022ZD0211900, 2022ZD0211901), Ministry of Science and Technology of China grant (2019YFA0707103), and National Nature Science Foundation of China grant (31730039).References
1. Pantoni L. Cerebral small vessel disease: from pathogenesis and clinical characteristics to therapeutic challenges. The Lancet Neurology. 2010;9(7):689-701. doi:10.1016/S1474-4422(10)70104-6
2. ter Telgte A, van Leijsen EMC, Wiegertjes K, Klijn CJM, Tuladhar AM, de Leeuw FE. Cerebral small vessel disease: from a focal to a global perspective. Nat Rev Neurol. 2018;14(7):387-398. doi:10.1038/s41582-018-0014-y
3. Benjamin P, Viessmann O, MacKinnon AD, Jezzard P, Markus HS. 7 Tesla MRI in Cerebral Small Vessel Disease. International Journal of Stroke. 2015;10(5):659-664. doi:10.1111/ijs.12490
4. Sun C, Wu Y, Ling C, et al. Reduced blood flow velocity in lenticulostriate arteries of patients with CADASIL assessed by PC-MRA at 7T. J Neurol Neurosurg Psychiatry. 2022;93(4):451-452. doi:10.1136/jnnp-2021-326258
5. Bouvy WH, Geurts LJ, Kuijf HJ, et al. Assessment of blood flow velocity and pulsatility in cerebral perforating arteries with 7‐T quantitative flow MRI. NMR Biomed. 2016;29(9):1295-1304. doi:10.1002/nbm.3306
6. Neumann K, Günther M, Düzel E, Schreiber S. Microvascular Impairment in Patients With Cerebral Small Vessel Disease Assessed With Arterial Spin Labeling Magnetic Resonance Imaging: A Pilot Study. Front Aging Neurosci. 2022;14:871612. doi:10.3389/fnagi.2022.871612
7. Geurts LJ, Zwanenburg JJM, Klijn CJM, Luijten PR, Biessels GJ. Higher Pulsatility in Cerebral Perforating Arteries in Patients With Small Vessel Disease Related Stroke, a 7T MRI Study. Stroke. 2019;50(1):62-68. doi:10.1161/STROKEAHA.118.022516
8. Onkenhout L, Appelmans N, Kappelle LJ, et al. Cerebral Perfusion and the Burden of Small Vessel Disease in Patients Referred to a Memory Clinic. CED. 2020;49(5):481-486. doi:10.1159/000510969
9. Ling C, Zhang J, Shao X, et al. Diffusion prepared pseudo-continuous arterial spin labeling reveals blood–brain barrier dysfunction in patients with CADASIL. Eur Radiol. Published online April 26, 2023. doi:10.1007/s00330-023-09652-7
10. Bäckman L, Jones S, Berger AK, Laukka EJ, Small BJ. Multiple cognitive deficits during the transition to Alzheimer’s disease. Journal of Internal Medicine. 2004;256(3):195-204. doi:10.1111/j.1365-2796.2004.01386.x
11. Leeuwis AE, Benedictus MR, Kuijer JPA, et al. Lower cerebral blood flow is associated with impairment in multiple cognitive domains in Alzheimer’s disease. Alzheimer’s & Dementia. 2017;13(5):531-540. doi:10.1016/j.jalz.2016.08.013
12. Alsop DC, Detre JA, Golay X, et al. Recommended implementation of arterial spin-labeled perfusion MRI for clinical applications: A consensus of the ISMRM perfusion study group and the European consortium for ASL in dementia. Magnetic Resonance in Medicine. 2015;73(1):102-116. doi:10.1002/mrm.25197
13. Chappell MA, Groves AR, Whitcher B, Woolrich MW. Variational Bayesian Inference for a Nonlinear Forward Model. IEEE Trans Signal Process. 2009;57(1):223-236. doi:10.1109/TSP.2008.2005752
14. Tzourio-Mazoyer N, Landeau B, Papathanassiou D, et al. Automated Anatomical Labeling of Activations in SPM Using a Macroscopic Anatomical Parcellation of the MNI MRI Single-Subject Brain. NeuroImage. 2002;15(1):273-289. doi:10.1006/nimg.2001.0978
15. Wierenga CE, Hays CC, Zlatar ZZ. Cerebral blood flow measured by arterial spin labeling MRI as a preclinical marker of Alzheimer’s disease. J Alzheimers Dis. 2014;42 Suppl 4(Suppl 4):S411-419. doi:10.3233/JAD-141467
16. MacIntosh BJ, Lindsay AC, Kylintireas I, et al. Multiple inflow pulsed arterial spin-labeling reveals delays in the arterial arrival time in minor stroke and transient ischemic attack. AJNR Am J Neuroradiol. 2010;31(10):1892-1894. doi:10.3174/ajnr.A2008
Figures
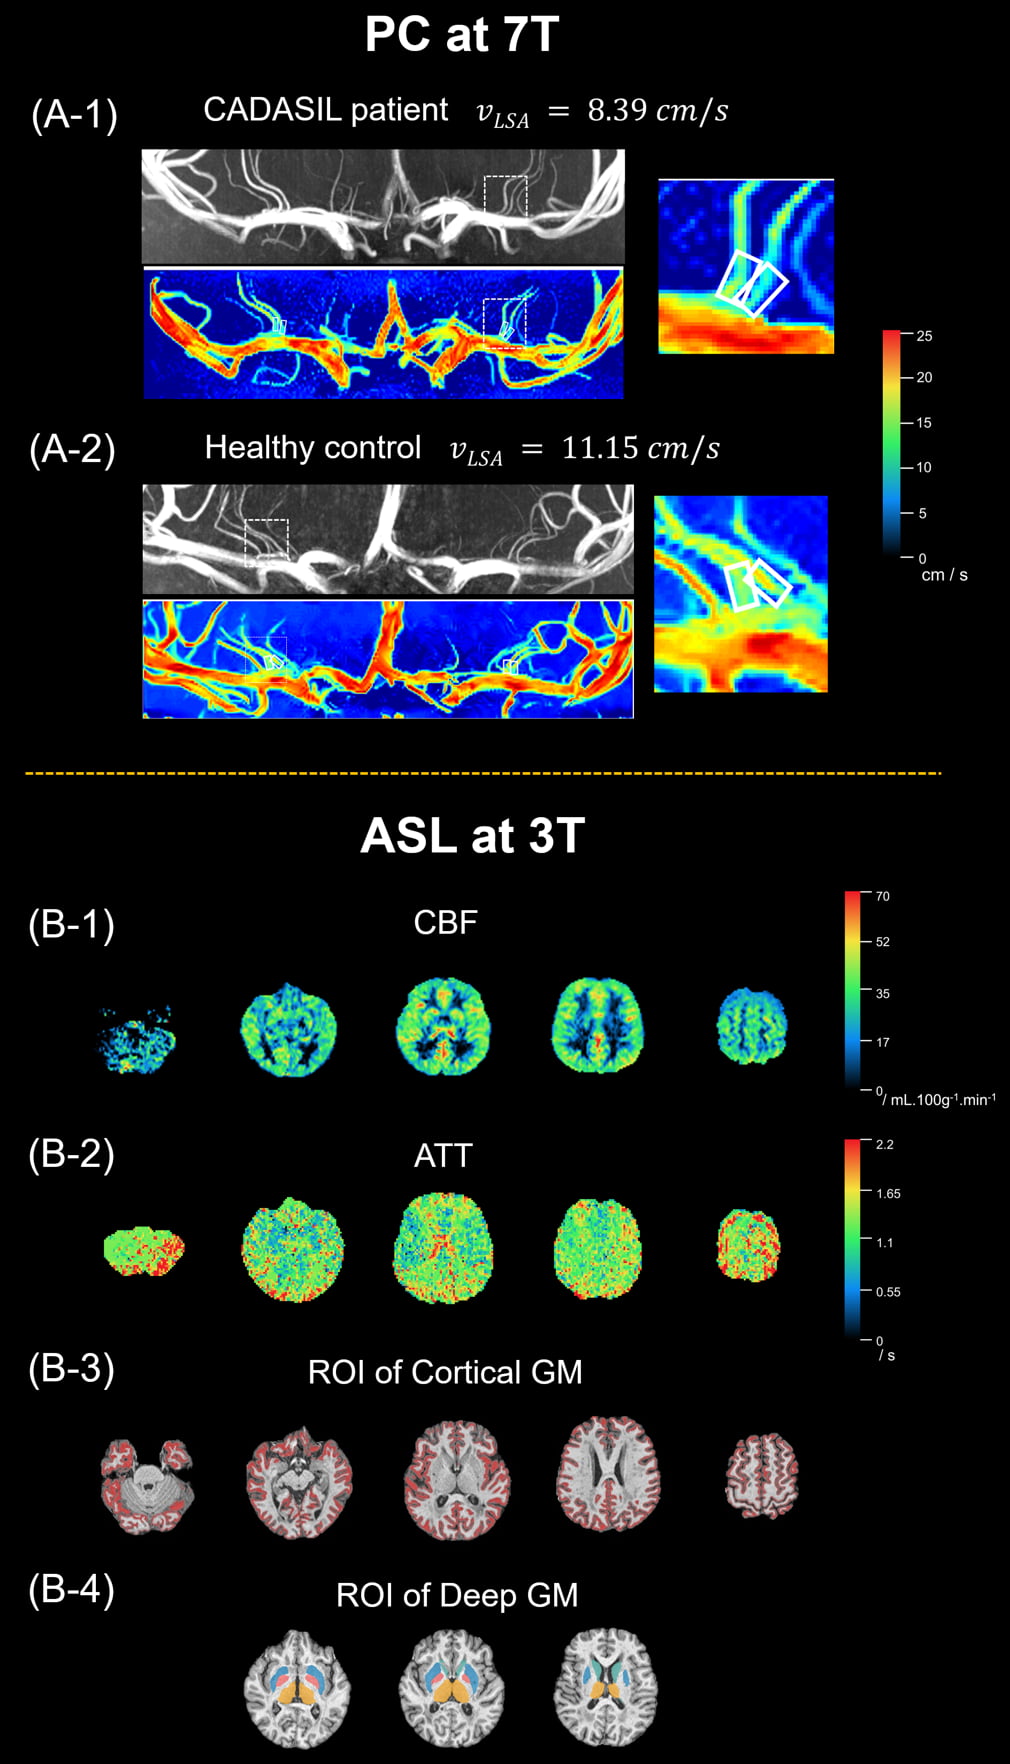
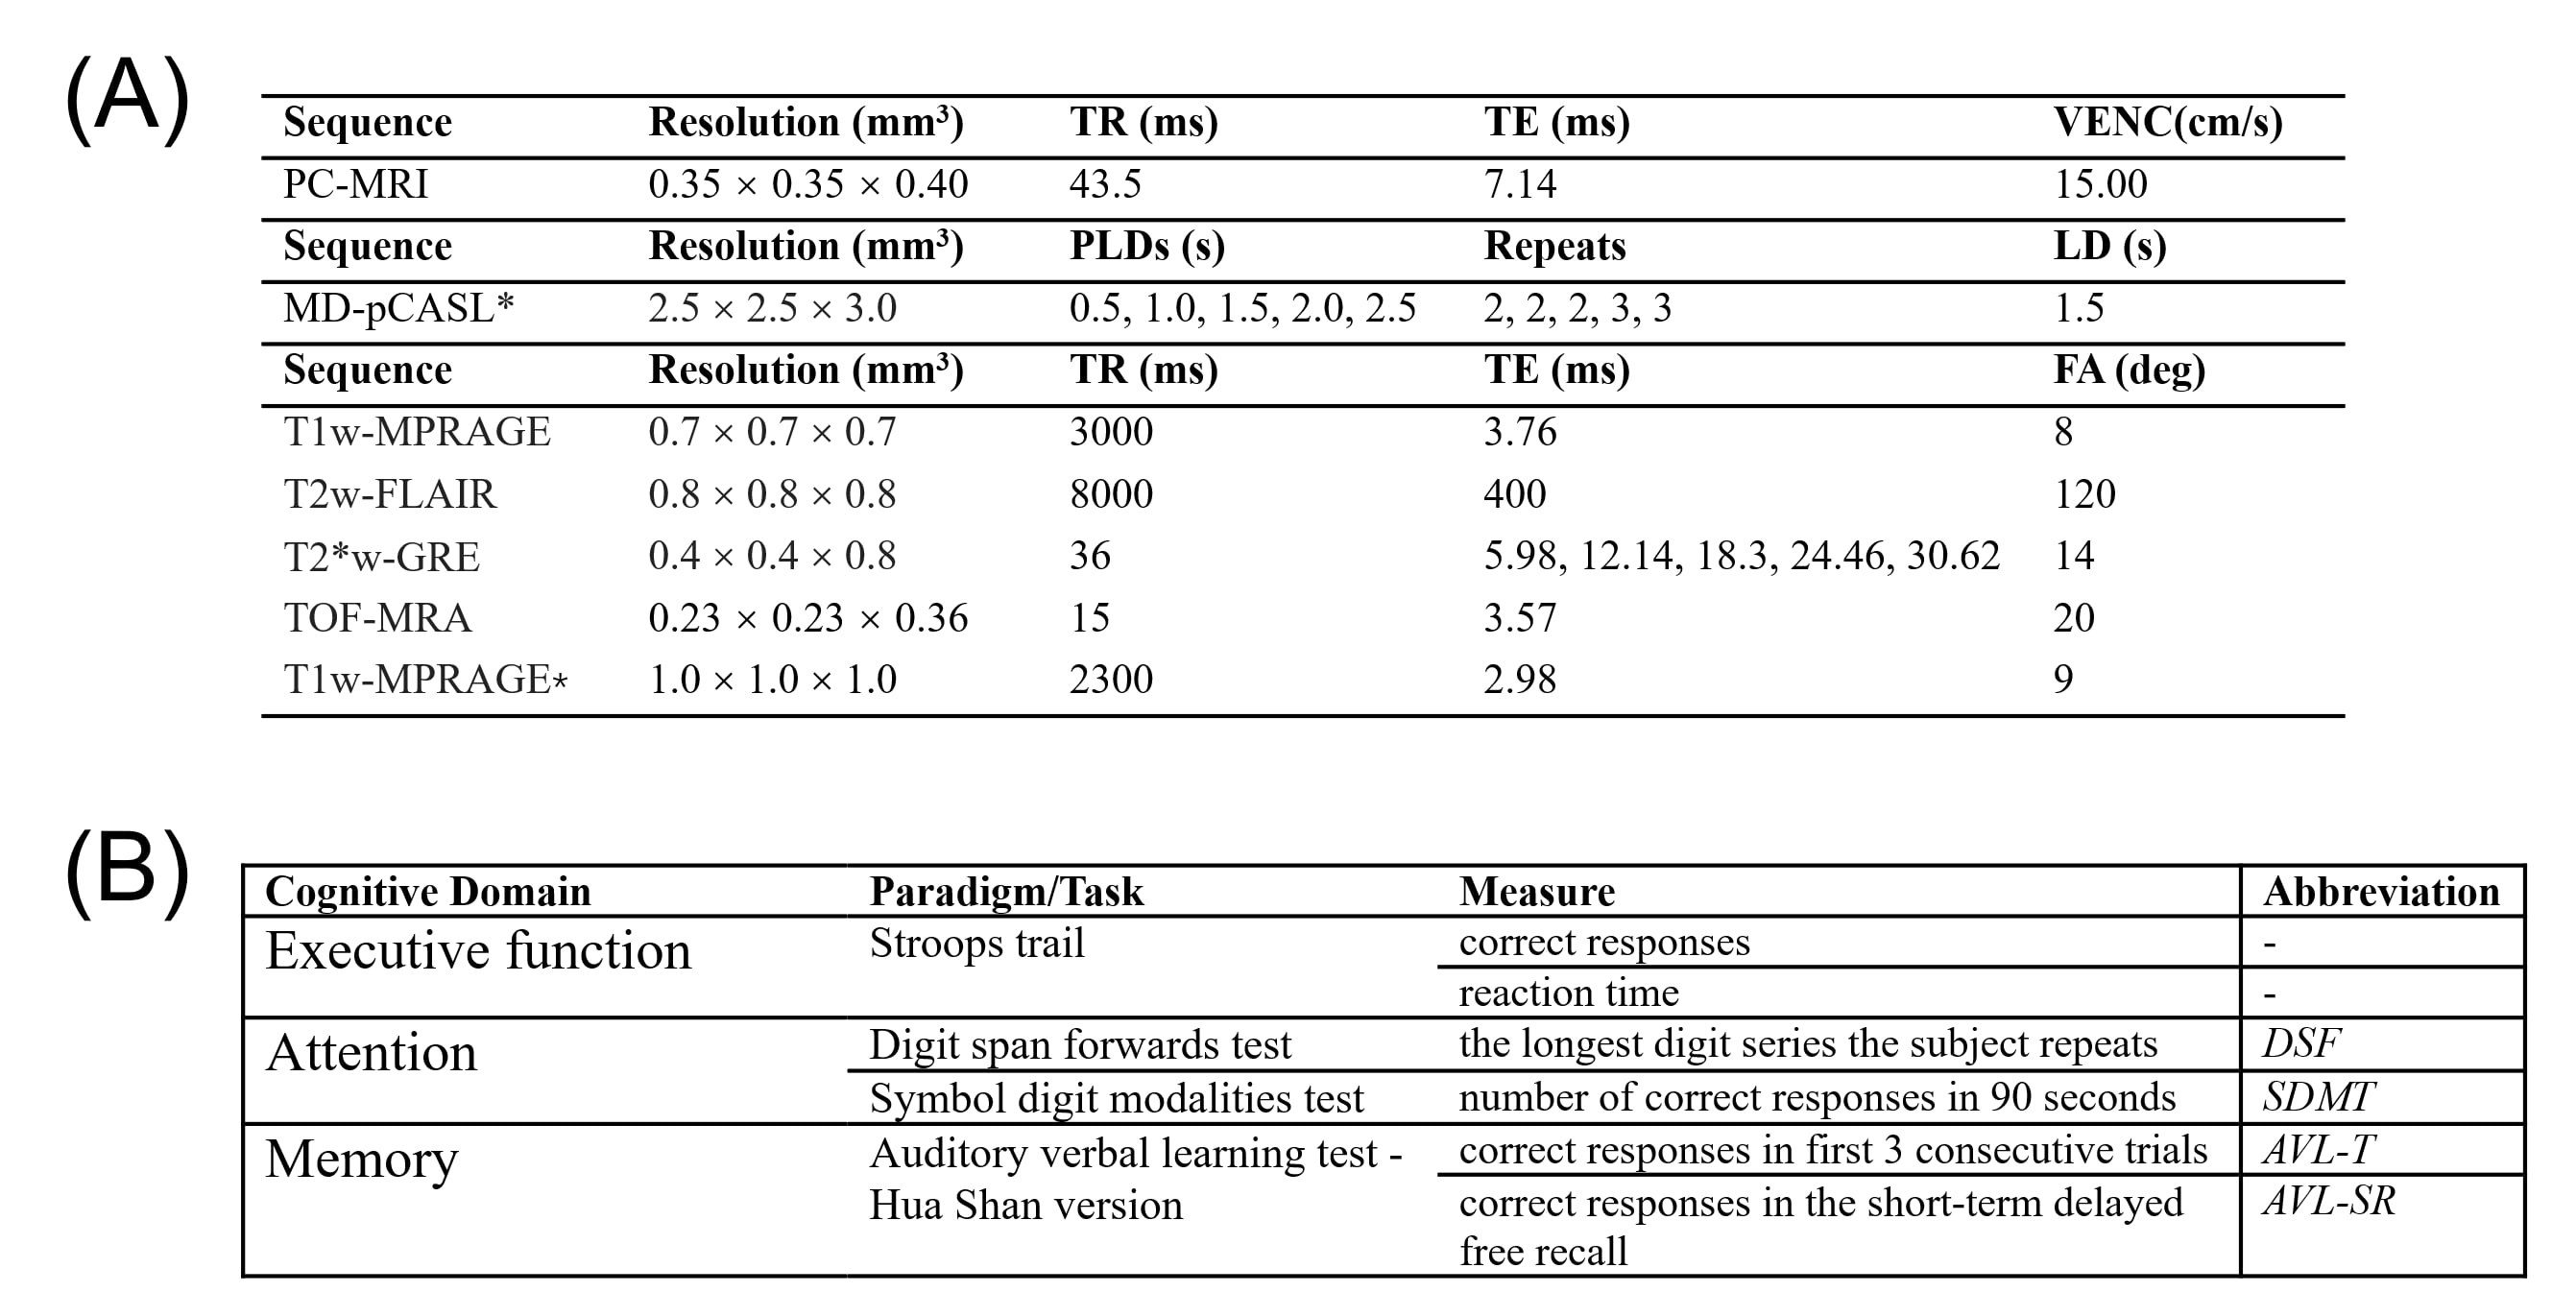
Table 1. (A) Key MRI sequence parameters used in this study. (B) List of test metrics for multidomain cognitive function assessment.
Note: In Table (a), an asterisk (*) denotes data acquired using 3T MRI, while the rest were acquired using 7T MRI.
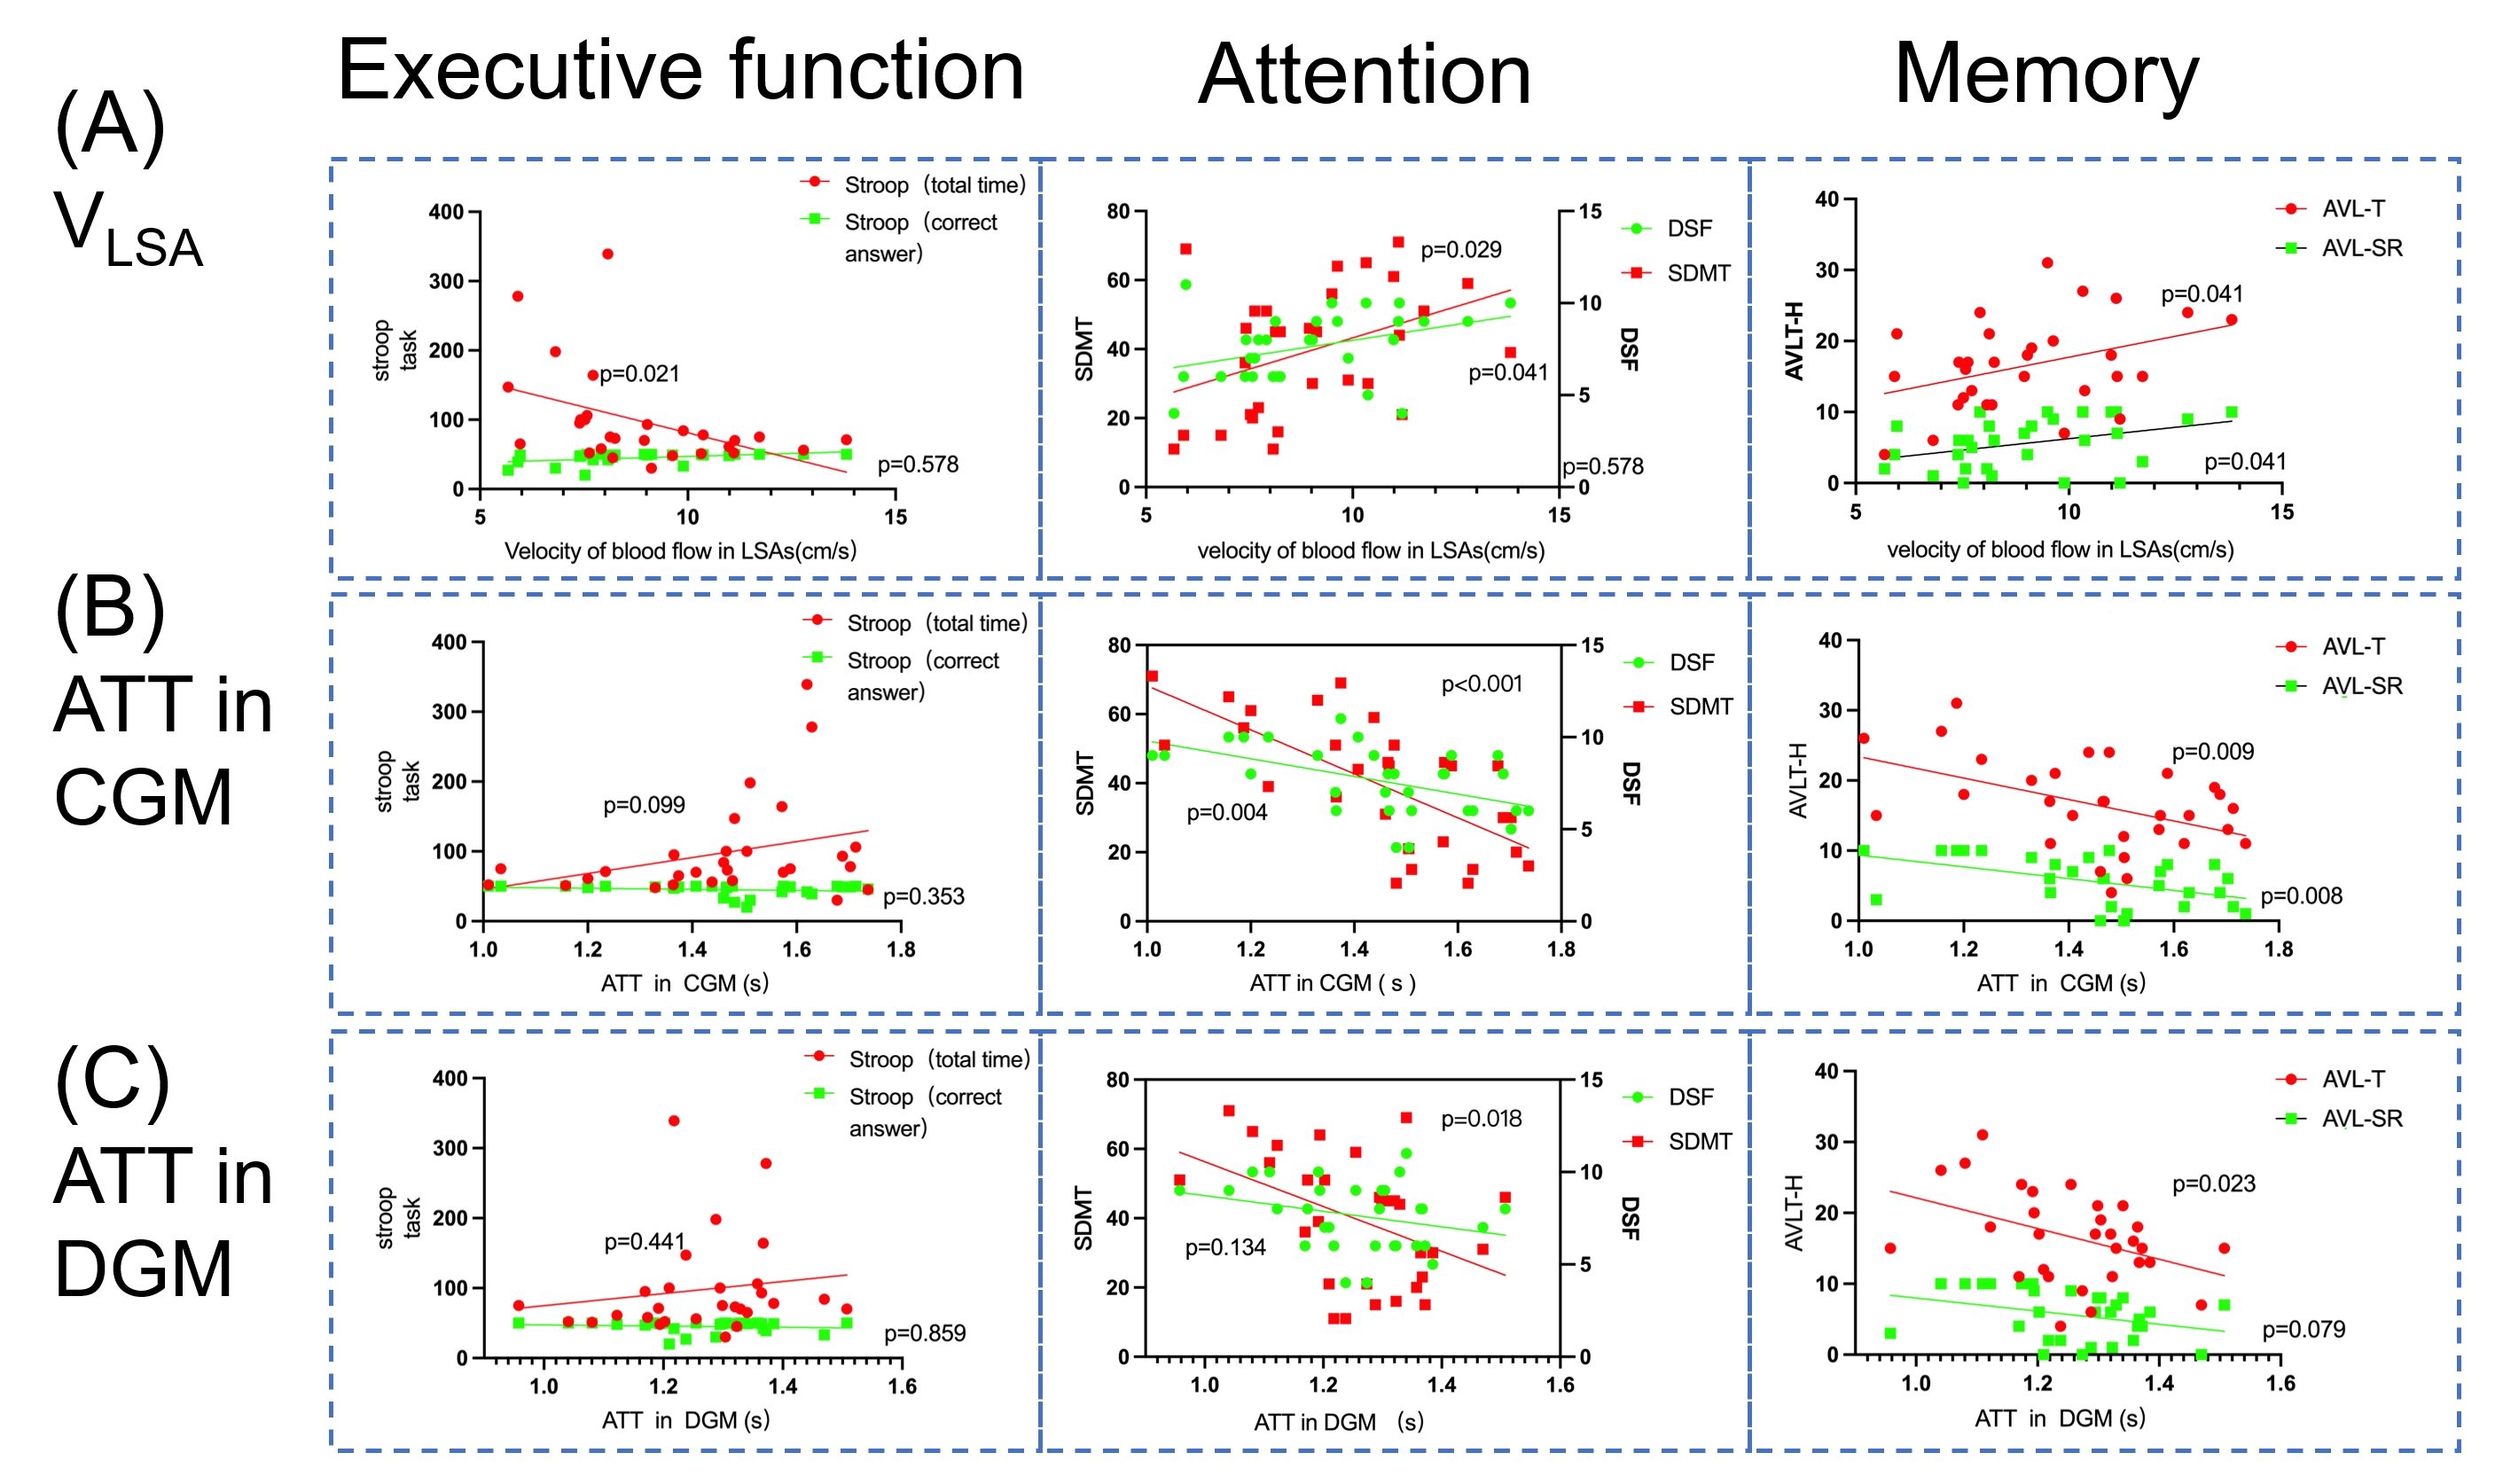
Figure 2. Correlations between vascular function indicators, including (A) flow velocity in lenticulostriate arteries (vLSA), arterial transit time (ATT) located in (B) cortical gray matter(CGM) and (C) deep nuclei(DGM) regions, and multi-domain cognitive assessments including executive function (left), attention (middle) and memory (right panel).
Note: It can be seen from Table 2 that there is no correlation between CBF and cognitive function, so it is not shown here; abbreviations can be found in Table 1 (B).
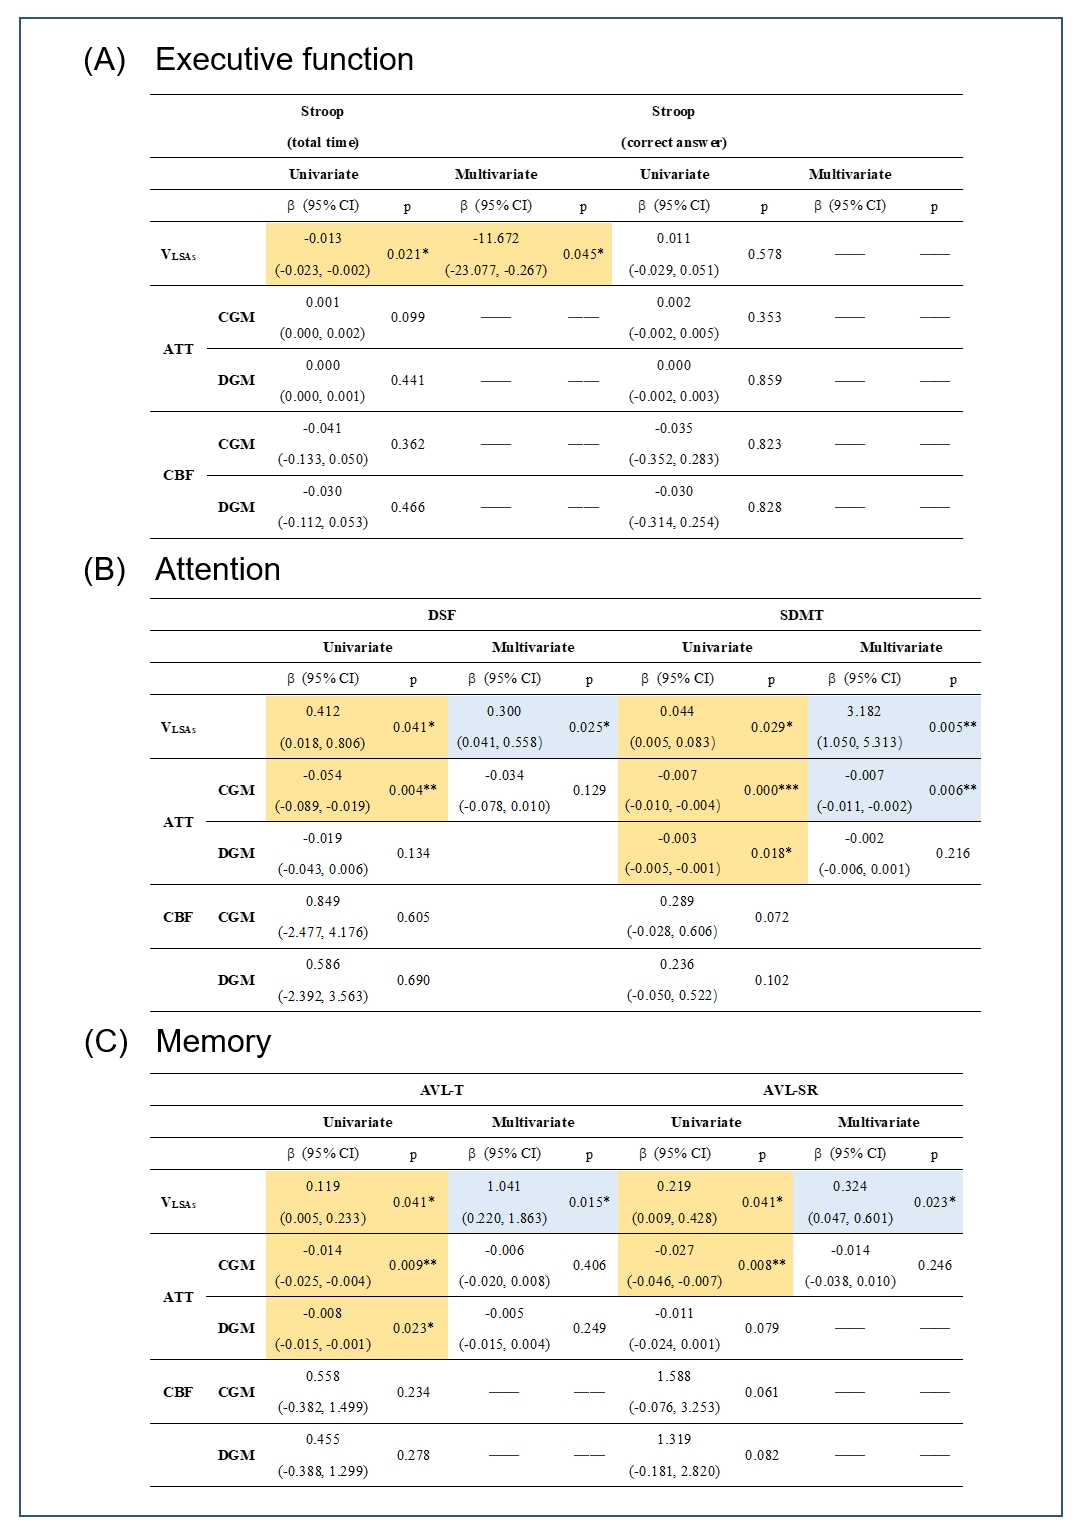
Table 2. Detailed statistics of correlation analysis between vascular function indicators and multi-cognitive domain functions including (A) executive function, (B) attention, and (C) memory based on univariate and multivariate linear regression.
The significant results of univariate regression are marked with a light yellow background, and the significant results of multivariable regression after adjusting for age and education years are marked with a light blue background. The sensitivity of indicators can also be intuitively found from the number of color patches.