2212
Experimental catheter validation of stenotic pressure drops with vWERP using 4D Flow MRI1Department of Medical Physics, University of Greifswald, Greifswald, Germany, 2Department of Radiology, Northwestern University Feinberg School of Medicine, Chicago, IL, United States, 3Institute of Fluid Mechanics, University of Rostock, Rostock, Germany, 4Department of Molecular Medicine and Surgery,, Karolinska Institutet, Solna, Sweden, 5Institute for Medical Engineering and Science, Massachusetts Institute of Technology, Cambridge, MA, United States
Synopsis
Keywords: Blood Vessels, Atherosclerosis
Motivation: 4D flow MRI is a promising diagnosis tool for studies on intracranial atherosclerosis. Since pressure drops across stenoses could be used for diagnosis, a robust non-invasive technique for regional pressure variations is of great value.
Goal(s): To validate stenotic pressure drops estimated using Virtual Work Energy Relative Pressure (vWERP) while taking into account spatial resolution dependency and turbulence.
Approach: Relative pressure was estimated at multiple locations in two different stenoses using vWERP and compared with gold-standad catheter measurements. Additionally, tubulent kinetic energy (TKE) was determined.
Results: vWERP provided robust estimates of relative pressure and demonstrated excellent agreement with catheter measurements despite high TKE.
Impact: This abstract demonstrates a versatile setup to estimate relative pressure in stenoses at pulsatile flow conditions. The influence of spatial resolution and turbulences were investigated. The results may help to implement non-invasive pressure estimations to the clinical routine.
Background:
4D flow magnetic resonance imaging (MRI) has been successfully applied to measure hemodynamic parameters of intracranial stenoses1. Recently, a new method for calculating relative pressure from 4D Flow MRI was introduced, denoted the Virtual Work-Energy Relative Pressure (vWERP) method2. This technique provides robust estimates of regional pressure variations and demonstrated excellent agreement with invasive aortic catheter measurements2. However, previous computational fluid dynamics (CFD) studies have indicated that vWERP based pressure estimations are directly dependent on the spatial resolution relative to vessel size3. Up to now, however, no in-vitro measurements have been performed to confirm these effects experimentally. In addition, turbulence is well known as an additional error source for pressure estimation. In the aorta its influence on the vWERP output has already been published4, however, its impact on measurements near stenoses has yet to be investigated. In this abstract, we present a setup for studying the influence of spatial resolution on the output of the vWERP algorithm and the effect of turbulence under pulsatile flow conditions in a stenosis phantom. The results are compared with gold-standard pressure catheter measurements.Methods:
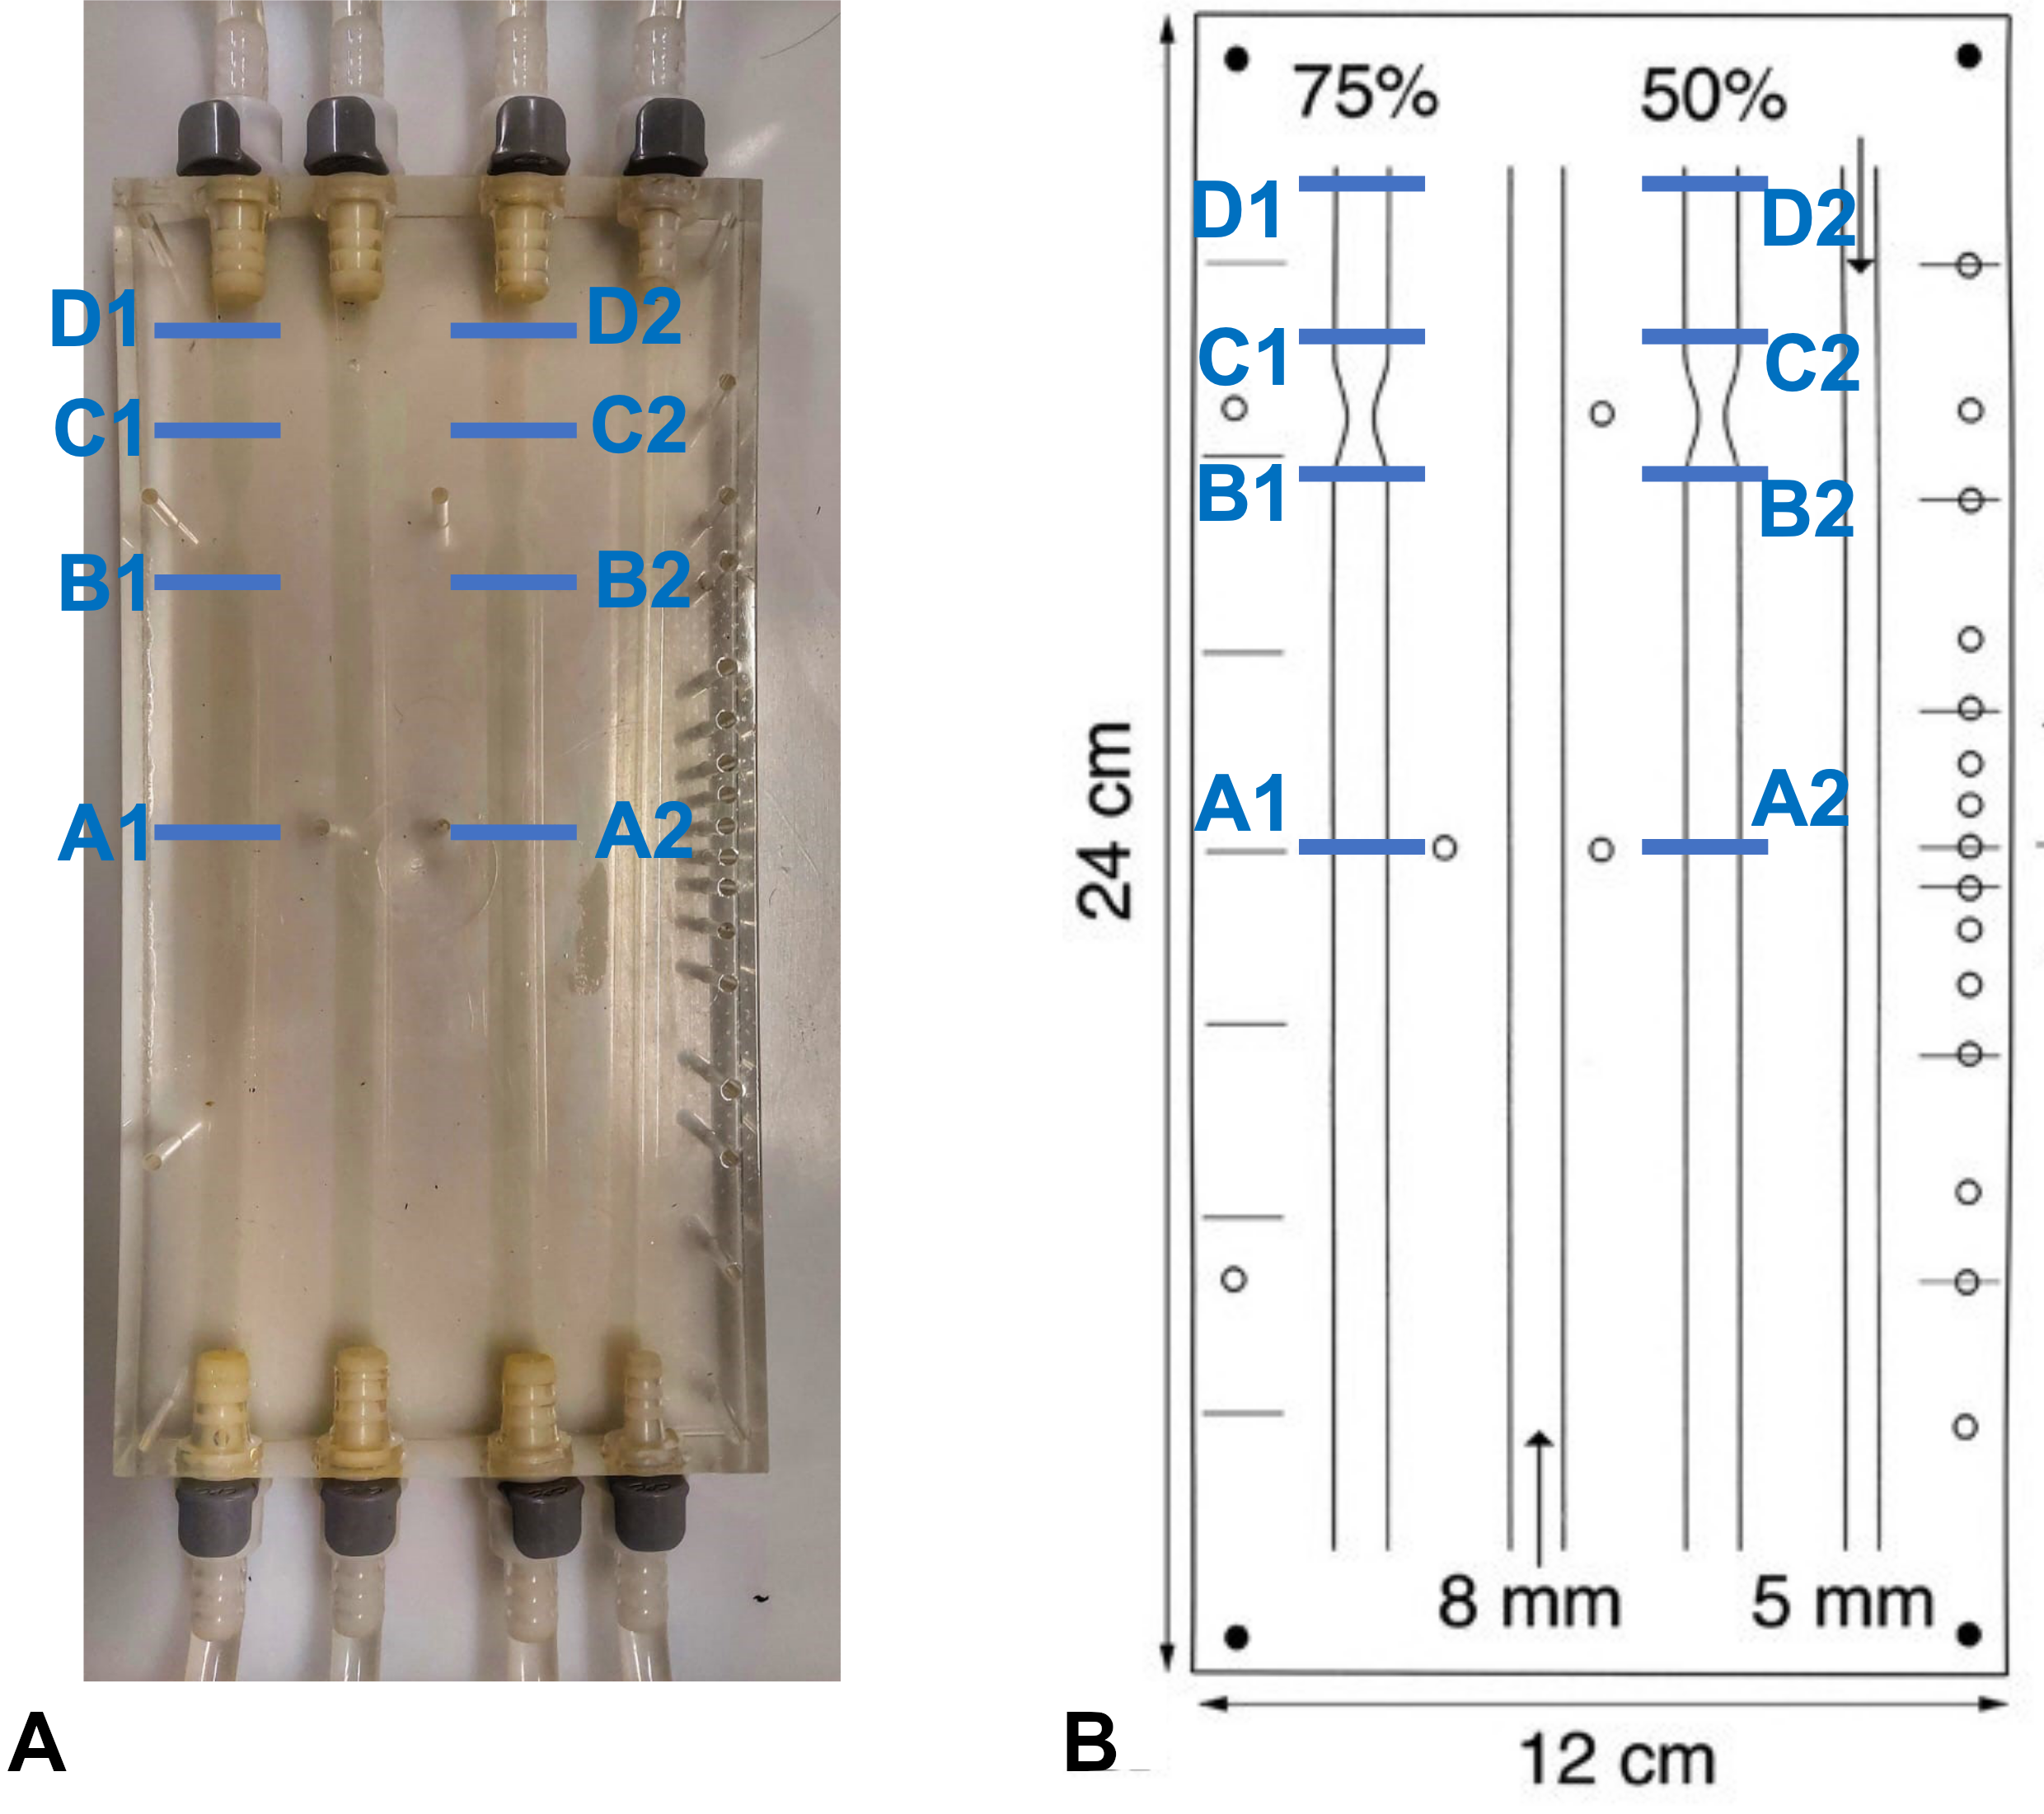
A 4-channel 24x12cm silicon phantom was used: Three channels with a diameter of 8mm: one without stenosis, one with 50% stenosis, one with 75% stenosis and a fourth channel of 5mm without stenosis (Fig.1)5.A ViVitro Superpump (ViVitro Labs, Victoria, Canada) provided a pulsatile flow of 0.17L/min. For triggering, an additional circuit was connected to the pump to elongate the 5V TTL signal time to 10ms. A blood-mimicking solution (60% water and 40% glycerol, viscosity: 0.003kg/(m*s), density: 1100kg/m3) was used. Gadovist 0.1mol/ml (Bayer, Leverkusen, Germany) was added to this solution (≈ 0.2% by volume)6.
An SPR-330 Mikro-Tip® 3F pressure catheter (Millar Instruments, Houston, USA) connected to a PowerLab 16/35 data acquisition system (PowerLab, ADInstruments, Australia) was inserted into four different positions (Fig.1): Upstream (remote: A1/A2, close: B1/B2); downstream (close: C1/C2, remote: D1/D2).
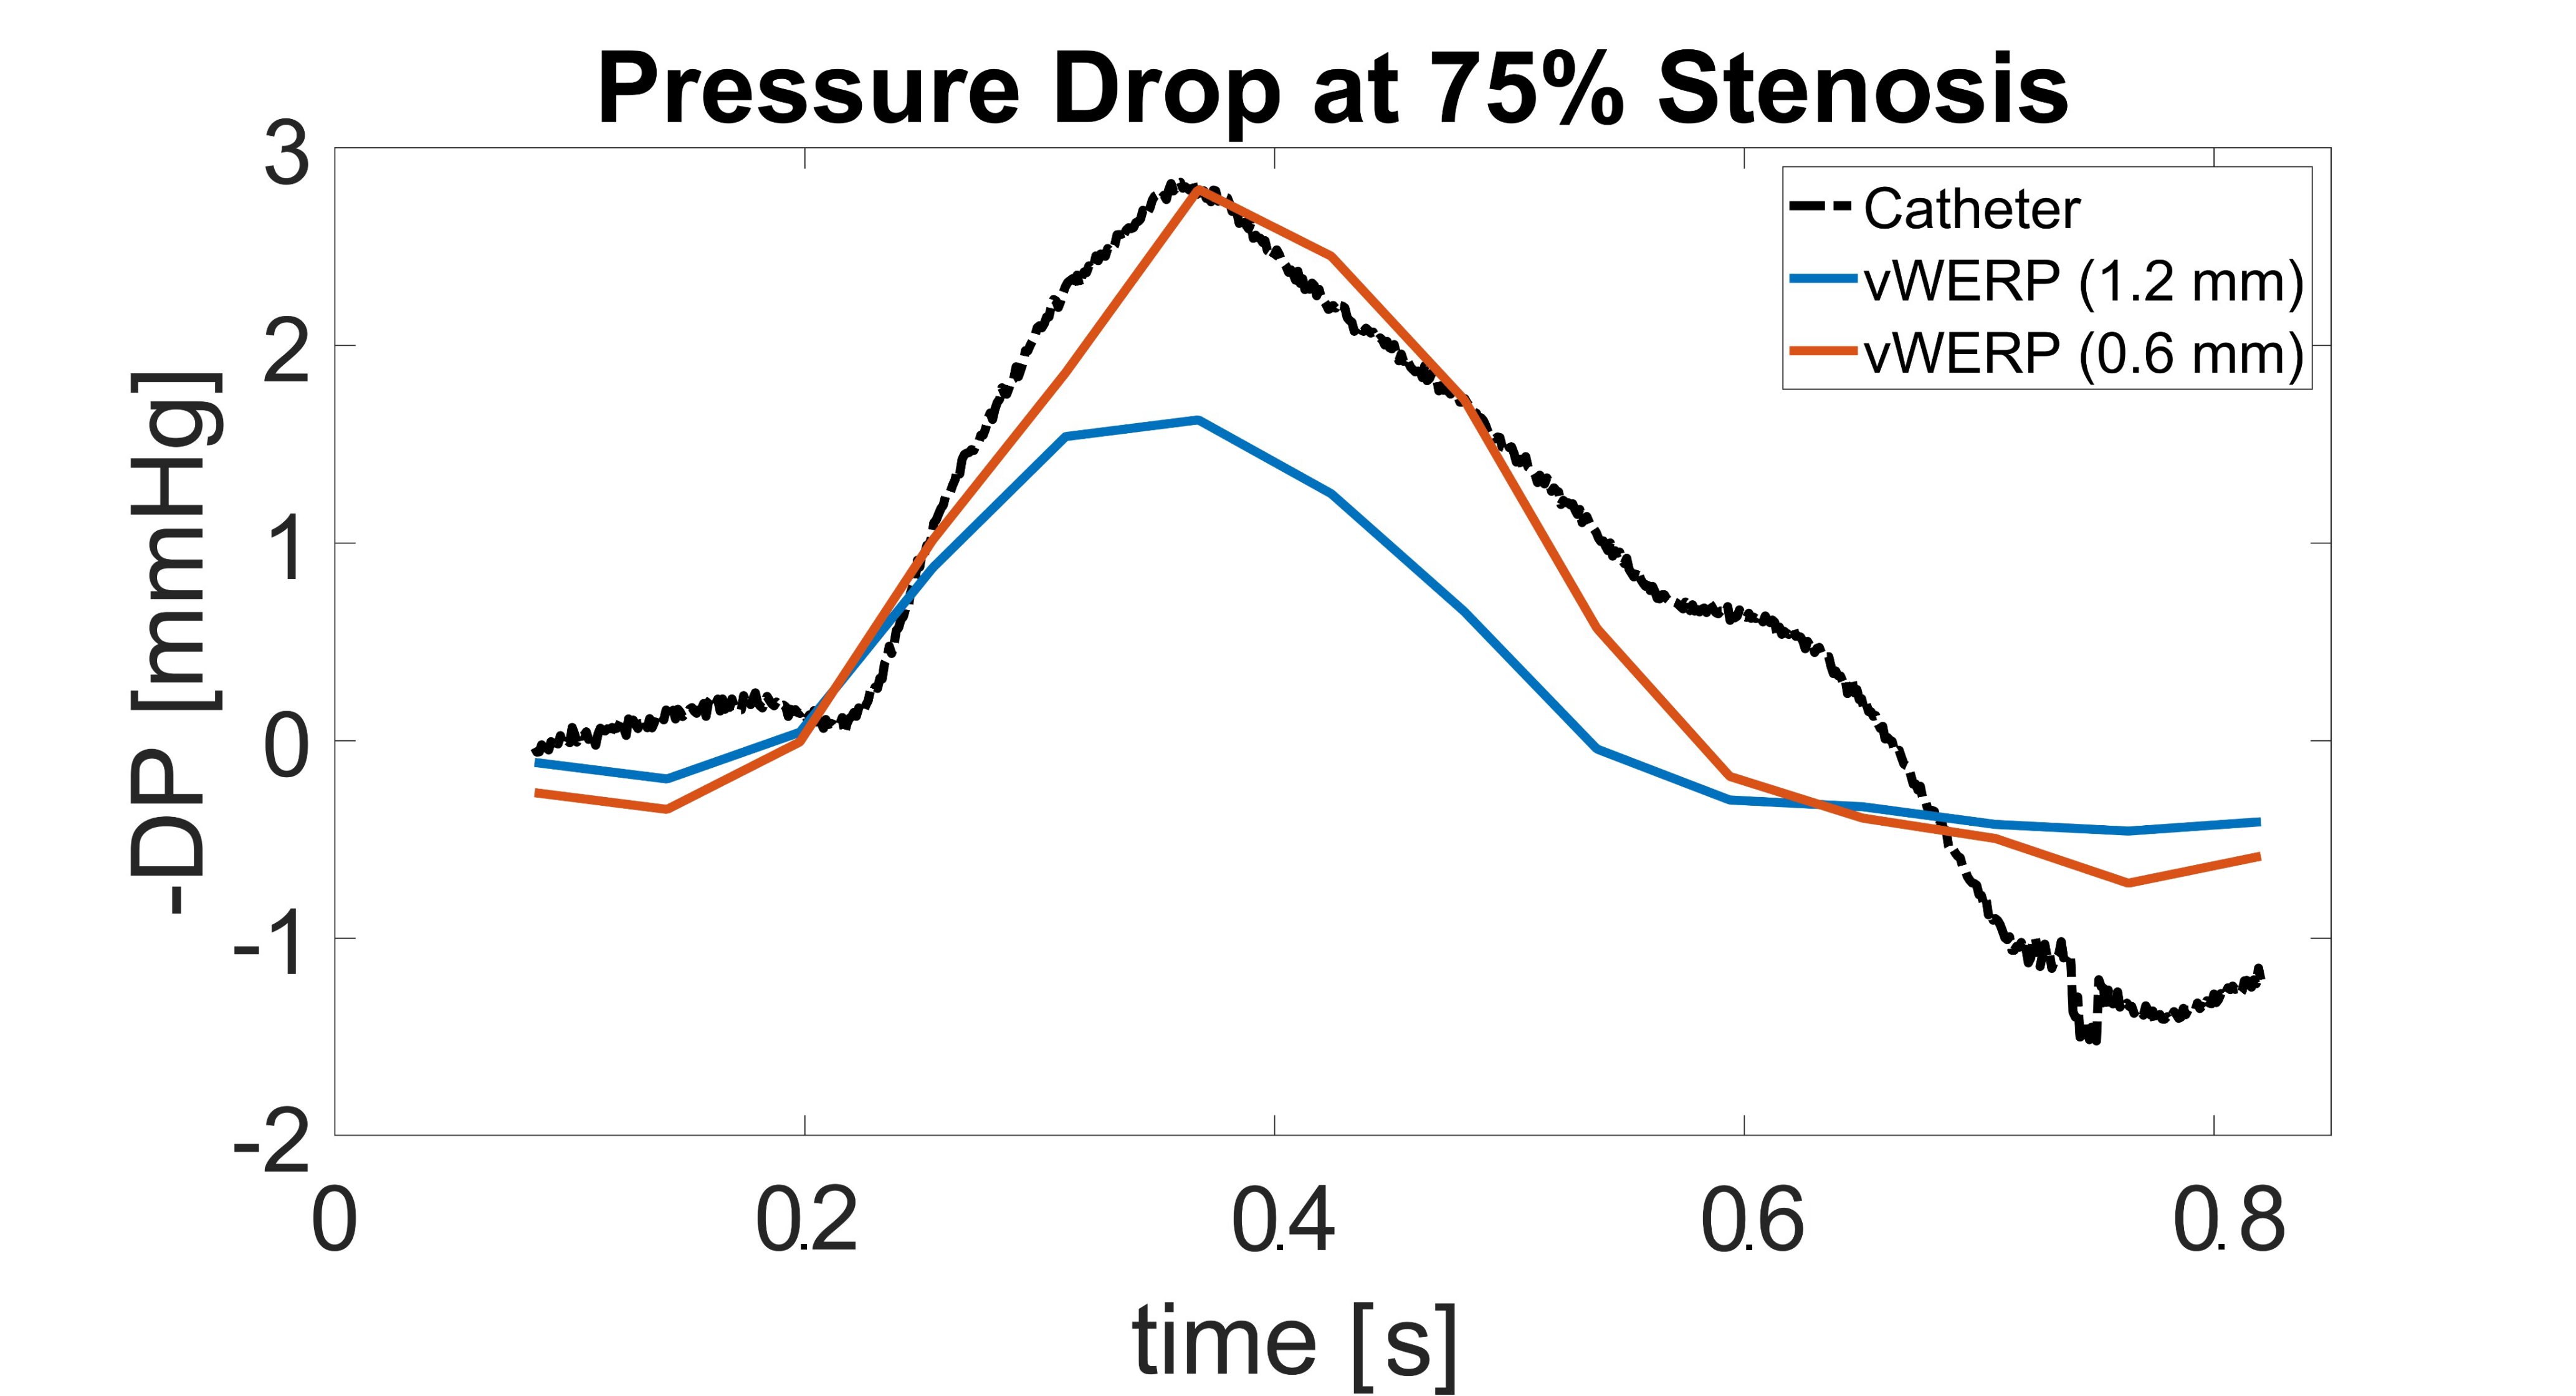
4D flow MRI was measured at 3T (Siemens, Erlangen, Germany) (Venc=100cm/s, TE=4.93ms, TR=7.07ms, temporal resolution=56.56ms, FA=15°) with 0.6 and 1.2mm isotropic spatial resolutions7.
Pressure differences were calculated between inlet and outlet planes using vWERP and the measured velocity field2:
$$\Delta p_{vWERP}=-\frac{1}{Q_e}\cdot \left (\frac{\partial }{\partial t} K_e + A_e + V_e \right )$$
where Ke, Ae, Ve and Qe are virtual energy and flow values, as previously described2. Analysis planes were placed at the same positions as for the catheter measurements (see Fig.1B): The vWERP results were aligned with temporally averaged pressure catheter measurements using cross-correlation.
For turbulence quantification, an 2D ICOSA-6 encoding scheme was applied in the sagittal plane (VENC: 21-235cm/s, TE=4.77ms, TR=8.08ms, temporal resolution=56.56ms, FA=15°, 0.6mm spatial resolution, 3.2mm slice thickness7). All data analysis was done using MATLAB1.
Results:
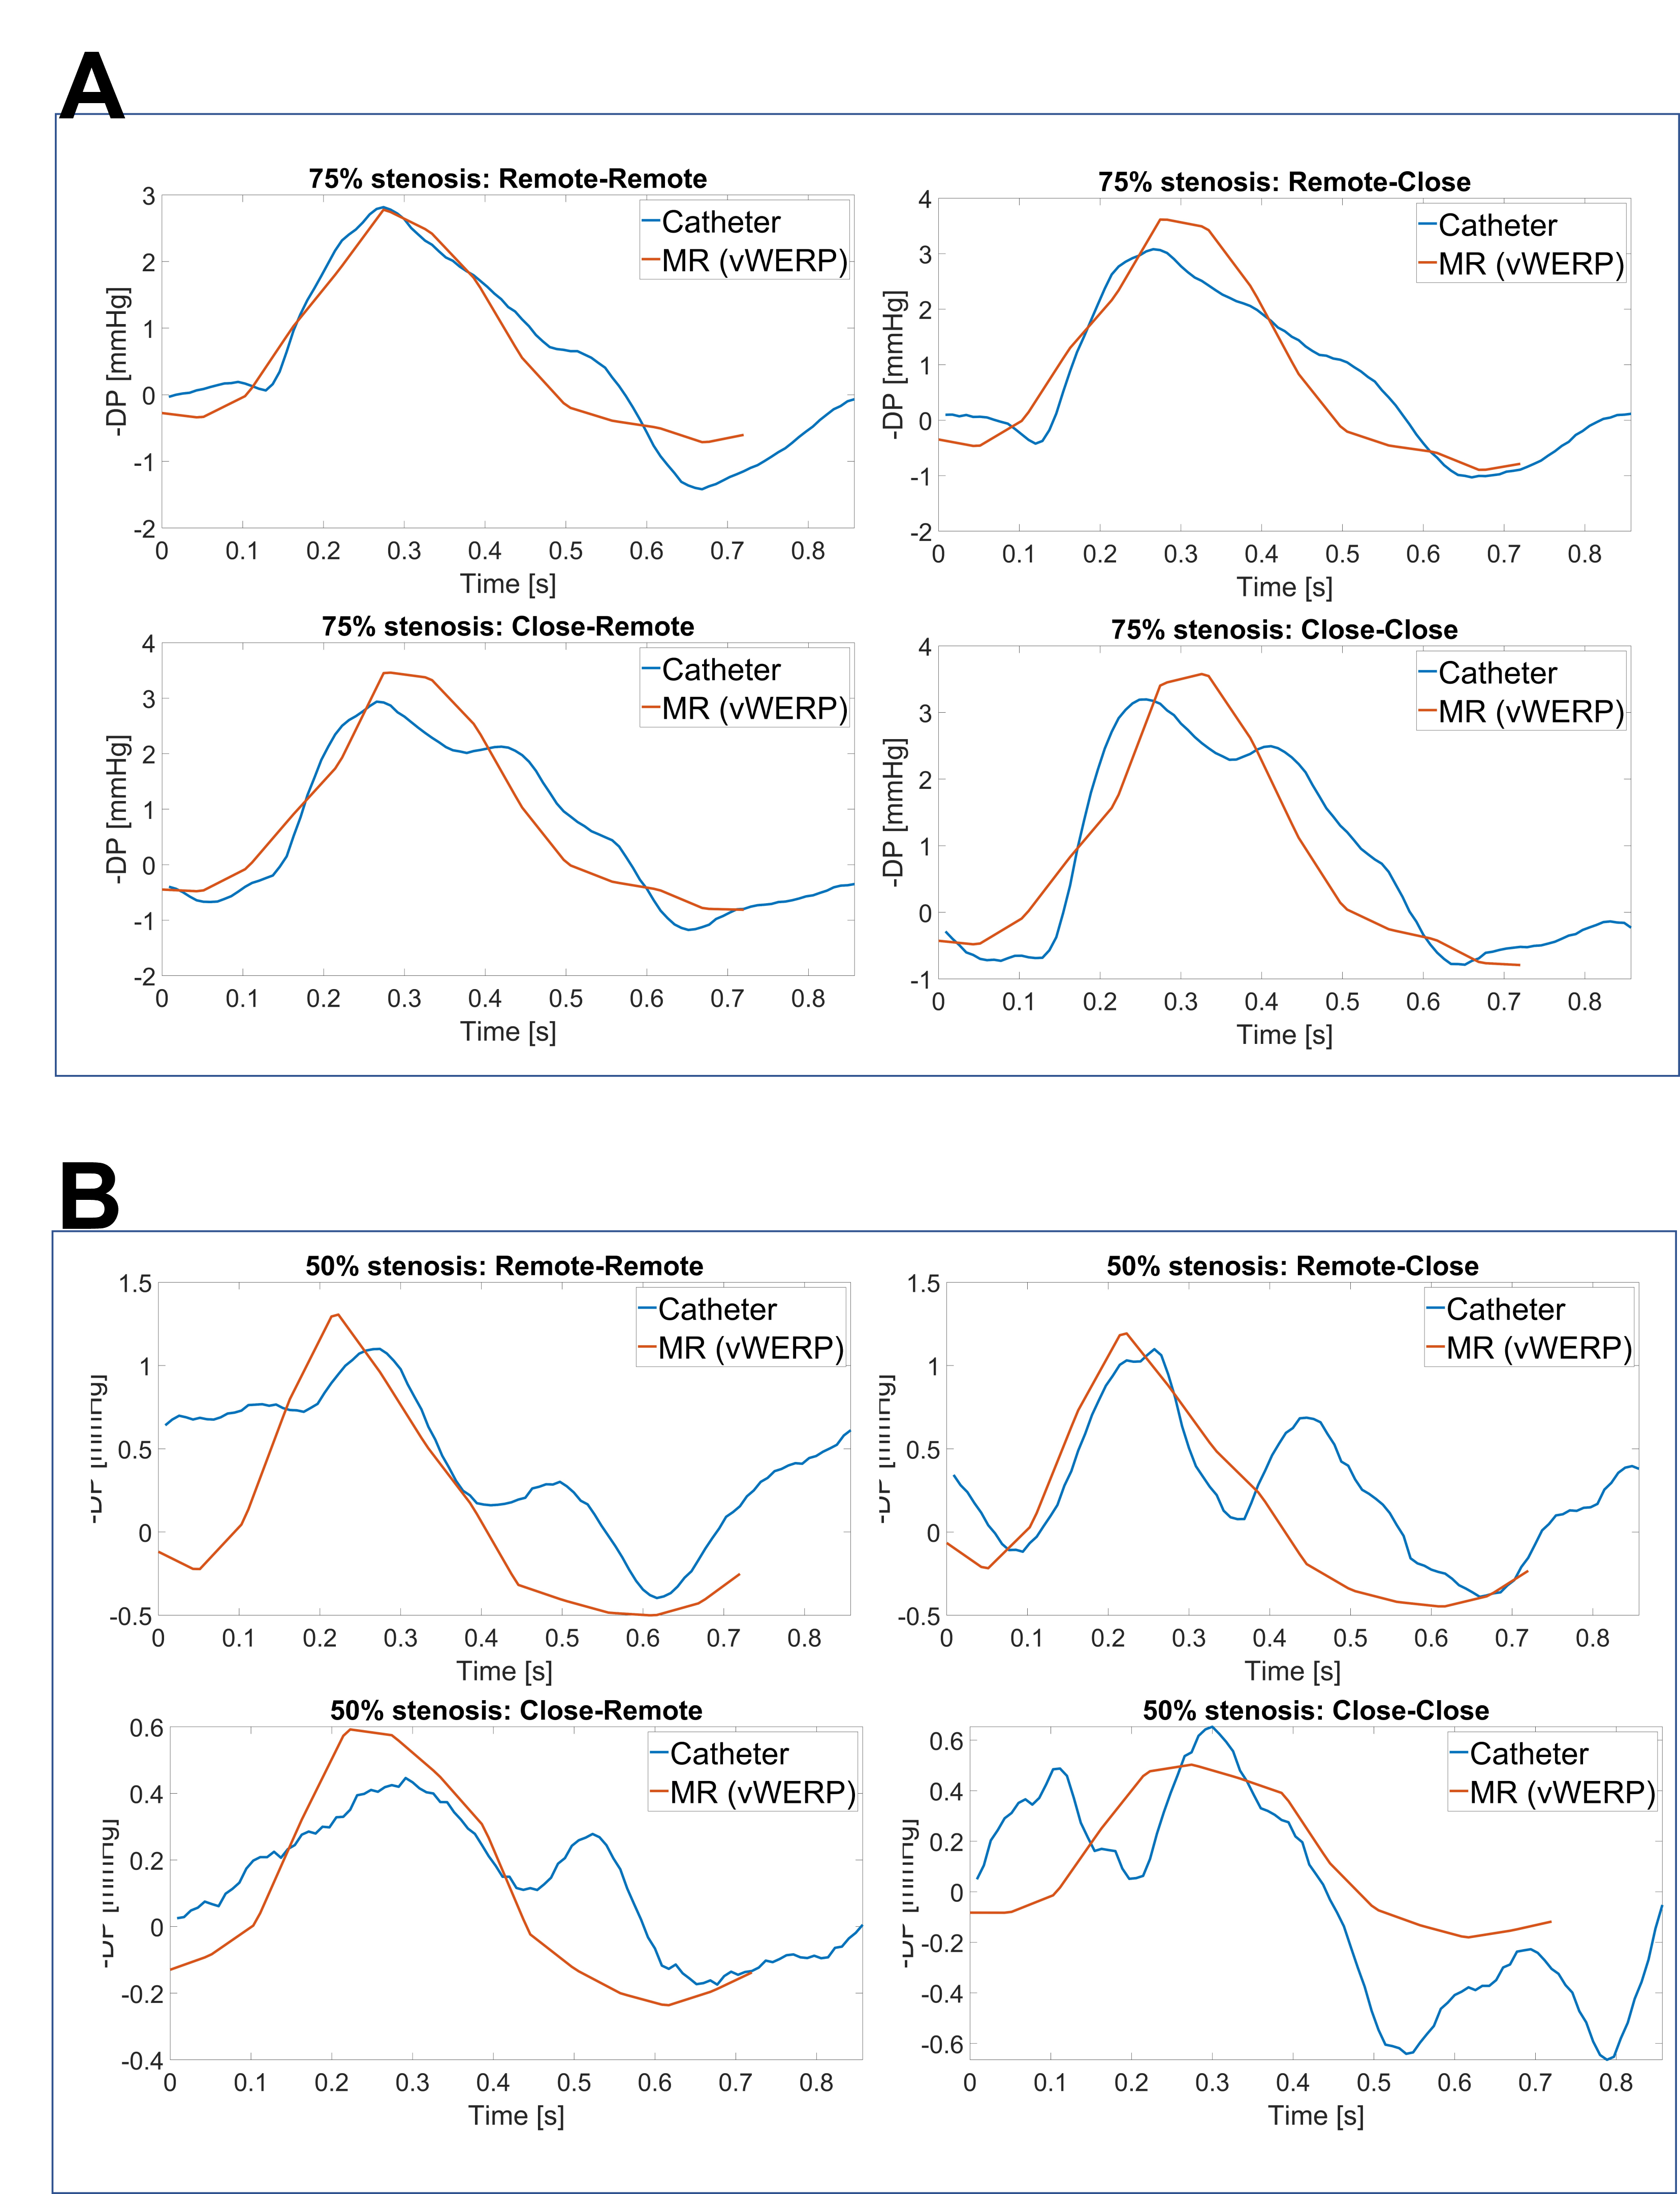
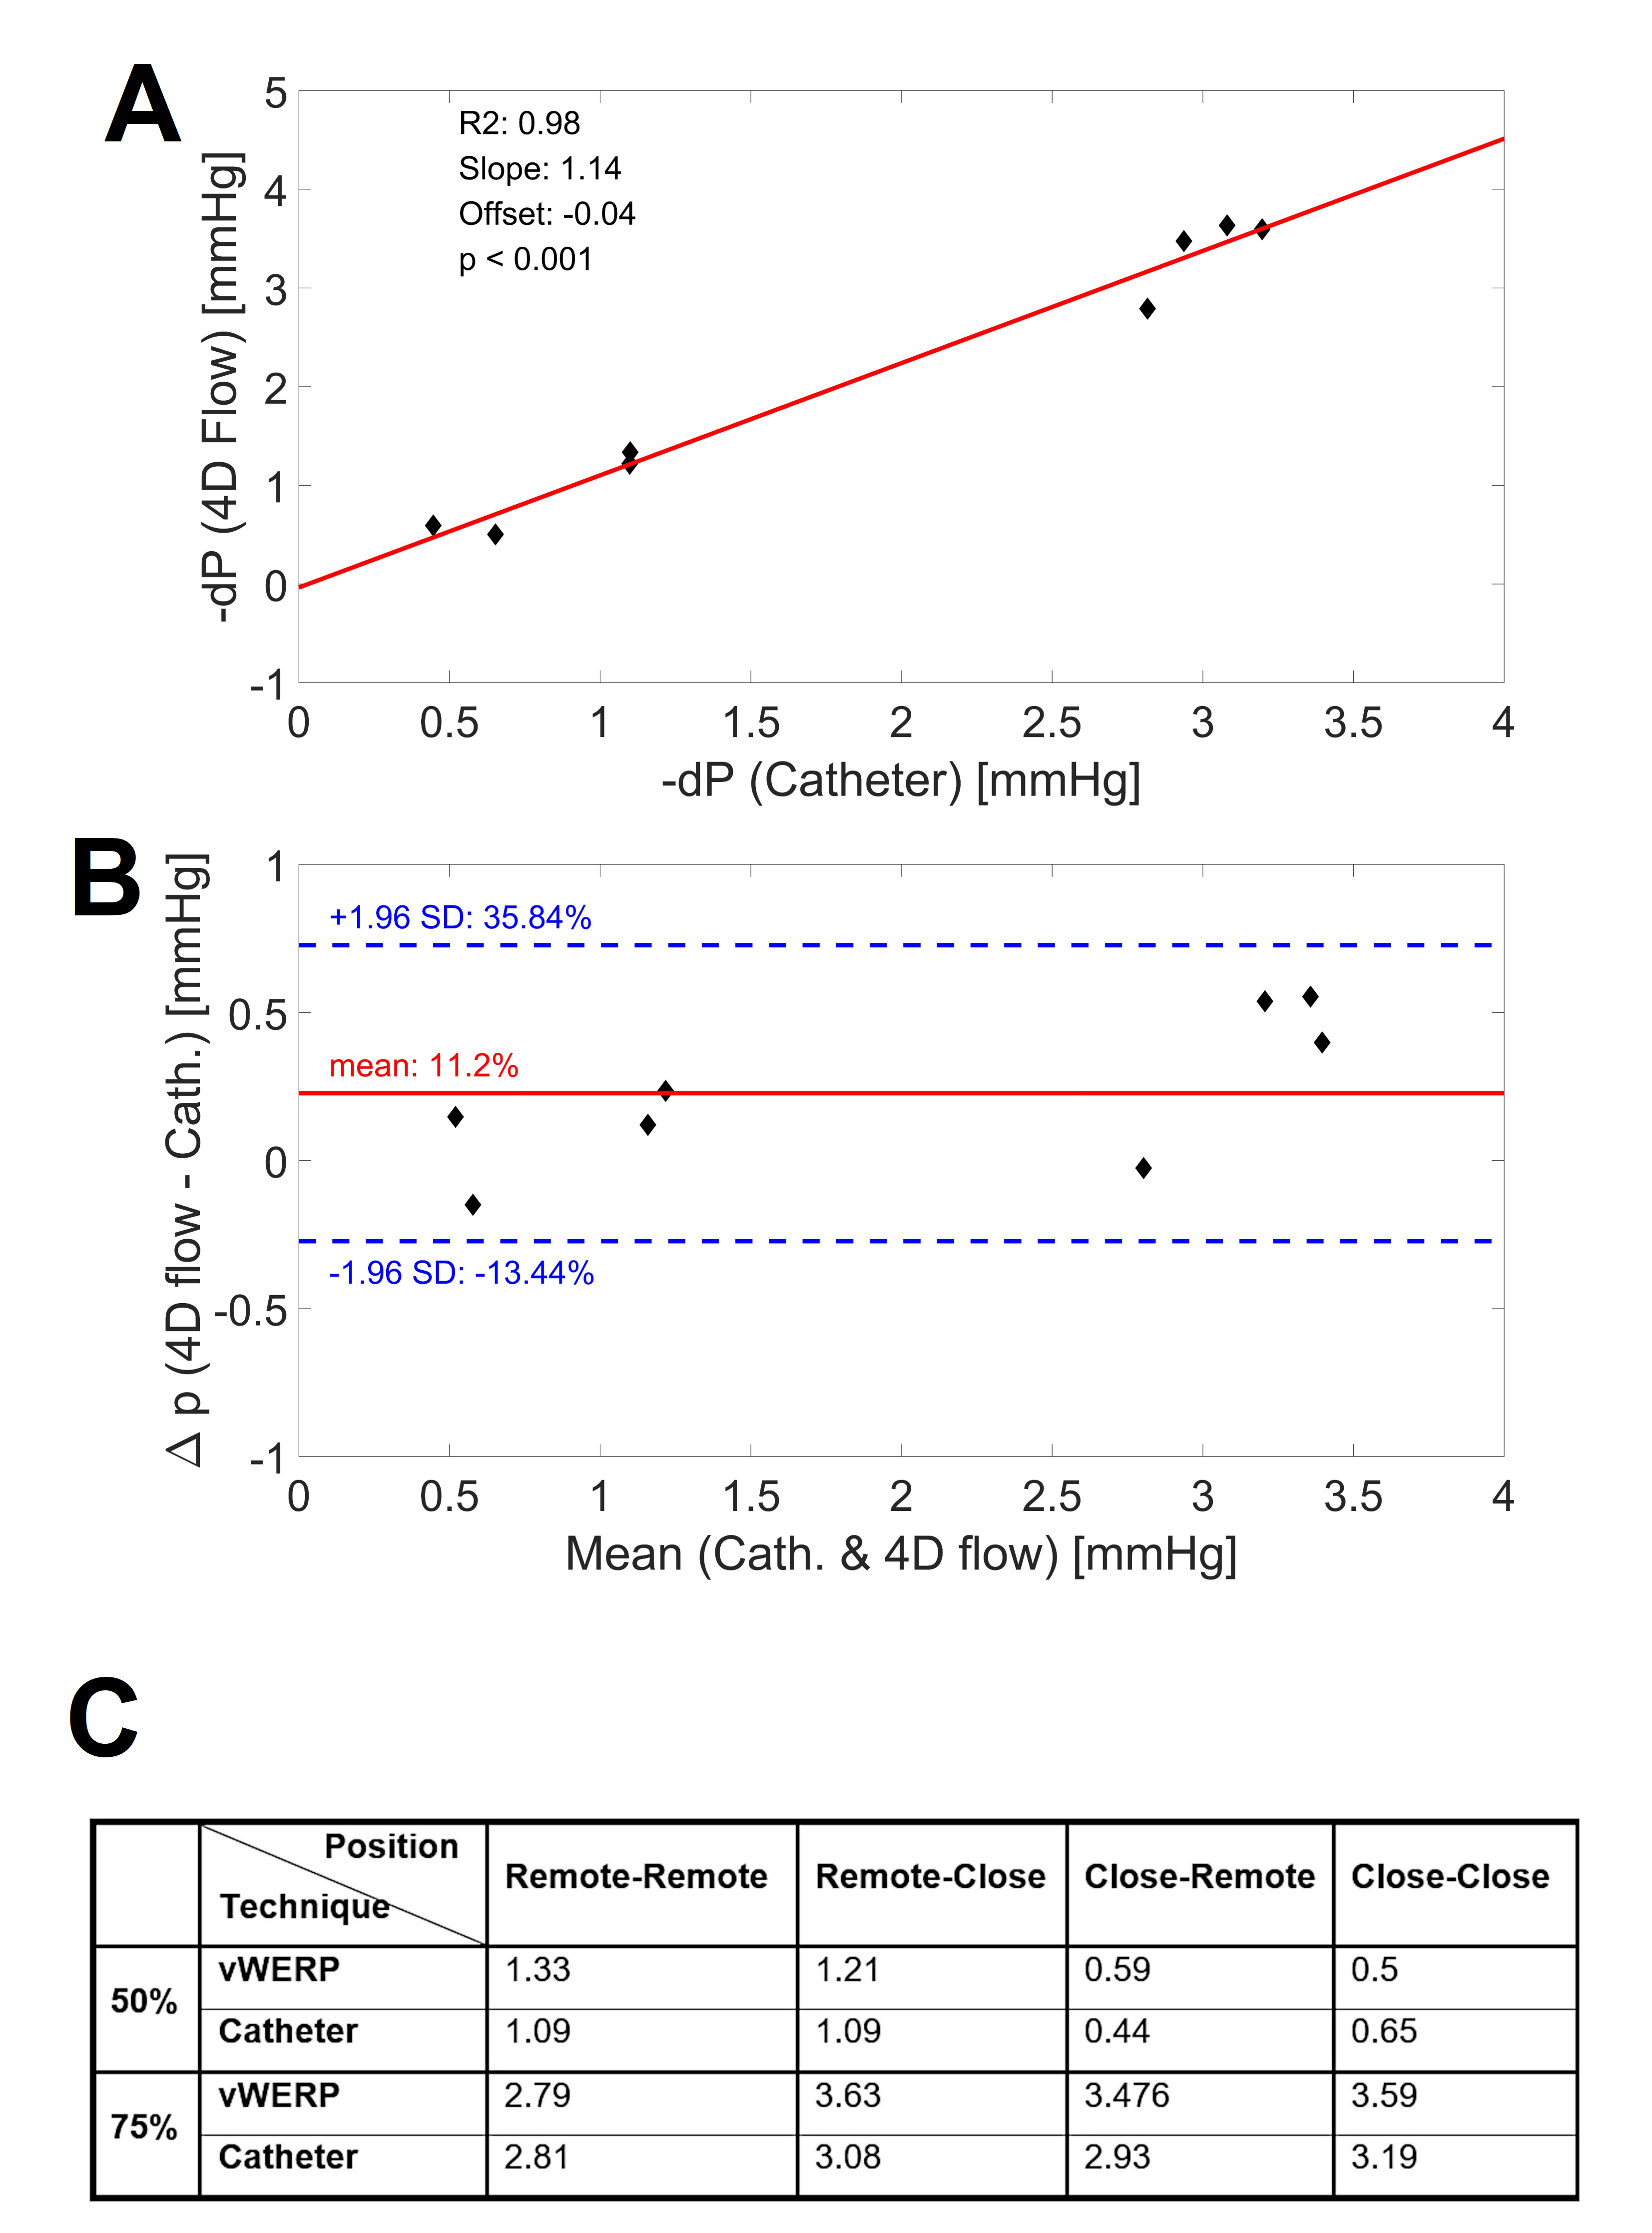
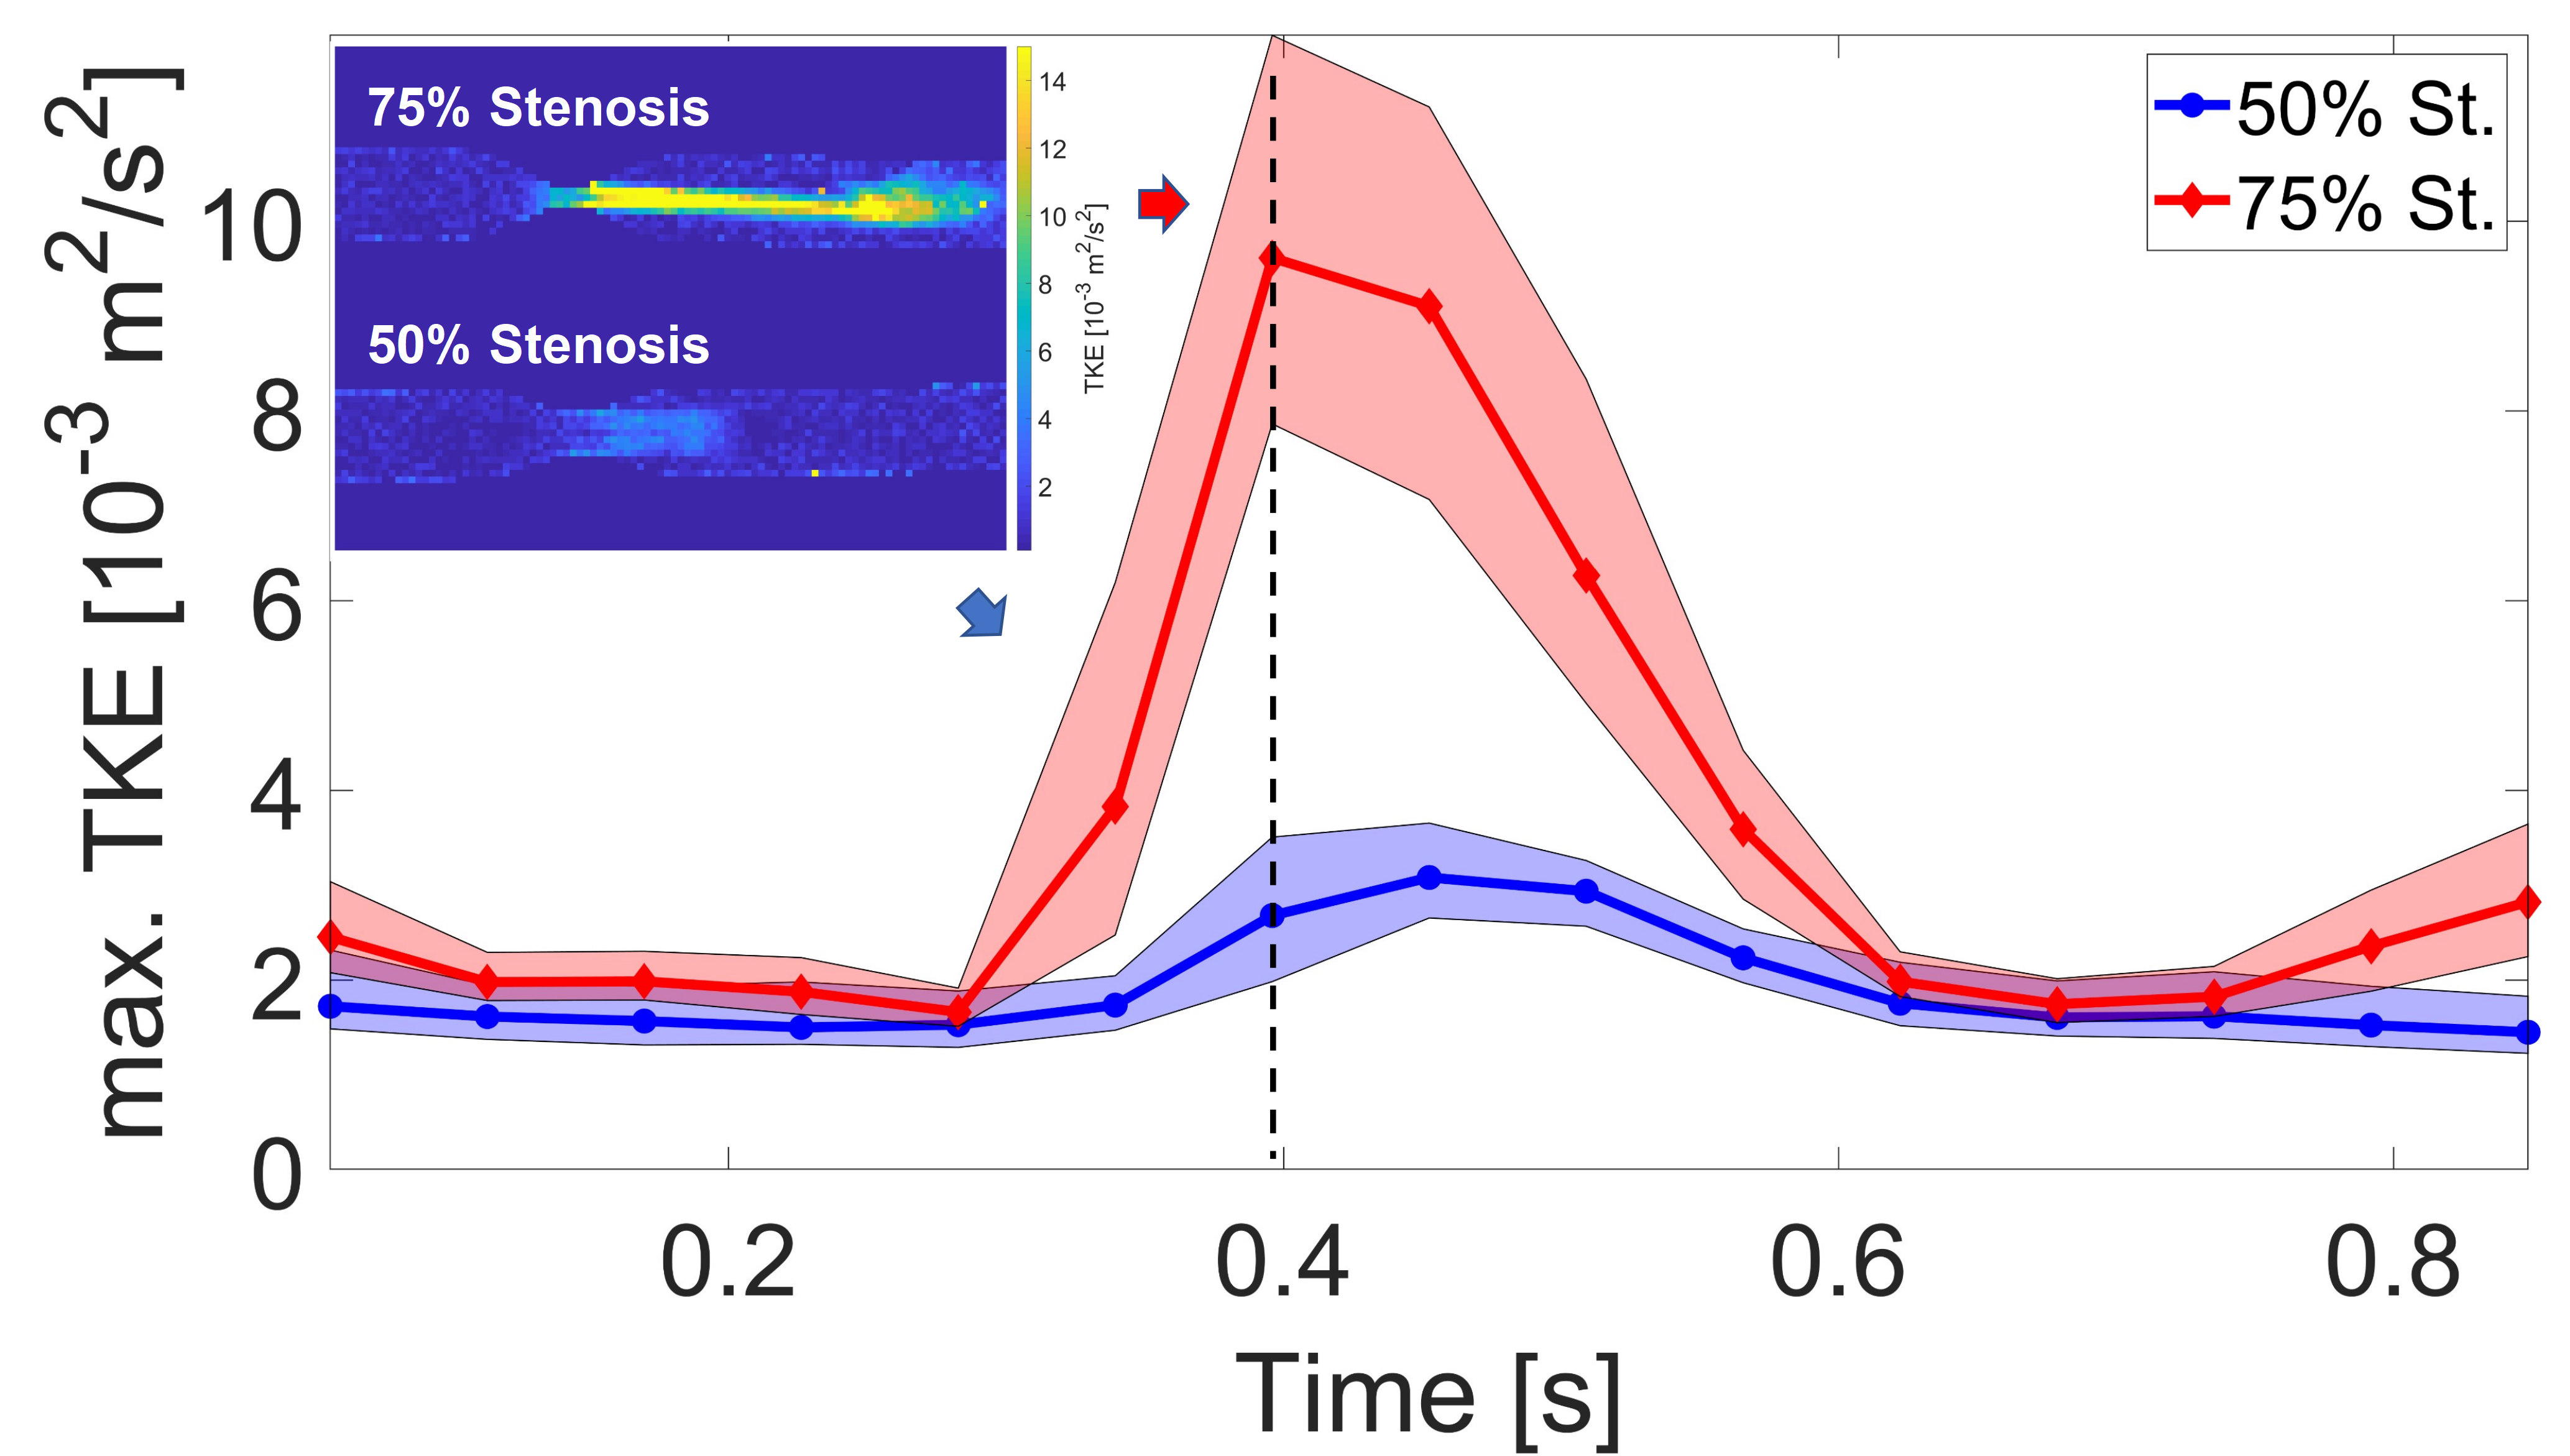
Fig.2 shows relative pressures estimated using vWERP around the 75% stenosis (planes A1-D1, see Fig.1) with 0.6mm and 1.2mm voxel size, compared to the catheter measurement. Underestimation was observed for the low-resolution measurement. In Fig.3, comparisons of both methods are shown for the four different positions for both stenosis channels using 0.6mm resolution. Fig.4 displays the measured and estimated relative peak pressure drops using 0.6mm resolution in both stenoses (50% and 70%) for all four positions. The interclass correlation showed a very good correlation between catheter and vWERP (Fig.4A) whereas the Bland Altman assessment yields a vWERP pressure overestimation of 11.2% (Fig.4B, see also table in Fig.4C).Fig.5 displays the median and interquartile range of the top 20% values of turbulent kinetic energy (TKE). The 2D TKE distribution is illustrated for the maximum flow phase.
Discussion and Conclusion:
At high resolution, vWERP relative pressure estimates exhibited excellent accuracy for both stenoses. A direct dependency on spatial resolution was observed, where underestimation was seen at coarser resolution (in-line with previous analysis3). Since spatial resolution of 0.6mm and below is usually not feasible clinically, super resolution approaches using deep learning may help to improve the accuracy of pressure estimations around stenoses8. Additional local maxima in the pressure catheter measurements in the 50% stenosis are potentially caused by the catheter wire. The turbulence quantification revealed a relatively high turbulent kinetic energy in the 50% stenosis in areas B and C where the catheter was positioned, which may explain some of the deviations, as indicated in previous work4. High TKE suggests a potential error source, but the degree of error does not necessarily correlate with the degree of maximum TKE, as the pressure drop depends on local turbulences. Further investigations will be carried out with a mock nonmetallic catheter inserted during MRI scanning to eliminate systematic errors when comparing both pressure estimation techniques.Acknowledgements
This work was funded by the German Research Foundation (DFG INST 292/155-1 FUGG) and the National Institutes of Health (NIH 1R01HL149787, 5R21NS122511). DM acknowledges funding from the Knut and Alice Wallenberg Foundation and the European Union (ERC, MultiPRESS, 101075494).References
1. Vali, A., Aristova, M., Vakil, P., Abdalla, R., Prabhakaran, S., Markl, M., Ansari, S. A., & Schnell, S. (2019). Semi‐automated analysis of 4D flow MRI to assess the hemodynamic impact of intracranial atherosclerotic disease. Magnetic Resonance in Medicine, 82(2), 749–762.
2. Marlevi, D., Ruijsink, B., Balmus, M., Dillon-Murphy, D., Fovargue, D., Pushparajah, K., Bertoglio, C., Colarieti-Tosti, M., Larsson, M., Lamata, P., Figueroa, C. A., Razavi, R., & Nordsletten, D. (2019). Estimation of cardiovascular relative pressure using virtual Work-Energy. Scientific Reports, 9(1).
3. Marlevi, D., Schollenberger, J., Aristova, M., Ferdian, E., Ma, Y., Young, A. A., Edelman, E. R., Schnell, S., Figueroa, C. A., & Nordsletten, D. (2021). Noninvasive quantification of cerebrovascular pressure changes using 4D Flow MRI. Magnetic Resonance in Medicine, 86(6), 3096–3110.
4. Marlevi, D., Ha, H.Dillon-Murphy, D., Fernandes, J.F., Fovargue, D., Colarieti-Tosti, M., Larsson, M., Lamata, P., Figuerora, C.A., Ebbers, T. and Marlevi, D (2020). Non-invasive estimation of relative pressure in turbulent flow using virtual work-energy. Medical Image Analysis, 60, 101627
5. Summers, PE et al. Multisite Trial of MR Flow Measurement: Phantom and Protocol. Journal of Magnetic Resonance Imaging 21(5): 620-631, 2005
6. Markl, M., Bammer, R., Alley, M. T., Elkins, C., Draney, M. T., Barnett, A., Moseley, M. E., Glover, G. H., & Pelc, N. J. (2003). Generalized reconstruction of phase contrast MRI: Analysis and correction of the effect of gradient field distortions. Magnetic Resonance in Medicine, 50(4), 791–801.
7. Schmidt, S., John, K., Kim, S. J., Flassbeck, S., Schmitter, S., & Bruschewski, M. (2021). Reynolds stress tensor measurements using magnetic resonance velocimetry: expansion of the dynamic measurement range and analysis of systematic measurement errors. Experiments in Fluids, 62(6), 121.
8. Winter, P., Marlevi, D., Aristova, M., Ferdian, E., Schollenberger, J., Vali, A., Moore, J., Markl, M., Abdallah, R., Ansari, S., Figuerora, C.A:, Nordsletten, D., Young, A. and Schnell, S., Super-resolution assessment of relative pressure in intracranial atherosclerosis using ML-enhanced 4D Flow MRI. International Society of Magnetic Resonance in Medicine 2023: 0783
Figures