2204
Simulating pulsatile flow: towards understanding MRI sequences targeting microvascular fluid-structure interactions1Department of Radiology, Center for Image Sciences, University Medical Center Utrecht, Utrecht, Netherlands
Synopsis
Keywords: Blood Vessels, Modelling
Motivation: MRI is increasingly used to investigate vascular pathology in neurodegenerative disease. The origin of the MRI signal, however, often remains elusive. This study models pulsatile blood flow aiming to characterize vascular pulsation’s impact on MRI signal formation in advanced sequences.
Goal(s): To create a realistic model of pulsatile blood flow in microvasculature.
Approach: Static and pulsatile flow are simulated in a simplified and a more realistic synthetically generated vessel model using 1D approximations of governing equations.
Results: Pulsatile flow simulations in simplified networks with realistic inflow wave forms yield realistic deformation characteristics. Realistic pressure and flow distributions are achieved in extensive microvascular networks.
Impact: By providing realistic voxel-scale vascular simulation models capable of quantifying physiological parameters such as CBV and vessel deformation due to pulsatility, contribution of microvascular pulsations to MRI signal and cerebral waste clearance may be explored in the future.
Introduction
Despite continuous improvements in medical imaging, investigating microvascular physiology and pathology remains burdensome. MRI sequences such as vascular space occupancy MRI (VASO-MRI) and displacement-encoded stimulated echo MRI (DENSE-MRI) may be used to investigate vascular dysfunction in neurodegenerative disease1,2. However, when evaluating MRI images, the underlying physiological processes giving rise to the signals and contribution of different anatomical structures often remain unclear. This study seeks to lay a foundation to investigate the contribution of vascular pulsations to MRI signal by providing realistic voxel scale pulsatile blood flow models.Methods
Two vascular models were utilized in this work: a simplified model used to showcase computationally expensive methods and a detailed model attempting to move towards realistic vasculature (see Figure 1).Simplified model
The simplified model was created by continuous bifurcation from a single inlet, followed by corresponding merging vessels back to a single outlet. Due to computational cost, simulation of pulsatility and fluid-structure-interaction with the vessel-wall was limited to this simplified vasculature. Pulsatile waves were described by a 1D non-linear approximation of the governing equations utilizing a solver provided by the Hemodynamic Modelling Research Group3. An elastic wall model was employed. Vessel wall properties were specified by the product of Young's modulus E and wall thickness, assuming E=500kPa4 and fixed diameter-thickness-ratios5. For implementation details, see Alastruey et al.6. Inlet flow was prescribed using the wave depicted in Figure 2, following Boileau et al.7. Free outflow is assumed for outlets.
Towards a realistic vascular model
A synthetic tree generation algorithm was utilized to generate two-dimensional realistic microvasculature. An area of 3500x3500µm2 was covered resembling few voxels. The generated vasculature extends from the pial surface over six cortical layers down to the gray-white-matter boundary. Cortical layers were defined following Hirsch et al.8. Penetrating arteries and veins are generated to varying depths, with inlet and outlet radii set based on values observed in rodents9. Inlets were assigned a radius of 20µm, outlet veins were set to 30µm. Branching vessels connecting to the capillaries bifurcate from each penetrating vessel. Capillary structures were generated using random bifurcations defined by a Delaunay triangulation. Finally, the network was propagated from the inlets and Murrays law was enforced at each bifurcation10. In the detailed network, simulations were limited to steady flow. A 1D-approximation of the Navier-Stokes-equations was applied per vascular segment. Continuity of pressure and conservation of mass were enforced per bifurcation, yielding a linear system of equations. Inlet flow was set to the average of the flow wave, corresponding to 6.8E-3µl/s. Further, outlet pressure (p=10mmHg) was prescribed.
Results
Pulsatile flow was simulated in the simplified network with equal inlet diameter as the detailed model. Figure 3 shows local pressure and flow values for one cardiac cycle at different points in the network. A pressure gradient drives flow through the network. Therefore, pressure decreases towards the outlet as indicated by decreasing amplitude of the pressure wave. On the other hand, flow-wave amplitude remains constant and scales with vessel diameter. Flow decreases with continuous bifurcation towards smaller vessels and increases again as vessels merge. Due to the requirement of flow conservation, flow waves of arterial and corresponding venule points coincide, but are shifted by the pulse-wave traveling time.The relative volume of the vascular network is reported in Figure 4. It corresponds to the prescribed flow wave and exhibits volume increase of up to 3% during peak systole compared to the undeformed configuration.
Figure 5 shows simulated pressure and flow in the detailed, synthetically generated vascular network. Flow distribution shows the highest values in large penetrating arteries and veins, with constant flow values per segment and decreasing flow at every bifurcation towards the microvasculature. Slightly lower flows can be observed in capillary segments located further from penetrating vessels. As in the pulsatile simulation, flow is driven by a pressure gradient resulting in constant pressure decrease from the inlets towards outlets. Low pressure values are observed in peripheral segments, while such capillary segments located between a high-pressure inlet and a penetrating vein exhibit significantly higher pressure.
Discussion and Conclusion
The presented simulation framework enables detailed observations of pressure and flow values in realistic vascular networks down to the capillary scale. The application of a pulsatile flow model to simplified vascular models serves as a proof-of-concept for simulating the deformation of larger, voxel-sized networks. The detailed model will be used in investigating the intrinsic biophysical contribution of vascular pulsations to MRI acquisition schemes, e.g. DENSE and VASO, using Monte-Carlo-simulations of Bloch equations, and to eventually characterize the impact of vascular pulsations in cerebral waste clearance in dementia patients.Acknowledgements
No acknowledgement found.References
- Sloots, J. J., Biessels, G. J., & Zwanenburg, J. J. (2020). Cardiac and respiration-induced brain deformations in humans quantified with high-field MRI. Neuroimage, 210, 116581.
- Waddle, S. L., Garza, M., Ying, C., Davis, L. T., Jordan, L. C., An, H., & Donahue, M. J. (2023). Vascular space occupancy asymmetric spin echo (VASO‐ASE) for non‐invasive quantification of cerebral oxygen extraction fraction. Magnetic resonance in medicine, 90(1), 211-221.
- Nektar1D: A numerical code for solving the 1-D equations of blood flow in arterial networks. Hemodynamic Modelling Research Group, Kings College London. http://haemod.uk/nektar. Accessed November 6, 2023.
- Shadwick, R. E. (1999). Mechanical design in arteries. Journal of Experimental Biology, 202(23), 3305-3313.
- Müller, B., Lang, S., Dominietto, M., Rudin, M., Schulz, G., Deyhle, H., ... & Weitkamp, T. (2008, September). High-resolution tomographic imaging of microvessels. In Developments in X-ray tomography VI (Vol. 7078, pp. 89-98). SPIE.
- Alastruey Arimon, J. (2006). Numerical modelling of pulse wave propagation in the cardiovascular system: development, validation and clinical applications.
- Boileau, E., Nithiarasu, P., Blanco, P. J., Müller, L. O., Fossan, F. E., Hellevik, L. R., ... & Alastruey, J. (2015). A benchmark study of numerical schemes for one‐dimensional arterial blood flow modelling. International journal for numerical methods in biomedical engineering, 31(10), e02732.
- Hirsch, S., Reichold, J., Schneider, M., Székely, G., & Weber, B. (2012). Topology and hemodynamics of the cortical cerebrovascular system. Journal of Cerebral Blood Flow & Metabolism, 32(6), 952-967.
- Blinder, P., Tsai, P. S., Kaufhold, J. P., Knutsen, P. M., Suhl, H., & Kleinfeld, D. (2013). The cortical angiome: an interconnected vascular network with noncolumnar patterns of blood flow. Nature neuroscience, 16(7), 889-897.
- Murray, C. D. (1926). The physiological principle of minimum work applied to the angle of branching of arteries. The Journal of general physiology, 9(6), 835.
- Kobari, M., Gotoh, F., Fukuuchi, Y., Tanaka, K., Suzuki, N., & Uematsu, D. (1984). Blood flow velocity in the pial arteries of cats, with particular reference to the vessel diameter. Journal of Cerebral Blood Flow & Metabolism, 4(1), 110-114.
Figures
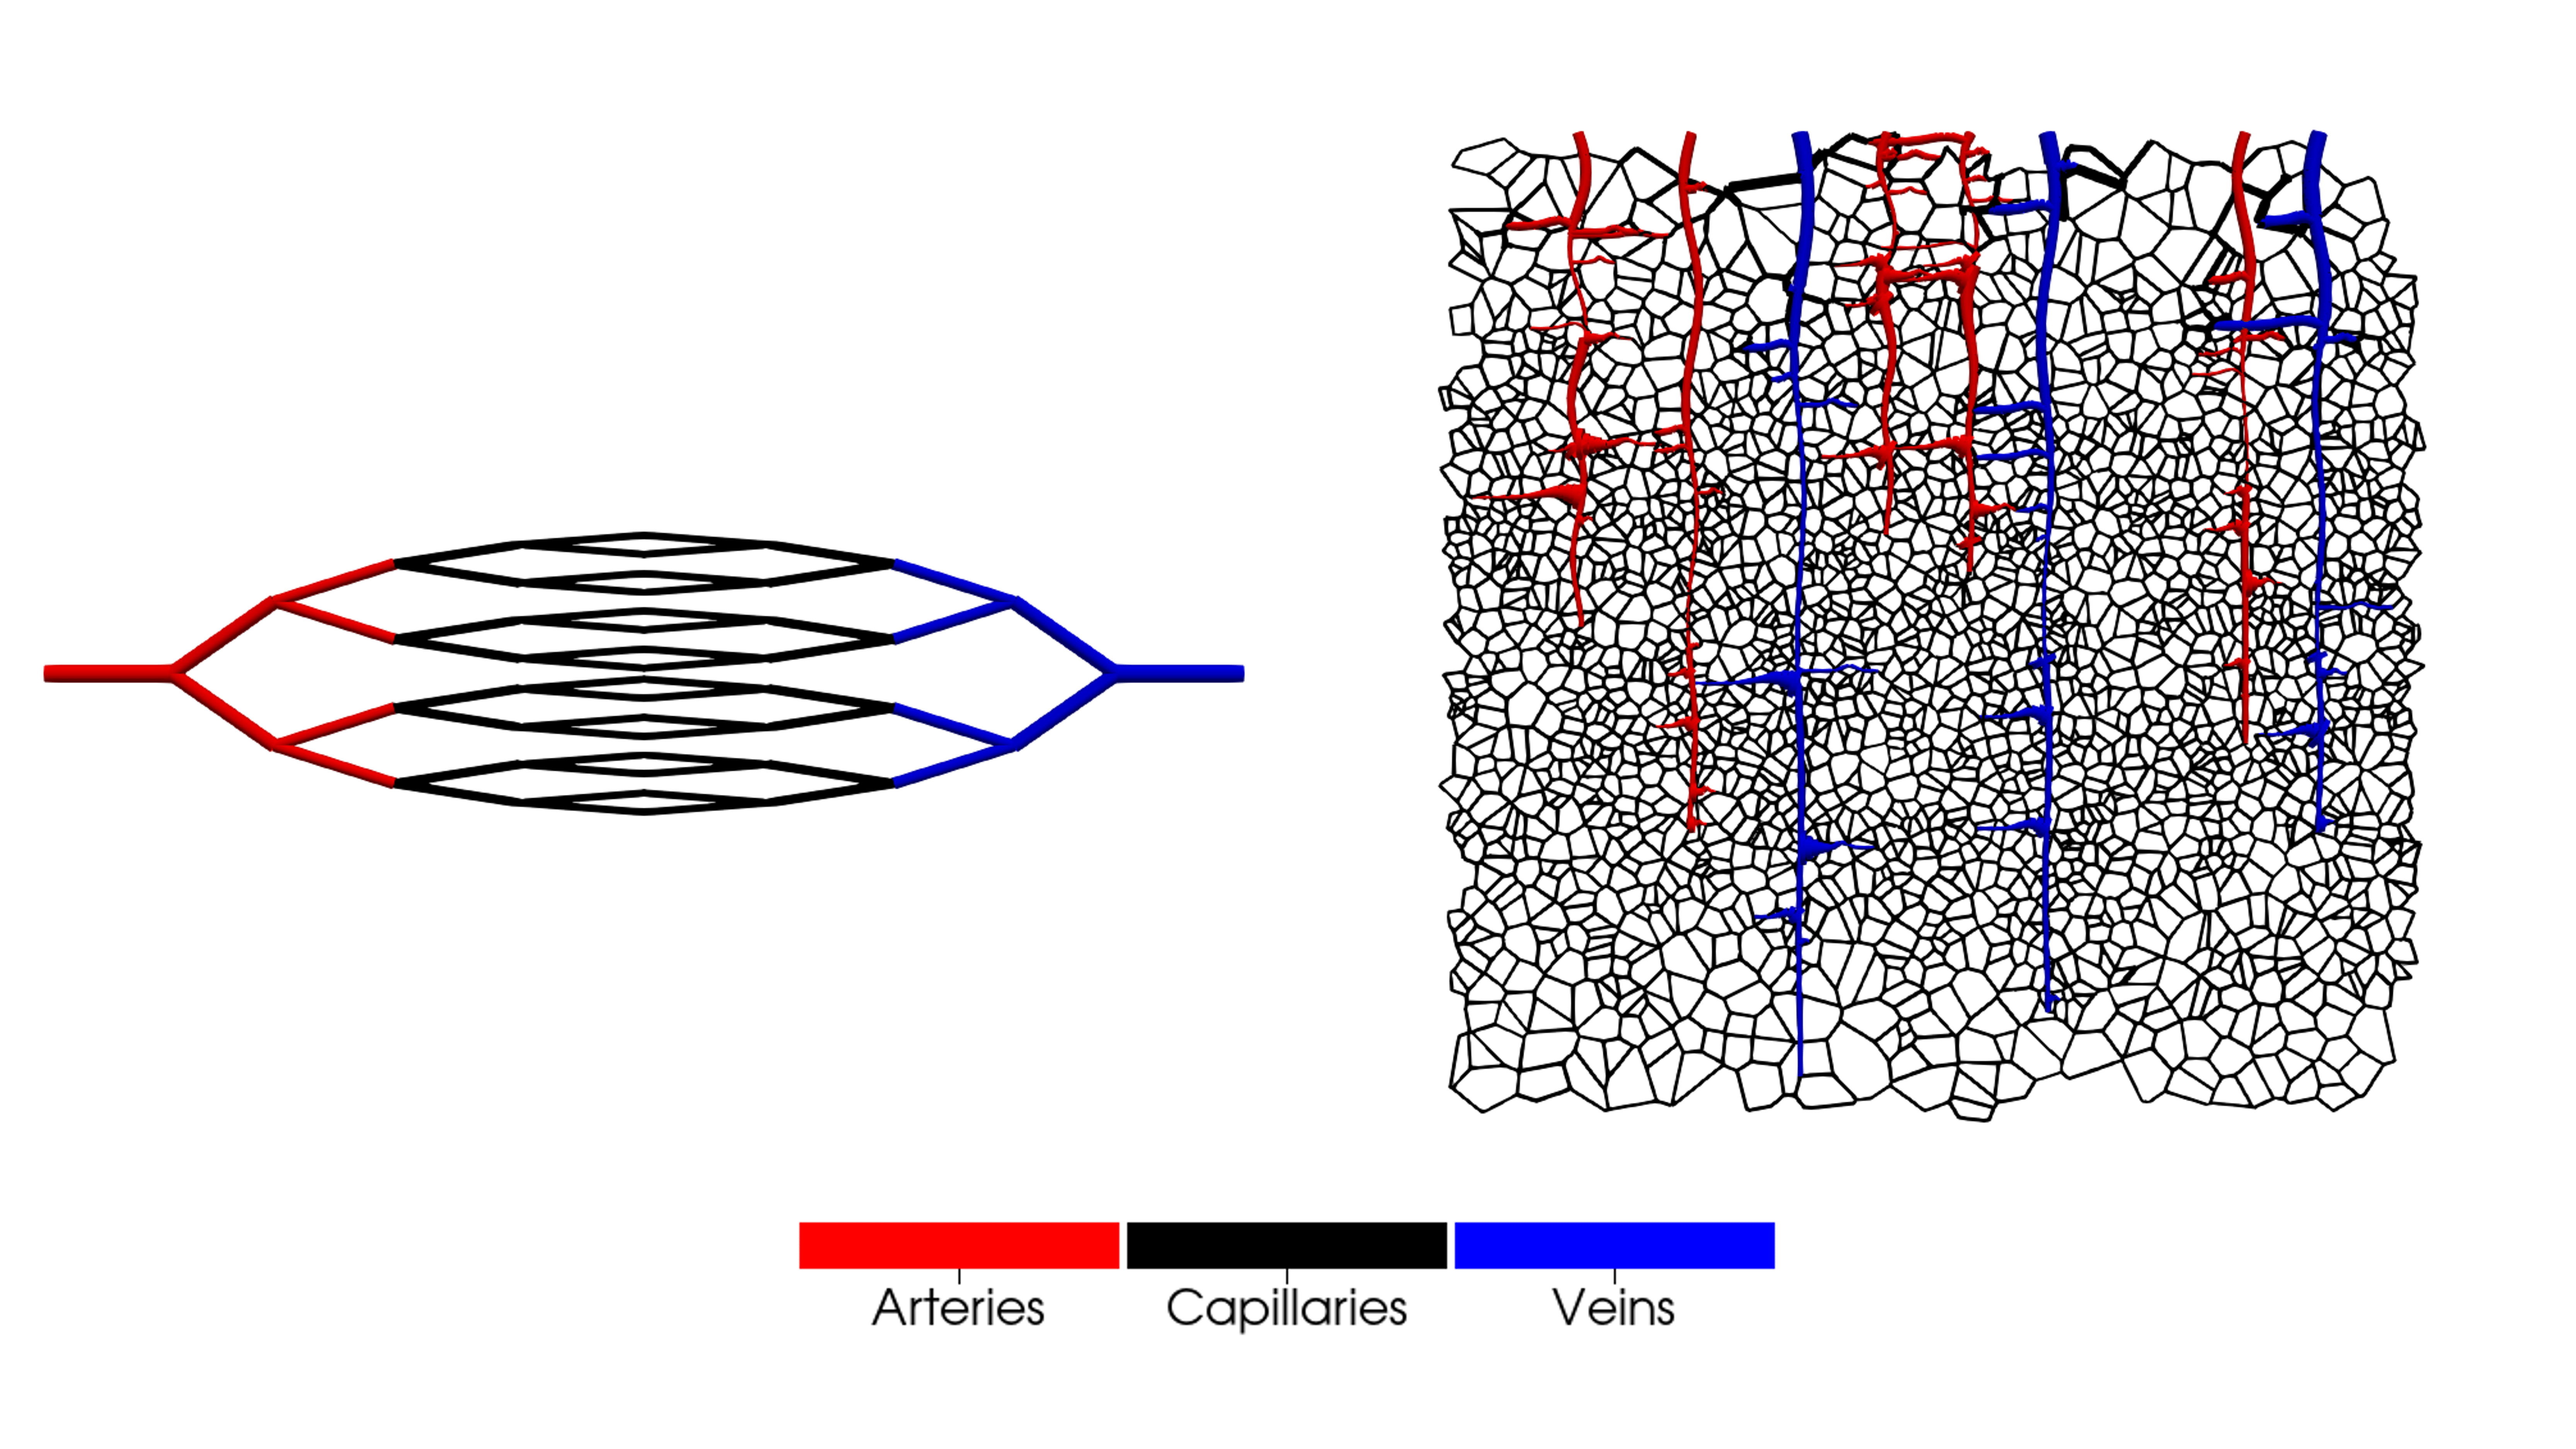
Figure 1: Simple vessel network (left) and realistic vessel network (right). The same inlet radii of 15µm are prescribed. Downstream radii are governed by Murray’s law10. Vessel wall thickness is determined relative to the arterial diameter based on diameter-thickness-ratios of 1.5/1 (arteries), 8/1 (capillaries), and 10/1 (veins)5.
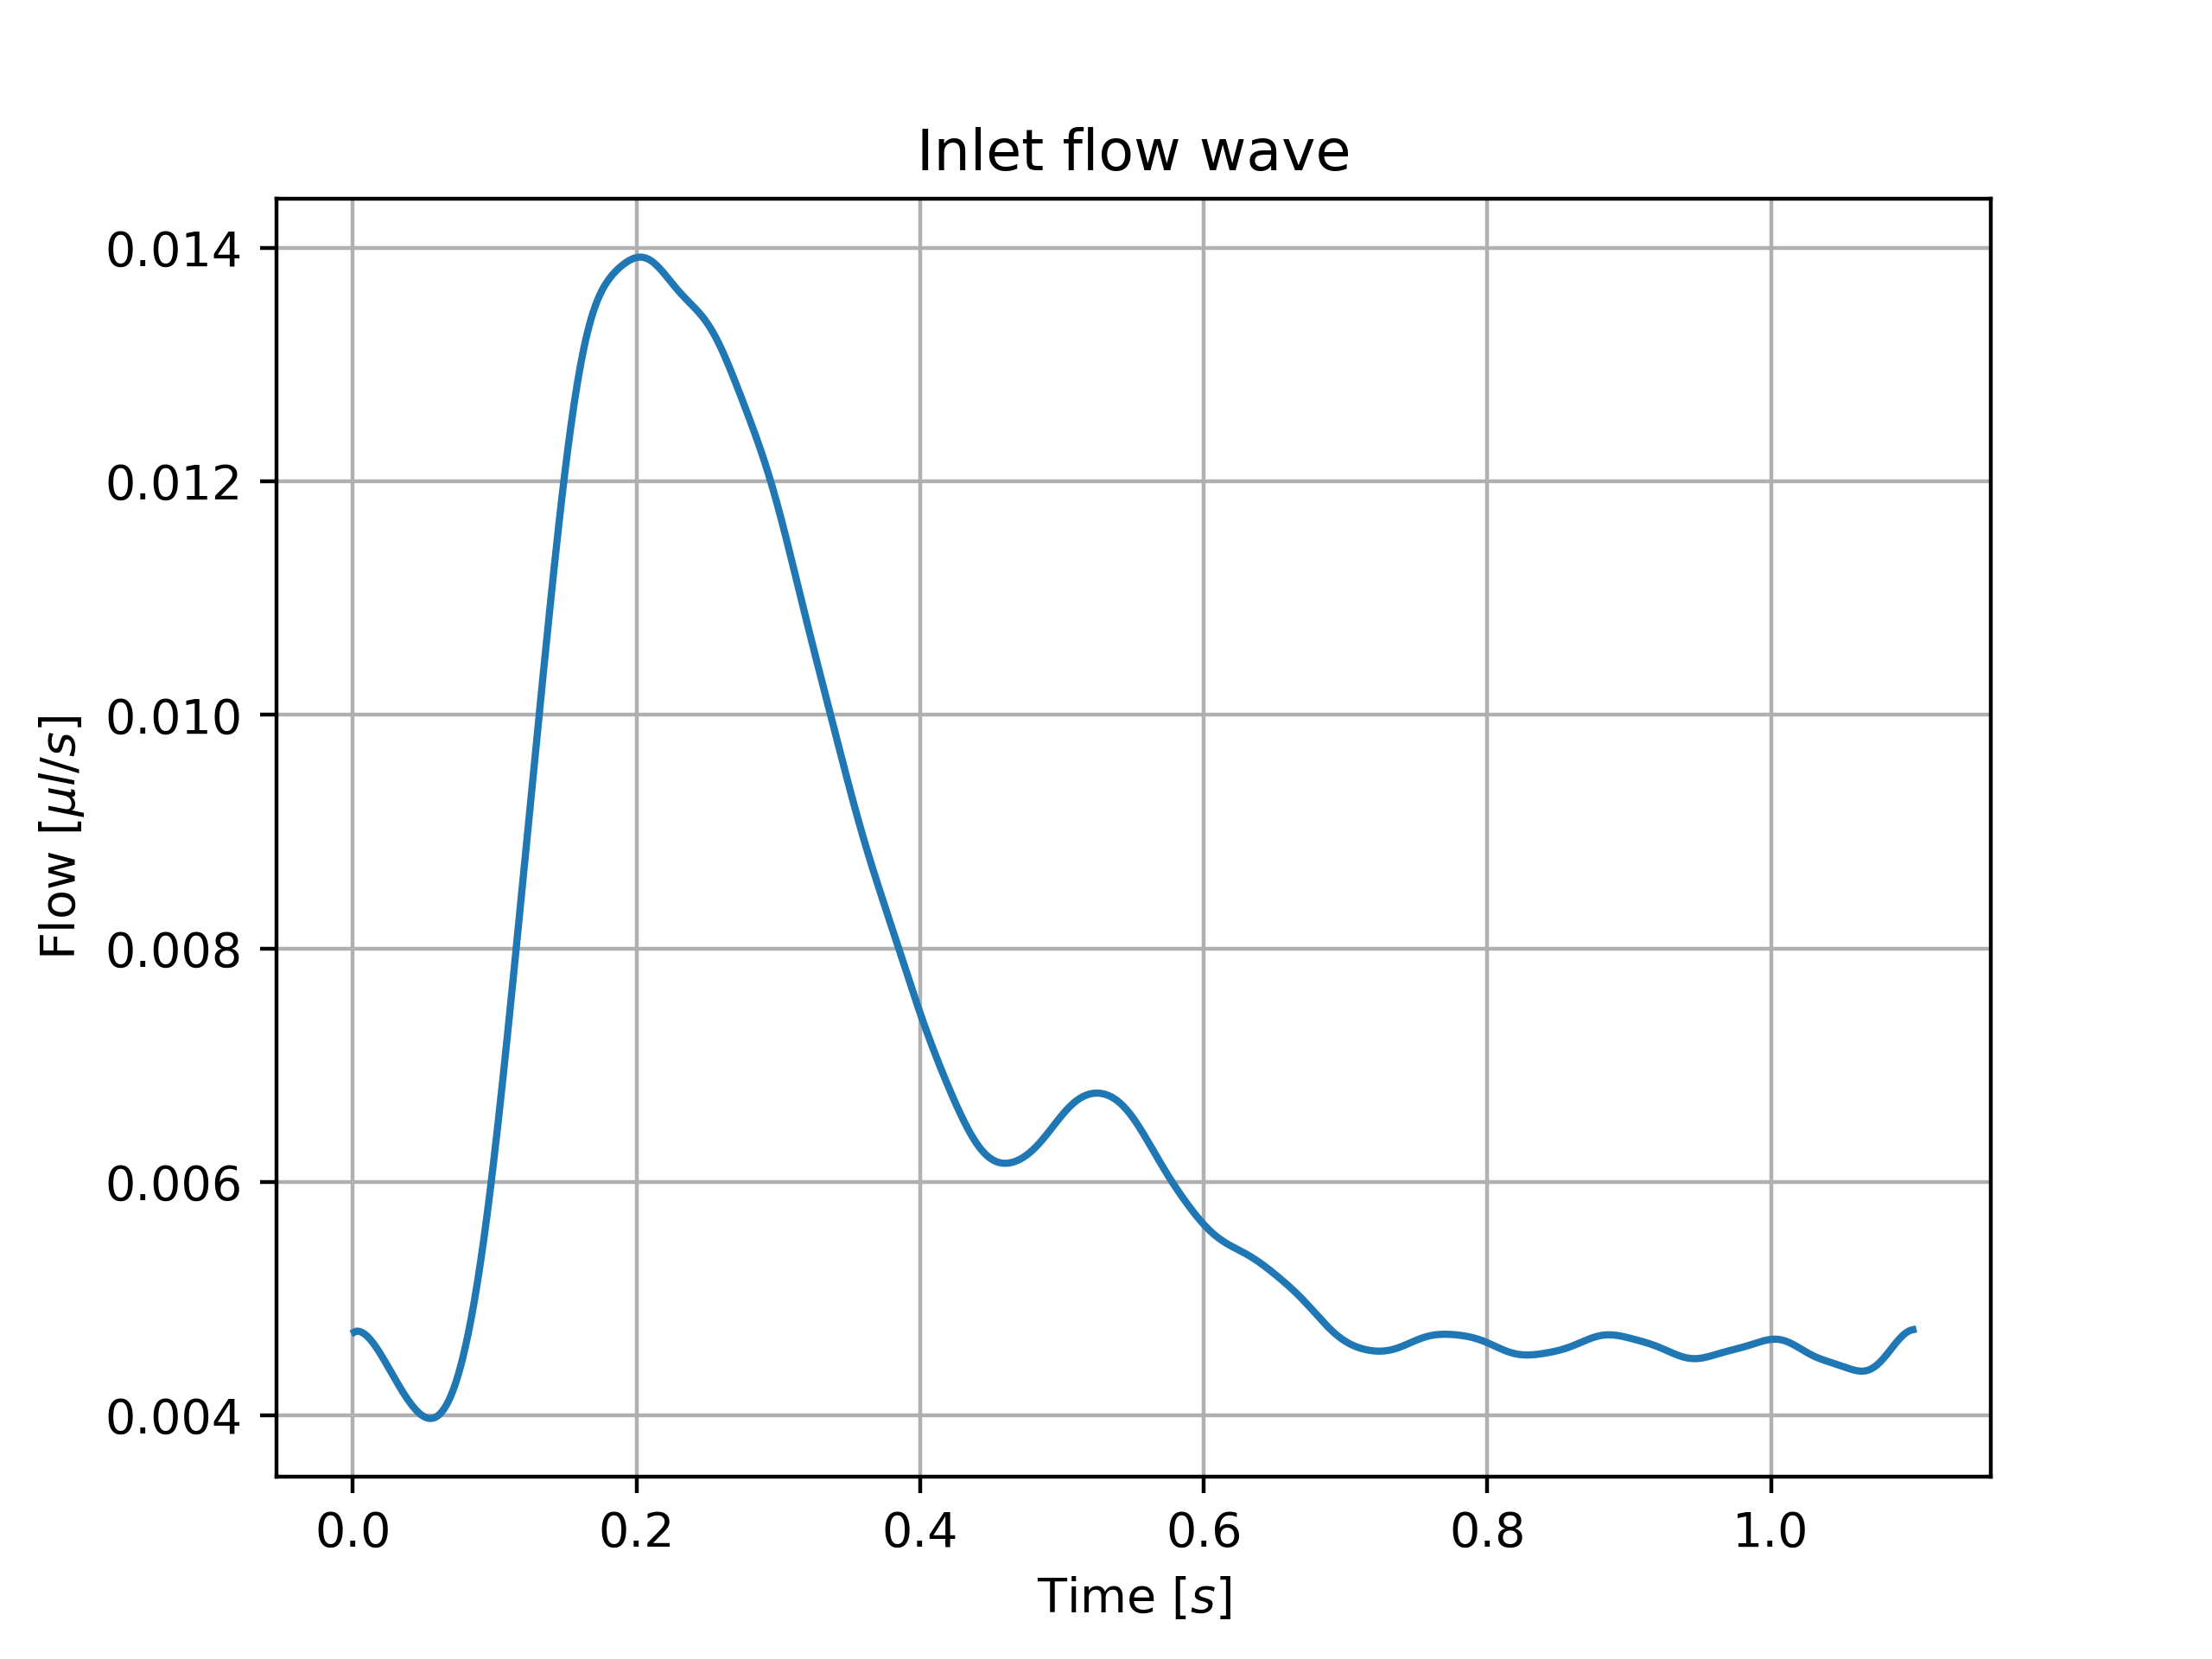
Figure 2: Flow wave prescribed at the inlet of the simple vascular network. The wave form is informed by the wave form in the common carotid artery (Boileau et al.7) and scaled to an average value of 6.8E-3µl/s derived using the scaling law reported by Kobari et al.11.
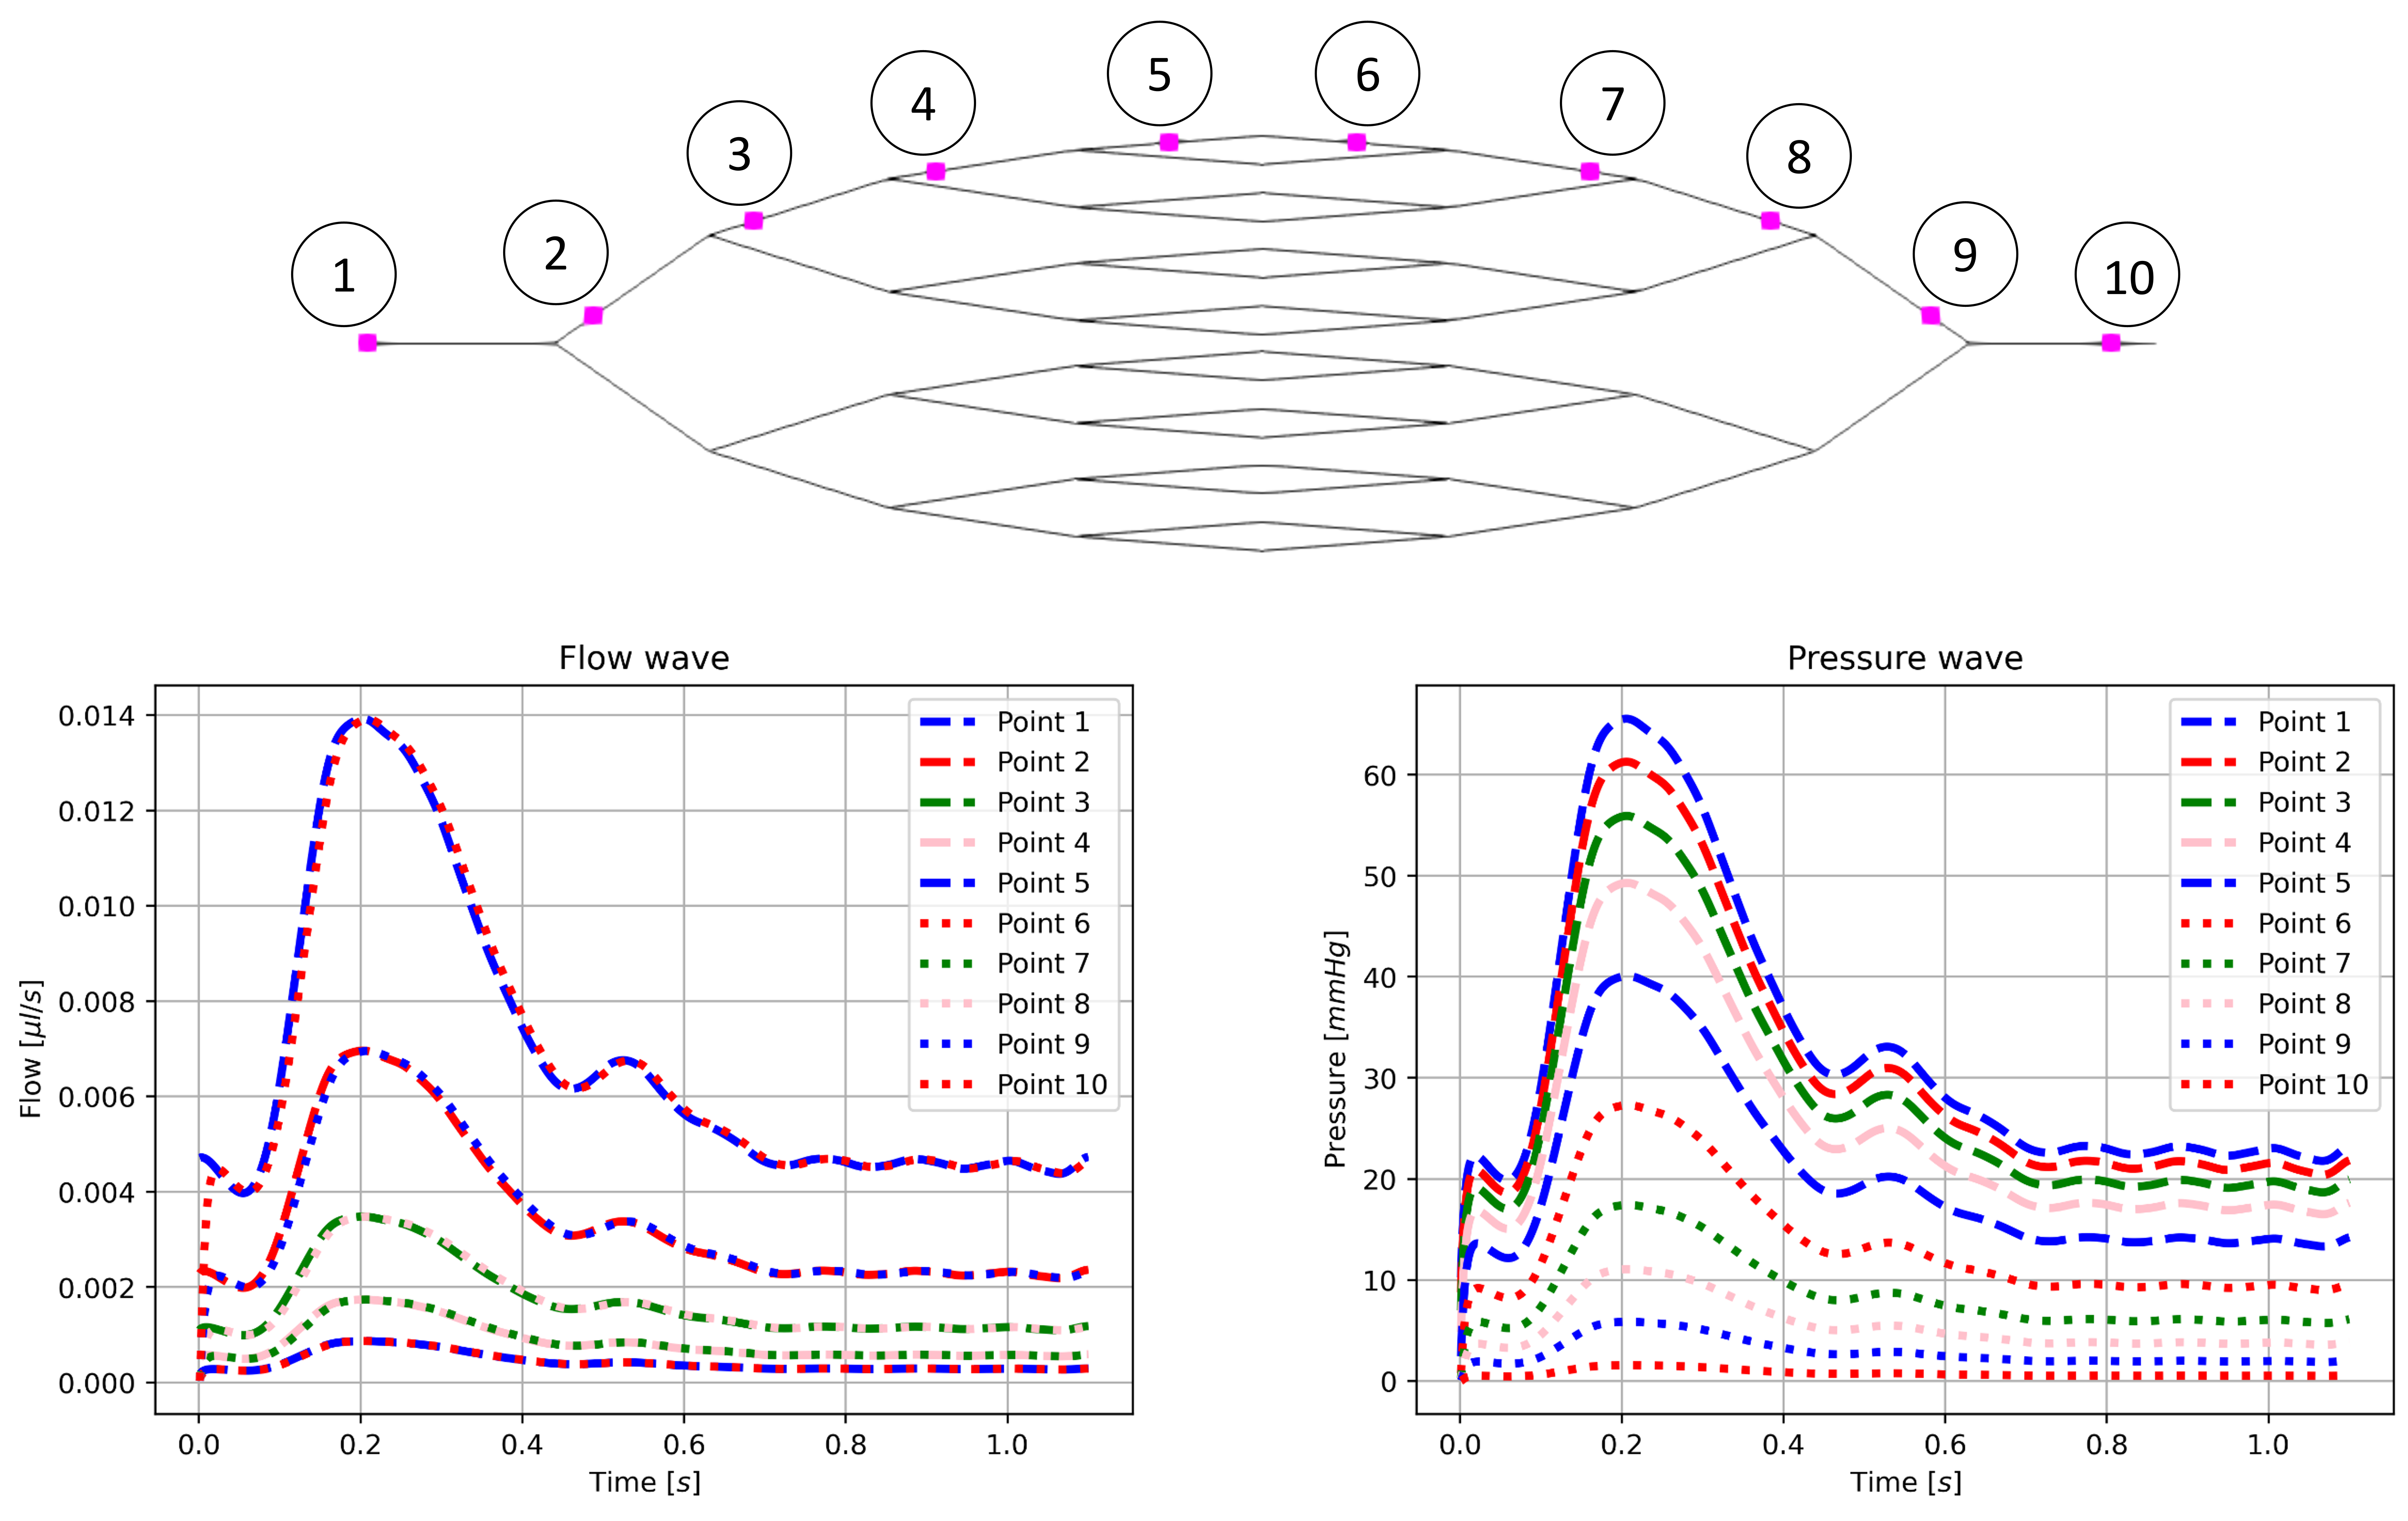
Figure 3: Flow and pressure waves were recorded over a cardiac cycle at 10 points in the simplified network. Flow decreases with continuous bifurcation and increases again on the venule side. A small time delay between distant points reflects the pulse wave velocity. The distance traveled from Point 1 to Point 10 divided by the time difference of 7.1E-3s gives an estimate of the pulse wave velocity of approximately 0.3m/s. Pressure waves decrease continuously in amplitude towards the outlet.
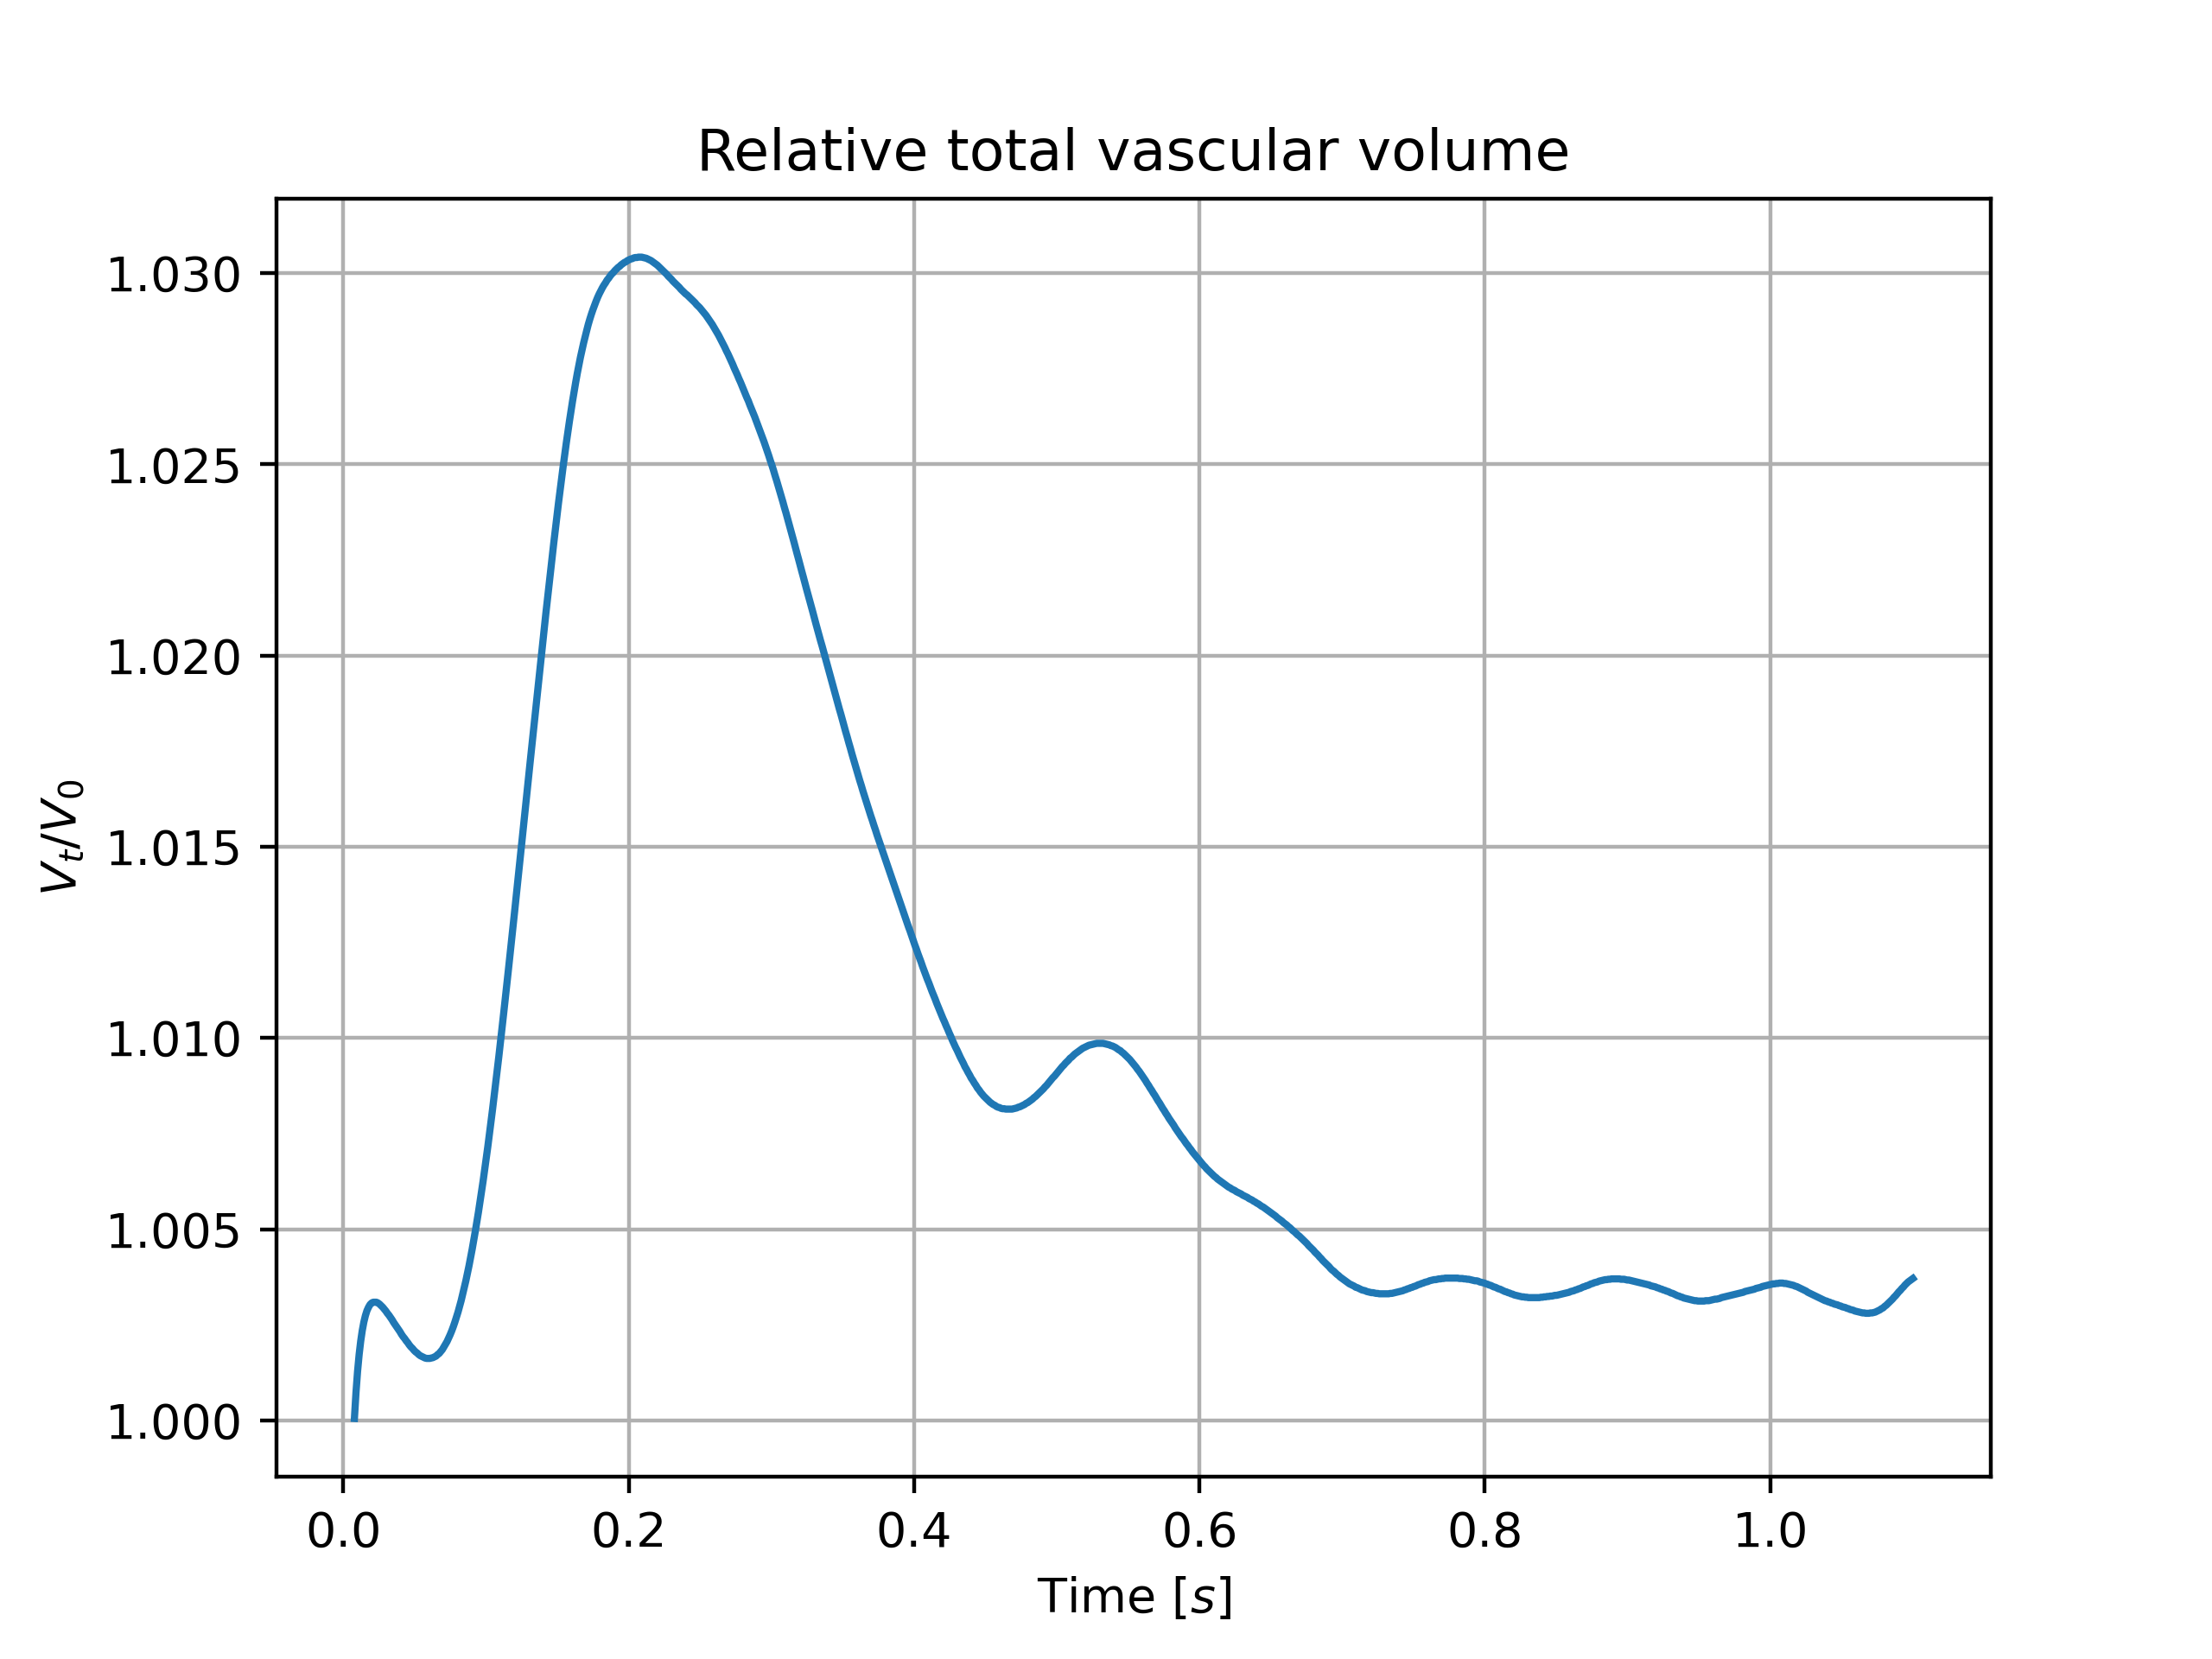
Figure 4: Relative volume of the entire deformed simple vascular system compared to the undeformed reference configuration. Initially, no deformation is present. Deformations up to 3% are observed during peak systole.
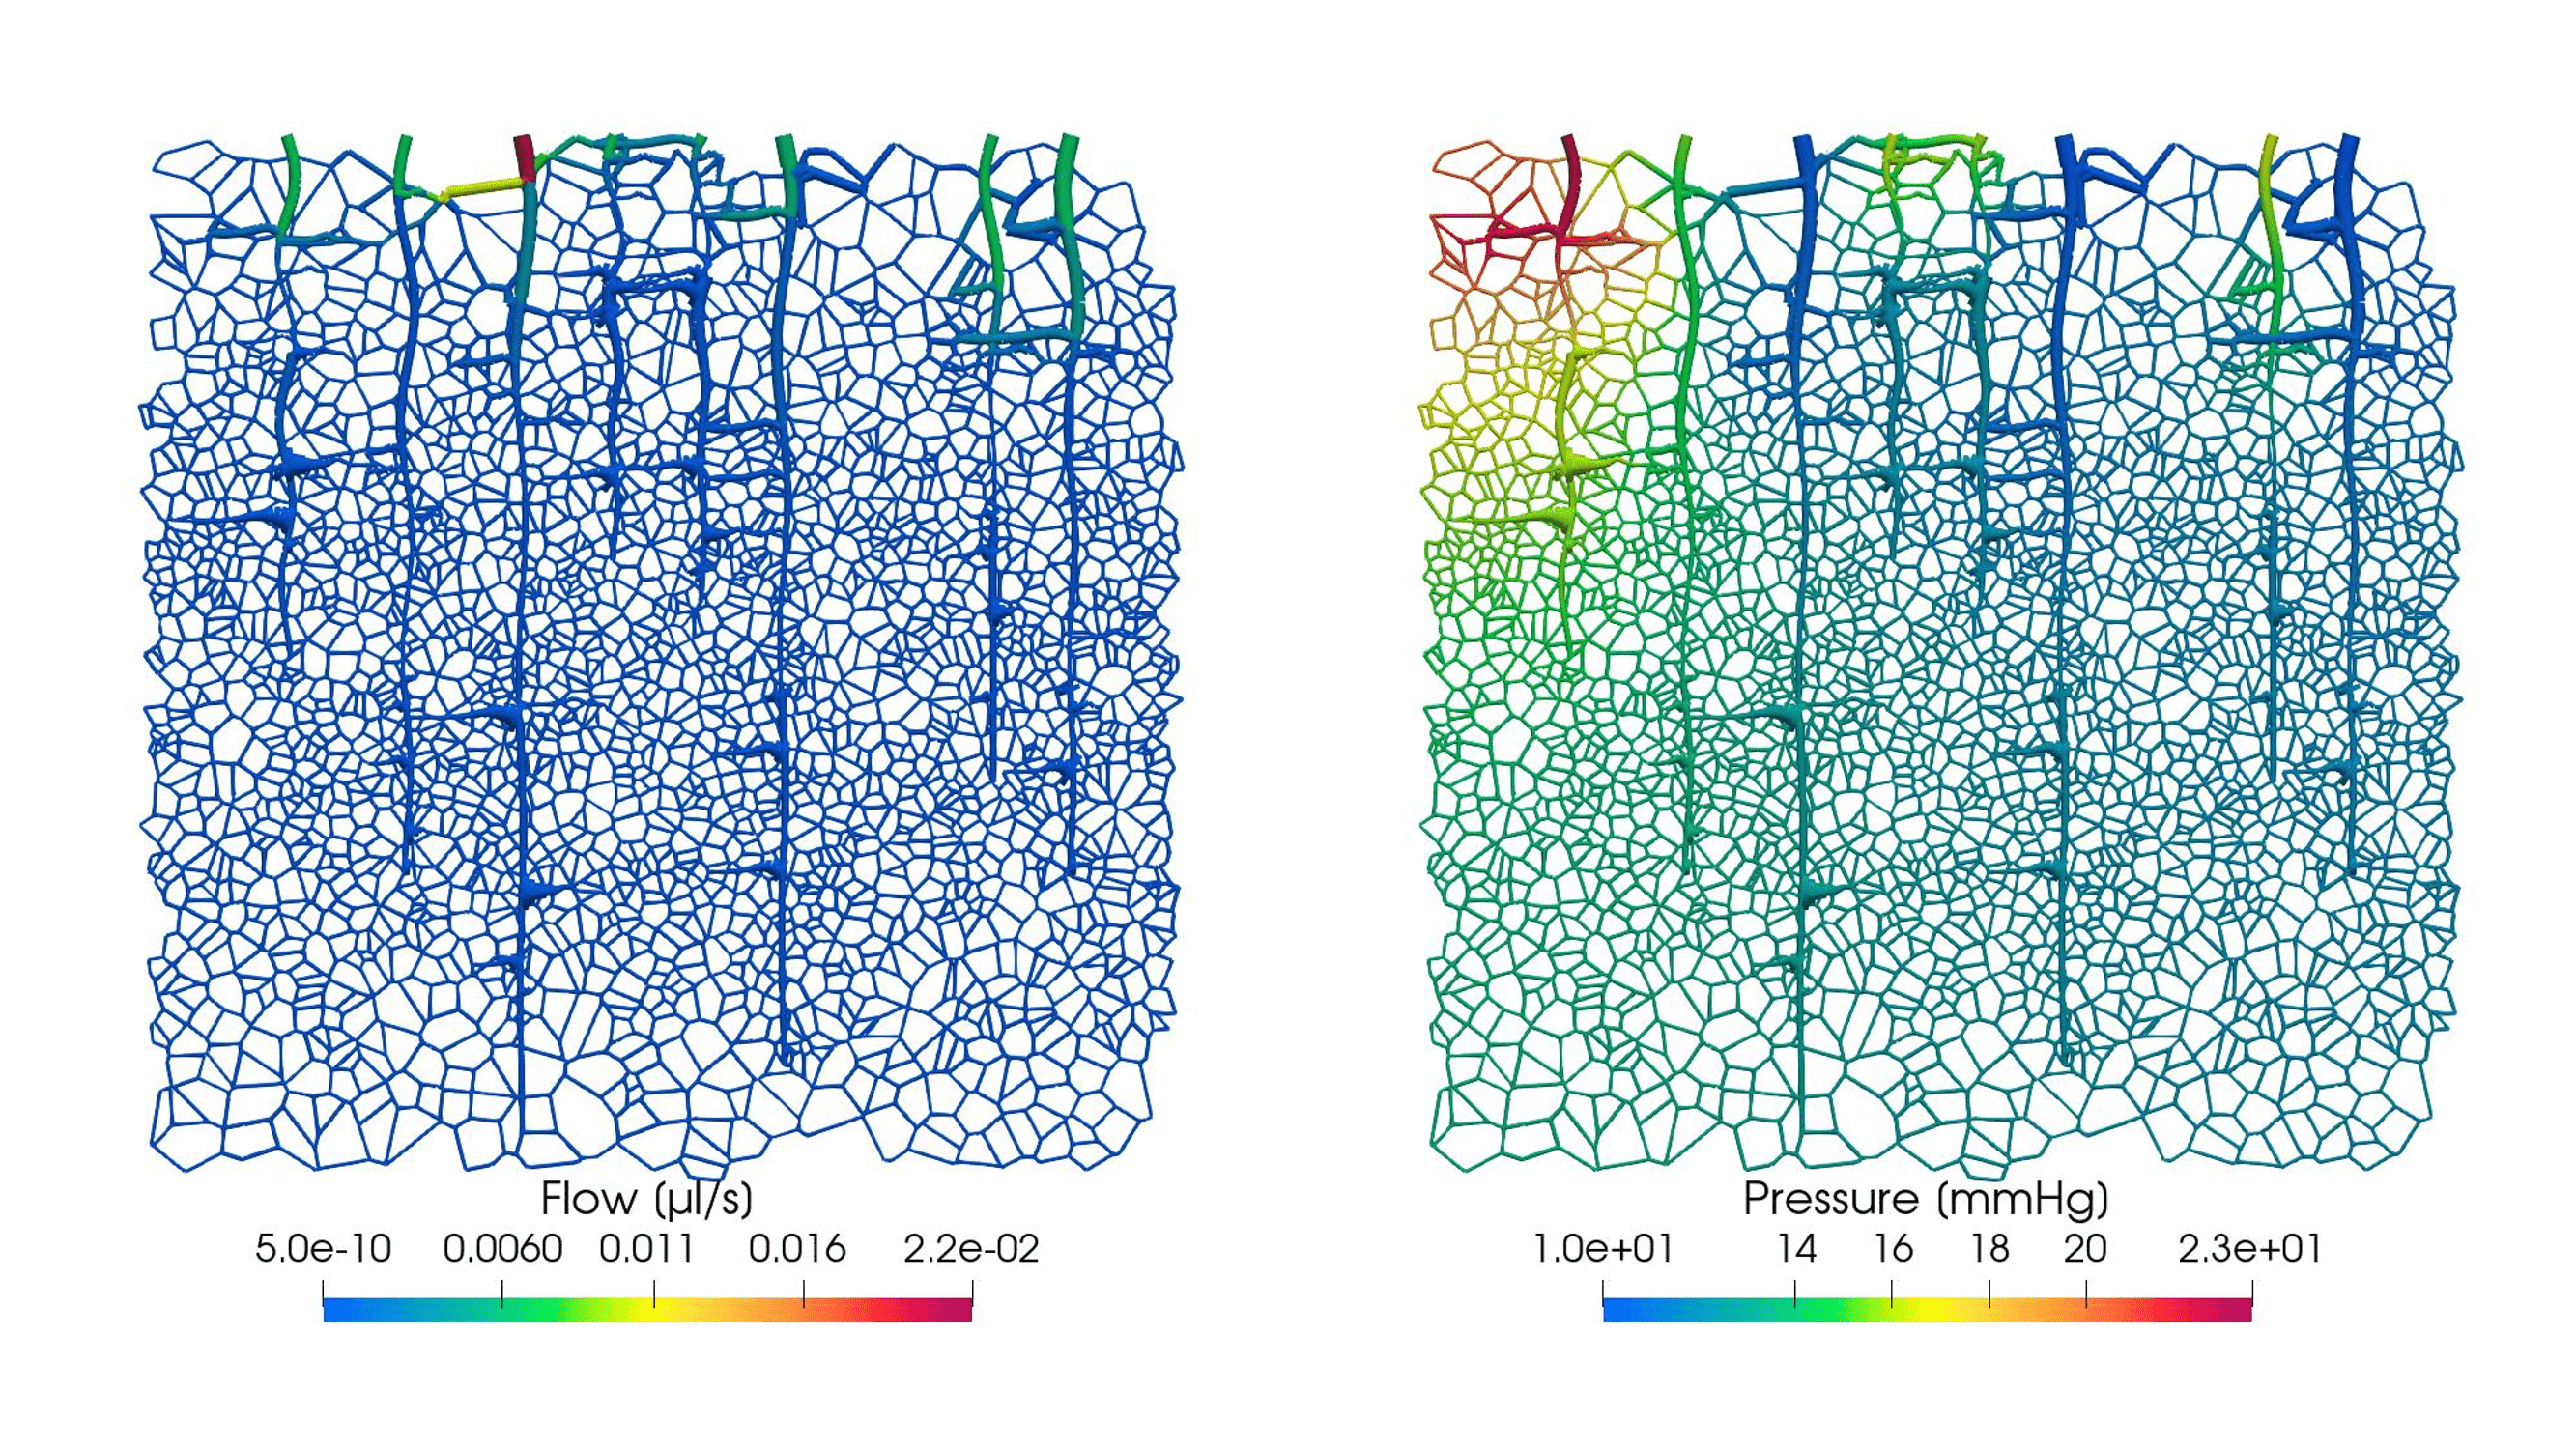
Figure 5: Static flow and pressure distribution in the 2D synthetically generated realistic vascular model. Inlet flow is prescribed at 6.8E-3µl/s derived using the scaling law reported by Kobari et al.11. Outlet pressure is set at 10mmHg.