2199
Vascularization's Impact on Neuronal Metrics in Human Visual Cortex1Psychiatry, Radboud UMC, Nijmegen, Netherlands, 2Radiology, UMC Utrecht, Utrecht, Netherlands, 3Department of psychology, NYU, New York, NY, United States, 4UMC Utrecht, Utrecht, Netherlands
Synopsis
Keywords: Blood Vessels, fMRI (task based), Neurovascular coupling
Motivation: We aimed to unravel the intricate relationship between neuronal metrics and vascularization in human visual cortex, addressing the need for a deeper understanding of these factors' impact on fMRI data.
Goal(s): Our study sought to determine if differences exist in pRF sizes between micro- and macro-vascular compartments and the influence of extra- and intra-vascular effects.
Approach: We obtained pRF estimates across cortical depth using different fMRI scan sequences (SE/GE) at varying field strengths (7T/3T).
Results: While our findings confirmed typical pRF size trends and vascularization-dependent amplitude effects across cortical depth, we did not find that vascularization or magnetic field strength affected pRF sizes.
Impact: This study's findings challenge the conventional understanding of how vascularization affects neuronal metrics in functional brain imaging. The research underscores the complexity of neurovascular interactions and their implications for the interpretation of fMRI data.
Introduction
Functional magnetic resonance imaging (fMRI) is an essential method for studying human brain function. However, fMRI does not reflect neuronal activity directly, but rather represents a complex process referred to as neurovascular coupling1. Consequently, vascular properties (e.g. vessel size) influence fMRI measurements. The current study investigates to what extent neuronal metrics such as population Receptive Field (pRF) measurements in visual cortex2,3 are influenced by non-neuronal vascularization properties. By using spin-echo (SE) and gradient-echo (GE) BOLD-fMRI, we capture micro-vascular and macro-vascular weighted BOLD signals. Micro-vascular signals better reflect neuronal activity, while macro-vascular signals are increasingly affected by large (draining) veins towards the pial surface4–6. BOLD-fMRI at 7T emphasizes extra-vascular effects, while 3T includes intra- and extra-vascular influences7. Therefore, BOLD-fMRI at 7T is expected to offer a more precise representation of the locus of neural activity compared to 3T measurements. We predict smaller pRF sizes in micro-vascular compartments, particularly in superficial cortical layers. Additionally, we anticipate larger pRF sizes at 3T compared to 7T due to the additional intra-vascular effects, enhancing our understanding of neurovascular interactions.Methods
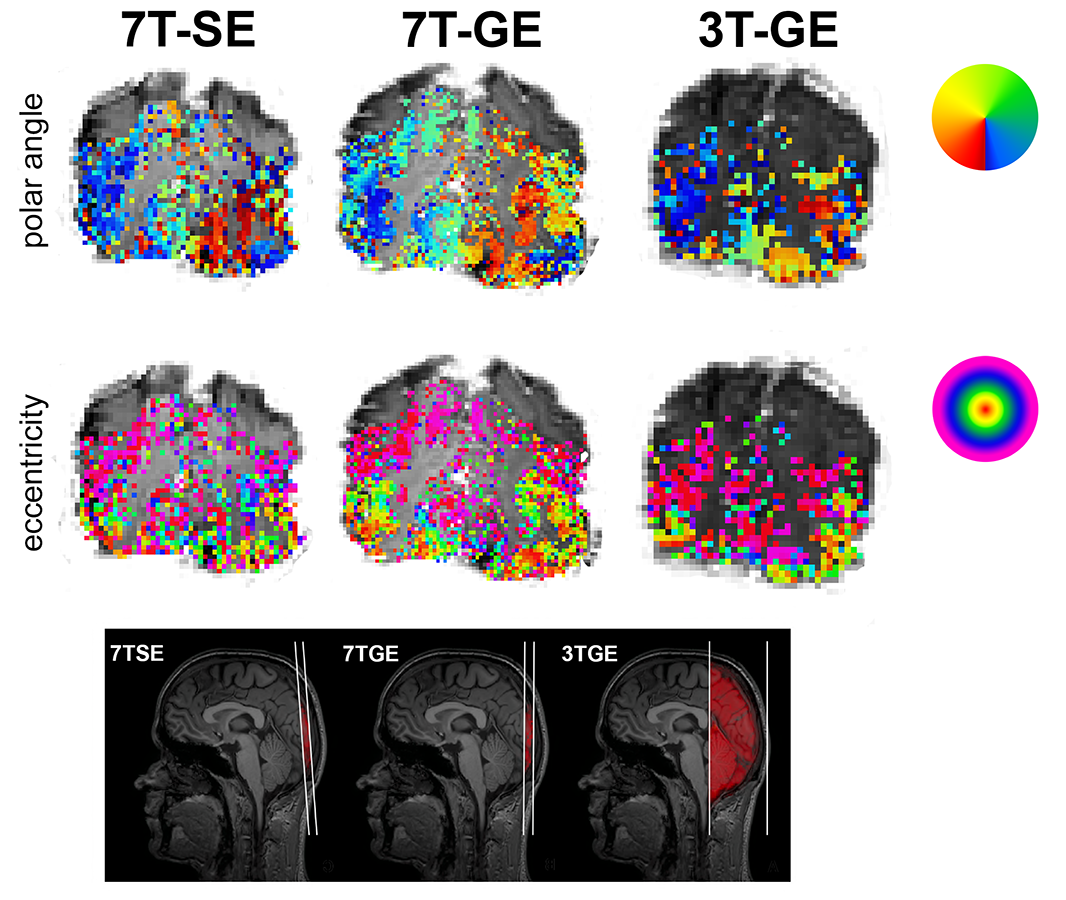
Ten healthy volunteers (mean age = 22.9, F = 5) participated in 3 fMRI sessions that differed with respect to field strength (7T / 3T) and scan sequence (SE / GE): 7TSE (voxel size: 1.5 mm isotropic), 7TGE (voxel size: 1.0 mm isotropic), and 3TGE (voxel size: 2.0 mm isotropic). The repetition time (TR) was 0.85 s for each session and the field of view was oriented in a way that matched the coverage of the occipital lobe in all sessions. During each session, 2 retinotopic visual field mapping experiments were conducted, consisting of 250 dynamics each. Cortical depth masks were created using LayNii software8. Two-dimensional pRF analysis was performed, resulting in estimated amplitude, pRF center (polar angle & eccentricity), and pRF size metrics (Figure 1). Voxels with a significant pRF goodness-of-fit statistic were selected and were assigned an ROI (V1, V2 or V3) and cortical depth label (deep, middle, superficial). Significance of fixed effects (fMRI-session, eccentricity representation, ROI, and cortical depth bin) on the estimated BOLD amplitude and pRF size was assessed using linear mixed effect models.Results
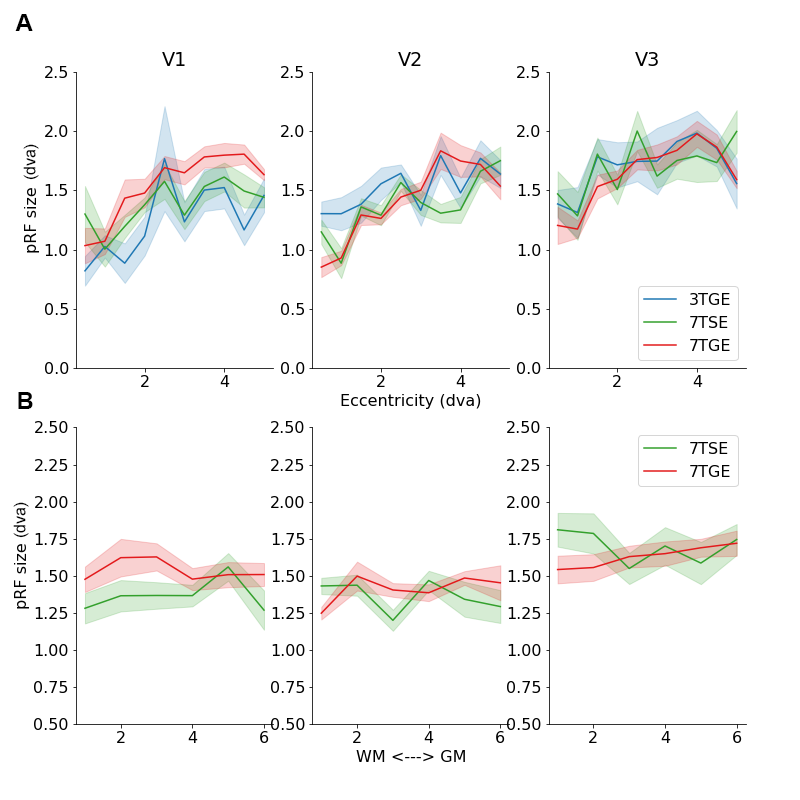
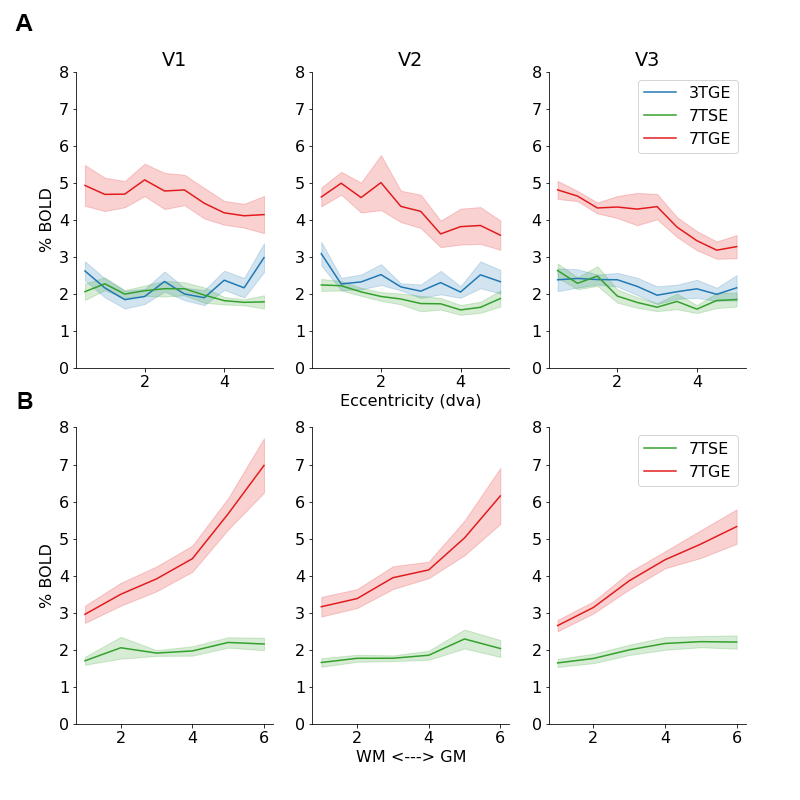
We confirmed the typical increases in pRF size across eccentricity representations (Z=8.32; β=0.268; 95%CI=[.205,.331]), and across the visual hierarchy from V1 to V2 and V3 (Z=3.47; β=0.089; 95%CI=[.039,.140]). However, we did not observe a difference in pRF size between the 3 fMRI sessions (Z=0.64; β=0.040; 95%CI=[-.161,.081]). Furthermore, we did not observe the previously reported smaller pRF sizes for middle cortical layers9 (Figure 2; Z=0.78; β=0.048; 95%CI=[-.084,.180]). However, we did observe the typical BOLD amplitude increase across cortical depth during 7TGE10 (Z=7.88; β=0.778; 95%CI=[.585,.972]), which was not seen for 7TSE (Figure 3; Z=1.91; β=0.121; 95%CI=[-.003,.245]). Generally, the BOLD amplitude during 7TGE was consistently larger compared to the other sessions (Z=10.76; β=2.145; 95%CI=[1.754,2.536]).Discussion
In this study, we utilized pRF size as a neuronal metric that has been verified independently of fMRI and across species11,12. We hypothesized that pRF sizes would depend on vascularization in combination with magnetization properties. However, our results cannot confirm such interpretation. Whilst typical pRF size effects -such as the pRF size increase across eccentricity representation and visual hierarchy3- can be confirmed, we did not observe a difference in pRF size across scan sessions. Therefore, pRF sizes were not dependent on vascular compartment size or intra- / extra-vascular magnetization effects. Additionally, we did not observe pRF size differences across cortical depth, neither for micro- or macro-vascular compartments. Possibly, our study lacked the required spatial resolution to detect these cortical depth-dependent effects. However, we did observe a strong BOLD amplitude increase across cortical depth for 7TGE, which was not observed for 7TSE, indicative of sufficient cortical depth-dependent sensitivity. A putative explanation for these findings is that fMRI pRF estimates do not reflect neuronal tuning functions that are propagated through neurovascular interactions, but rather reflect (complex) channel response functions that not necessarily linearly relate to neuronal tuning curves13.Conclusion
This study explored the influence of vascularization on pRF size estimates in the human visual cortex. Our results suggest that pRF sizes do not vary significantly with vascular compartment size or magnetic field strength. While limitations in spatial resolution may account for some findings, the strong BOLD amplitude increase in 7TGE hints at a complex channel response rather than a direct reflection of neuronal tuning curves. This research enhances our understanding of the interplay between neurovascular factors and neuronal metrics in fMRI studies of human brain function.Acknowledgements
This work was supported by the National Institute Of Mental Health of the National Institutes of Health under Award Number R01MH111417References
1. Huneau, C., Benali, H. & Chabriat, H. Investigating human neurovascular coupling using functional neuroimaging: A critical review of dynamic models. Front. Neurosci. 9, 1–12 (2015).
2. Dumoulin, S. O. & Wandell, B. A. Population receptive field estimates in human visual cortex. Neuroimage 39, 647–60 (2008).
3. Wandell, B. A. & Winawer, J. Computational neuroimaging and population receptive fields. Trends Cogn. Sci. 19, 349–357 (2015).
4. Uludaǧ, K., Müller-Bierl, B. & Uǧurbil, K. An integrative model for neuronal activity-induced signal changes for gradient and spin echo functional imaging. Neuroimage 48, 150–165 (2009).
5. Zhao, F., Wang, P. & Kim, S. G. Cortical Depth-Dependent Gradient-Echo and Spin-Echo BOLD fMRI at 9.4T. Magn. Reson. Med. 51, 518–524 (2004).
6. Siero, J. C. W. et al. BOLD Specificity and Dynamics Evaluated in Humans at 7 T: Comparing Gradient-Echo and Spin-Echo Hemodynamic Responses. PLoS One 8, 1–8 (2013).
7. Uludağ, K. & Blinder, P. Linking brain vascular physiology to hemodynamic response in ultra-high field MRI. Neuroimage 168, 279–295 (2018).
8. Huber, L. (Renzo) R. et al. LayNii: A software suite for layer-fMRI. Neuroimage 237, 118091 (2021).
9. Fracasso, A., Dumoulin, S. O. & Petridou, N. Point-spread function of the BOLD response across columns and cortical depth in human extra-striate cortex. Prog. Neurobiol. 102034 (2021) doi:10.1016/j.pneurobio.2021.102034.
10. Van Dijk, J. A., Fracasso, A., Petridou, N. & Dumoulin, S. O. Linear systems analysis for laminar fMRI: Evaluating BOLD amplitude scaling for luminance contrast manipulations. Sci. Rep. 10, 1–15 (2020).
11. Van Den Bergh, G., Zhang, B., Arckens, L. & Chino, Y. M. Receptive-field properties of V1 and V2 neurons in mice and macaque monkeys. J. Comp. Neurol. 518, 2051–2070 (2010).
12. Dräger, U. C. Receptive fields of single cells and topography in mouse visual cortex. J. Comp. Neurol. 160, 269–289 (1975).
13. Gardner, J. L. & Merriam, E. P. Population Models, Not Analyses, of Human Neuroscience Measurements. Annu. Rev. Vis. Sci. 7, 225–255 (2021).
Figures