2198
Field-dependent Regional BOLD Responses to Varied Transient Hypoxic Stimuli in Mice1Institute for Basic Science, Suwon, Korea, Republic of, 2Sungkyunkwan University, Suwon, Korea, Republic of, 3University of Toronto, Toronto, ON, Canada, 4University Health Network, Toronto, ON, Canada
Synopsis
Keywords: Blood Vessels, Blood vessels, BOLD dynamic susceptibility contrast
Motivation: Heterogenous BOLD responses are expected across brain regions due to different baseline blood volumes. However, there are very few experimental data to show regional differences of ΔR2*.
Goal(s): To determine regional ΔR2* by graded hypoxia and to elucidate field dependency of regional ΔR2* to transient hypoxic stimuli.
Approach: Three hypoxic conditions (90%N2, 95%N2, 100%N2) were administered to anesthetized mice in two different magnetic field strengths of 9.4T and 15.2T.
Results: The peak ΔR2* map revealed heterogenous BOLD responses across regions. Field-dependent ΔR2* ratio to 15.2T to 9.4T is close to the ratio of the magnetic field strengths.
Impact: We quantitatively determined regional BOLD responses in whole brain to hypoxia, which is dependent on baseline blood volume. Our result can serve as reference data for normalizing sensitivity of BOLD responses evoked by neuronal activity or vascular stimuli across regions.
Introduction
BOLD fMRI is highly dependent on paramagnetic deoxyhemoglobin change within the voxel1, which is depends on blood oxygenation level and blood volume changes. Since regional baseline cerebral blood volume (CBV) is heterogeneous across the whole brain, of the sensitivity of the BOLD fMRI signals varies across and within different regions. To address this, it is critical to determine a region- or voxel-specific calibration constant to compensate blood volume differences2. To that end, hypercapnic, hyperoxia, and/or hypoxia stimulus have been used for modulating blood oxygenation level globally without changing oxygen metabolism3,4. The change in R2* (ΔR2*) induced by hypoxic stimuli is influenced by vascular density and composition, intravascular/extravascular contributions, hypoxic stimulus dose, and magnetic field strength1. Thus, investigating BOLD effects induced by hypoxia at multiple magnetic fields can provide valuable insights into the regional heterogeneity of blood volume-dependent calibration constants and magnetic field dependency. In this study, we aimed to measure whole-brain BOLD fMRI responses in mice to three different 5-second hypoxia stimuli at both 9.4T and 15.2T.Methods
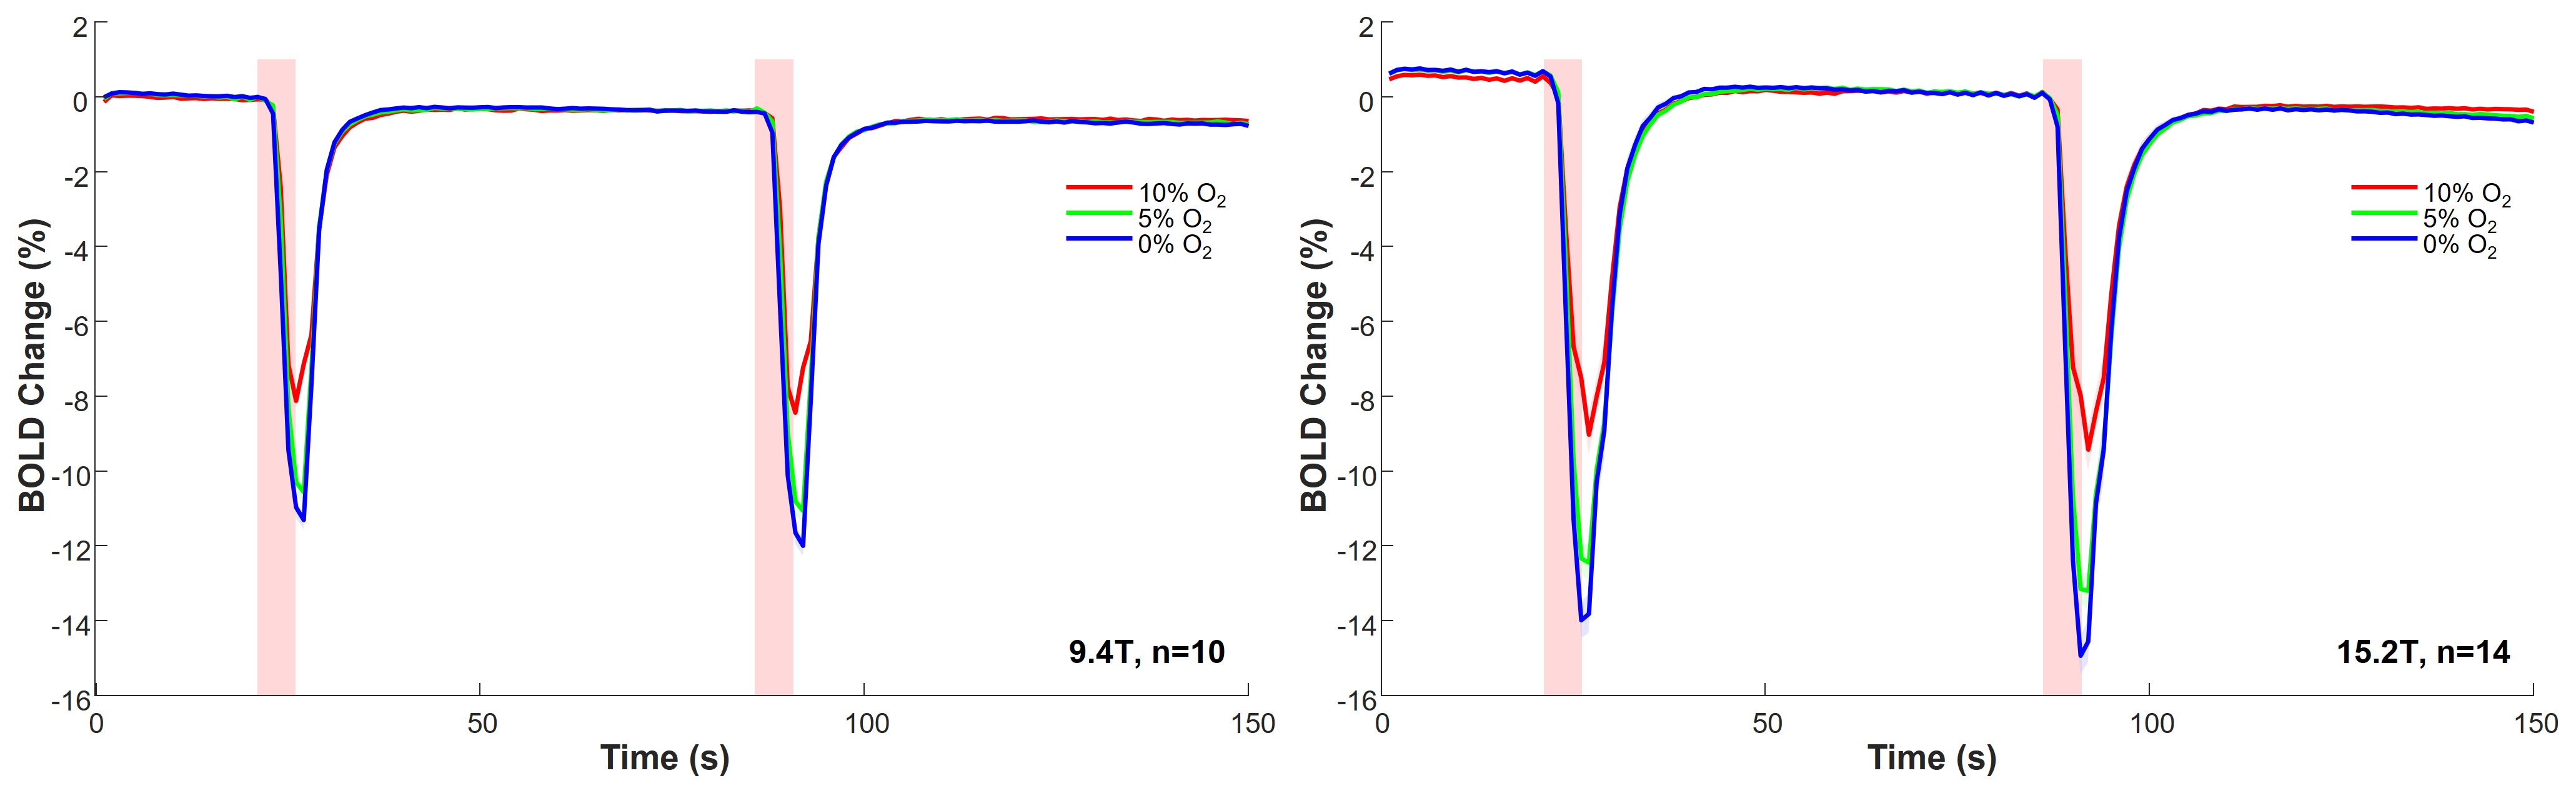
Animals and Hypoxic Gas Stimulations: Twenty-four C57BL/6 adult mice (8 – 13 weeks old) were used under 1.5% isoflurane. Three different transient hypoxic stimulations (100%N2/0%O2, 95%N2/5%O2, 90%N2/10%O2) were delivered using a block design paradigm of 60s rest (40% O2/ 60% N2) and 5s stimulation alternatively repeated two times (Figure 1.A).BOLD acquisitions: BOLD MRI studies were acquired on 9.4T (n=10) and 15.2T (n=14) using GE-EPI with TR/TE =1000/11 ms, FA=50, 156x156x500 , and 20 slices.
Data analysis: ROIs were defined based on Allen mouse brain atlas. ΔR2* time courses were determined based on the baseline-normalized EPI time-course dataset4, and their peak levels were used for quantitative analysis.
Results
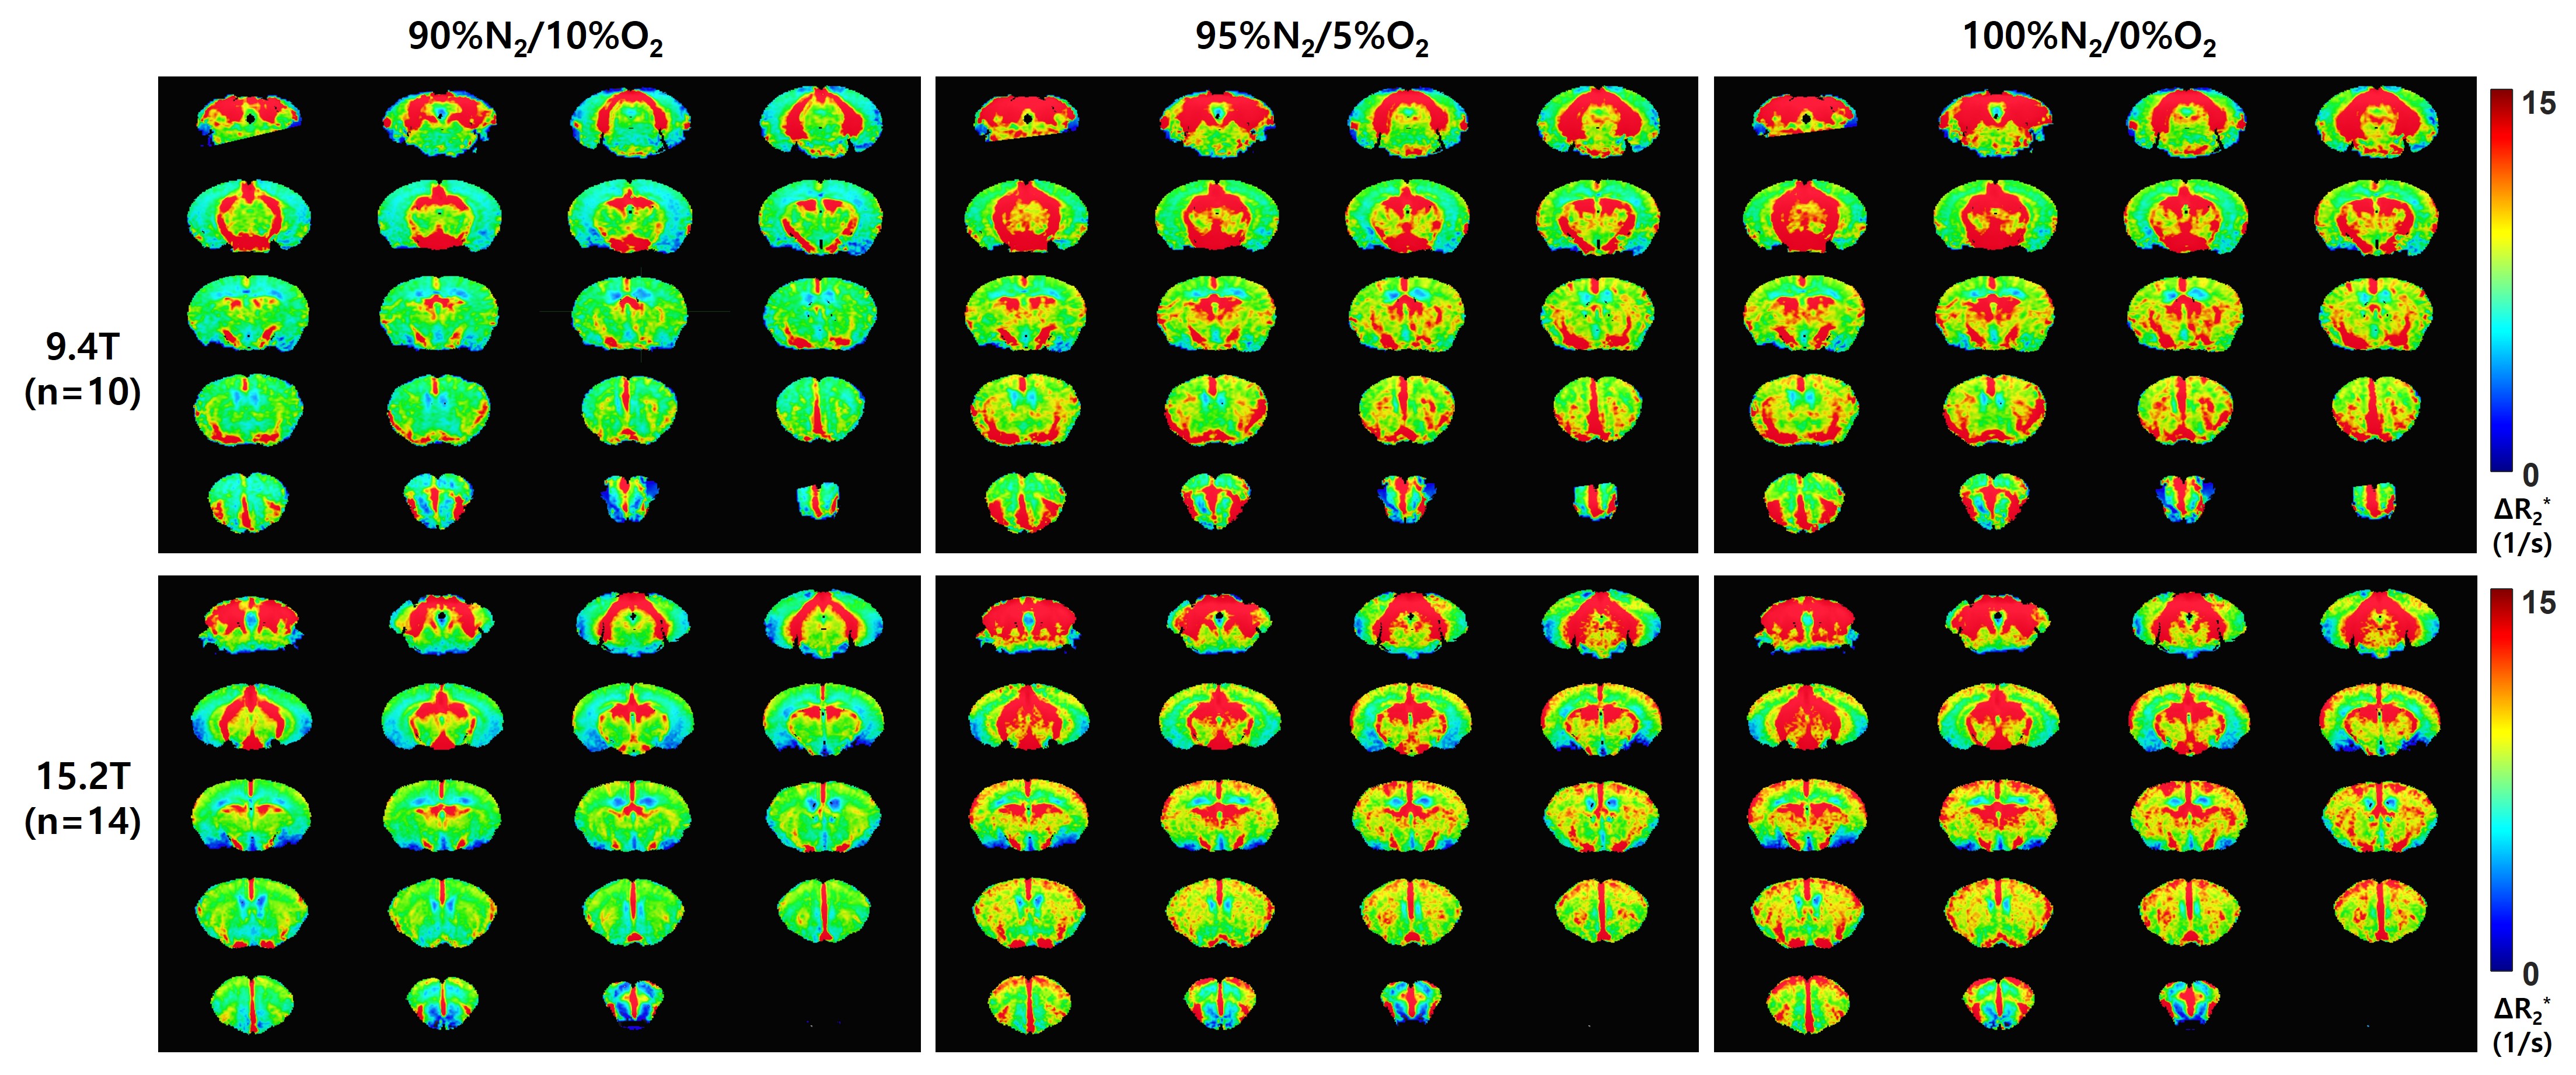
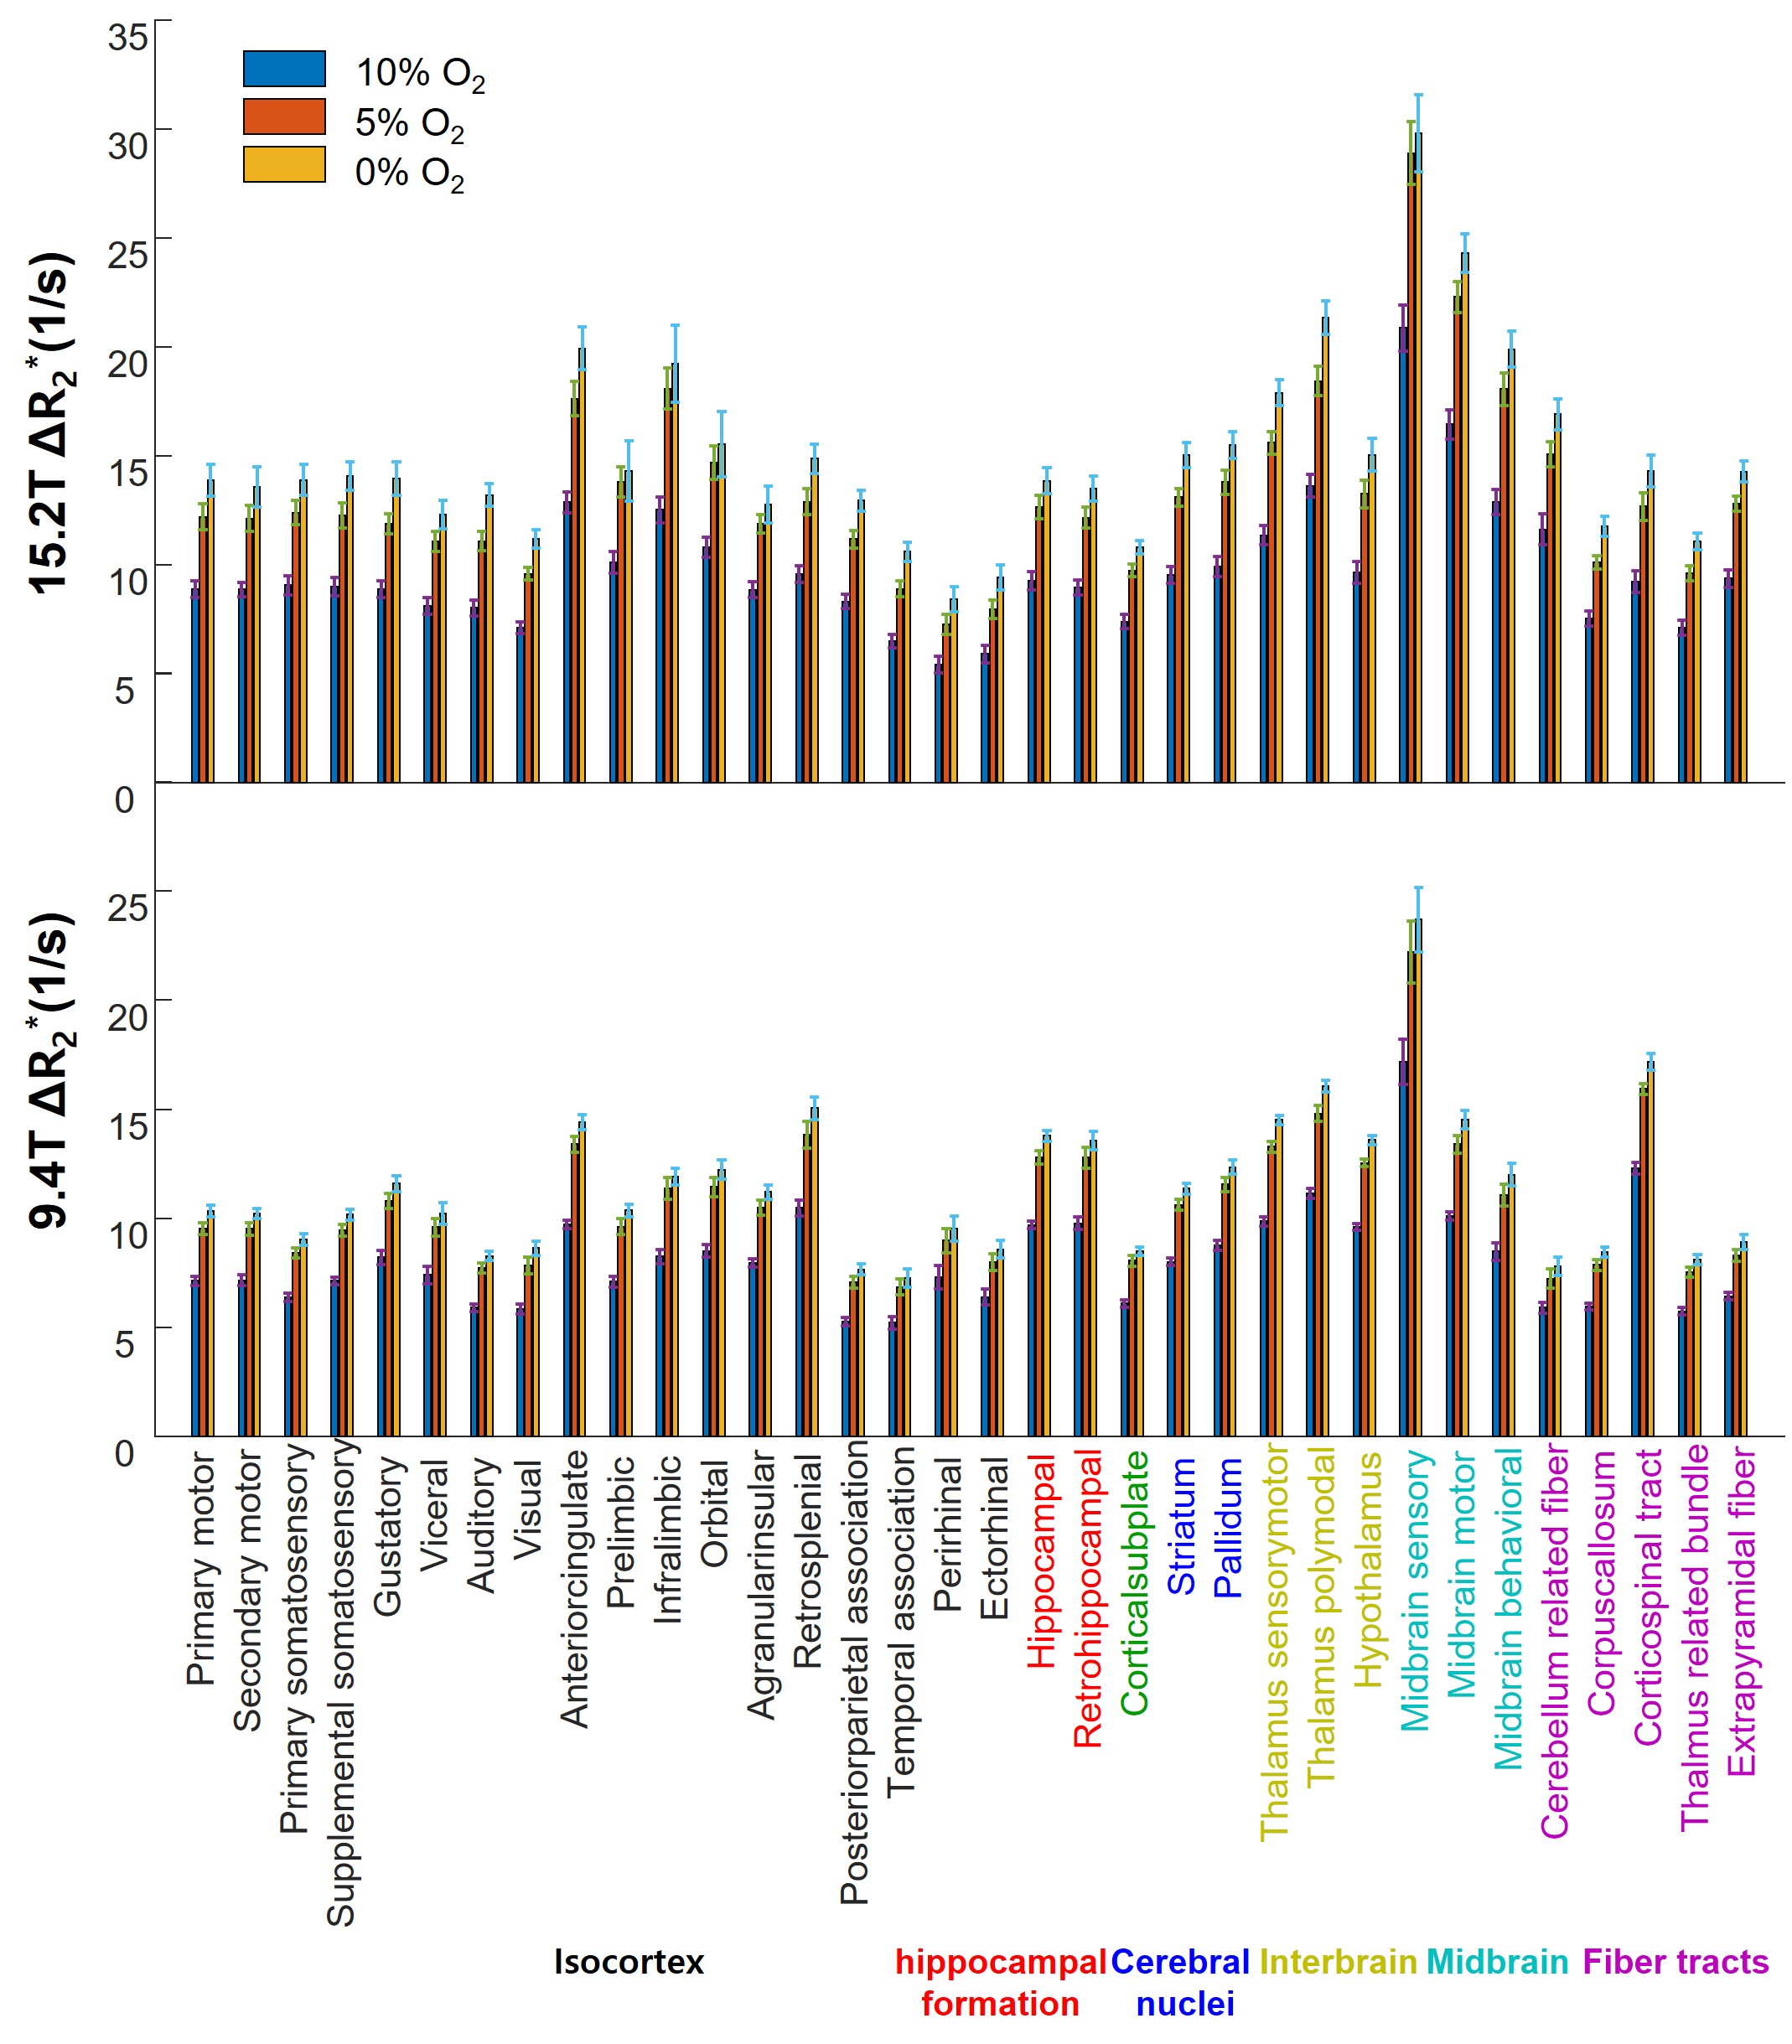
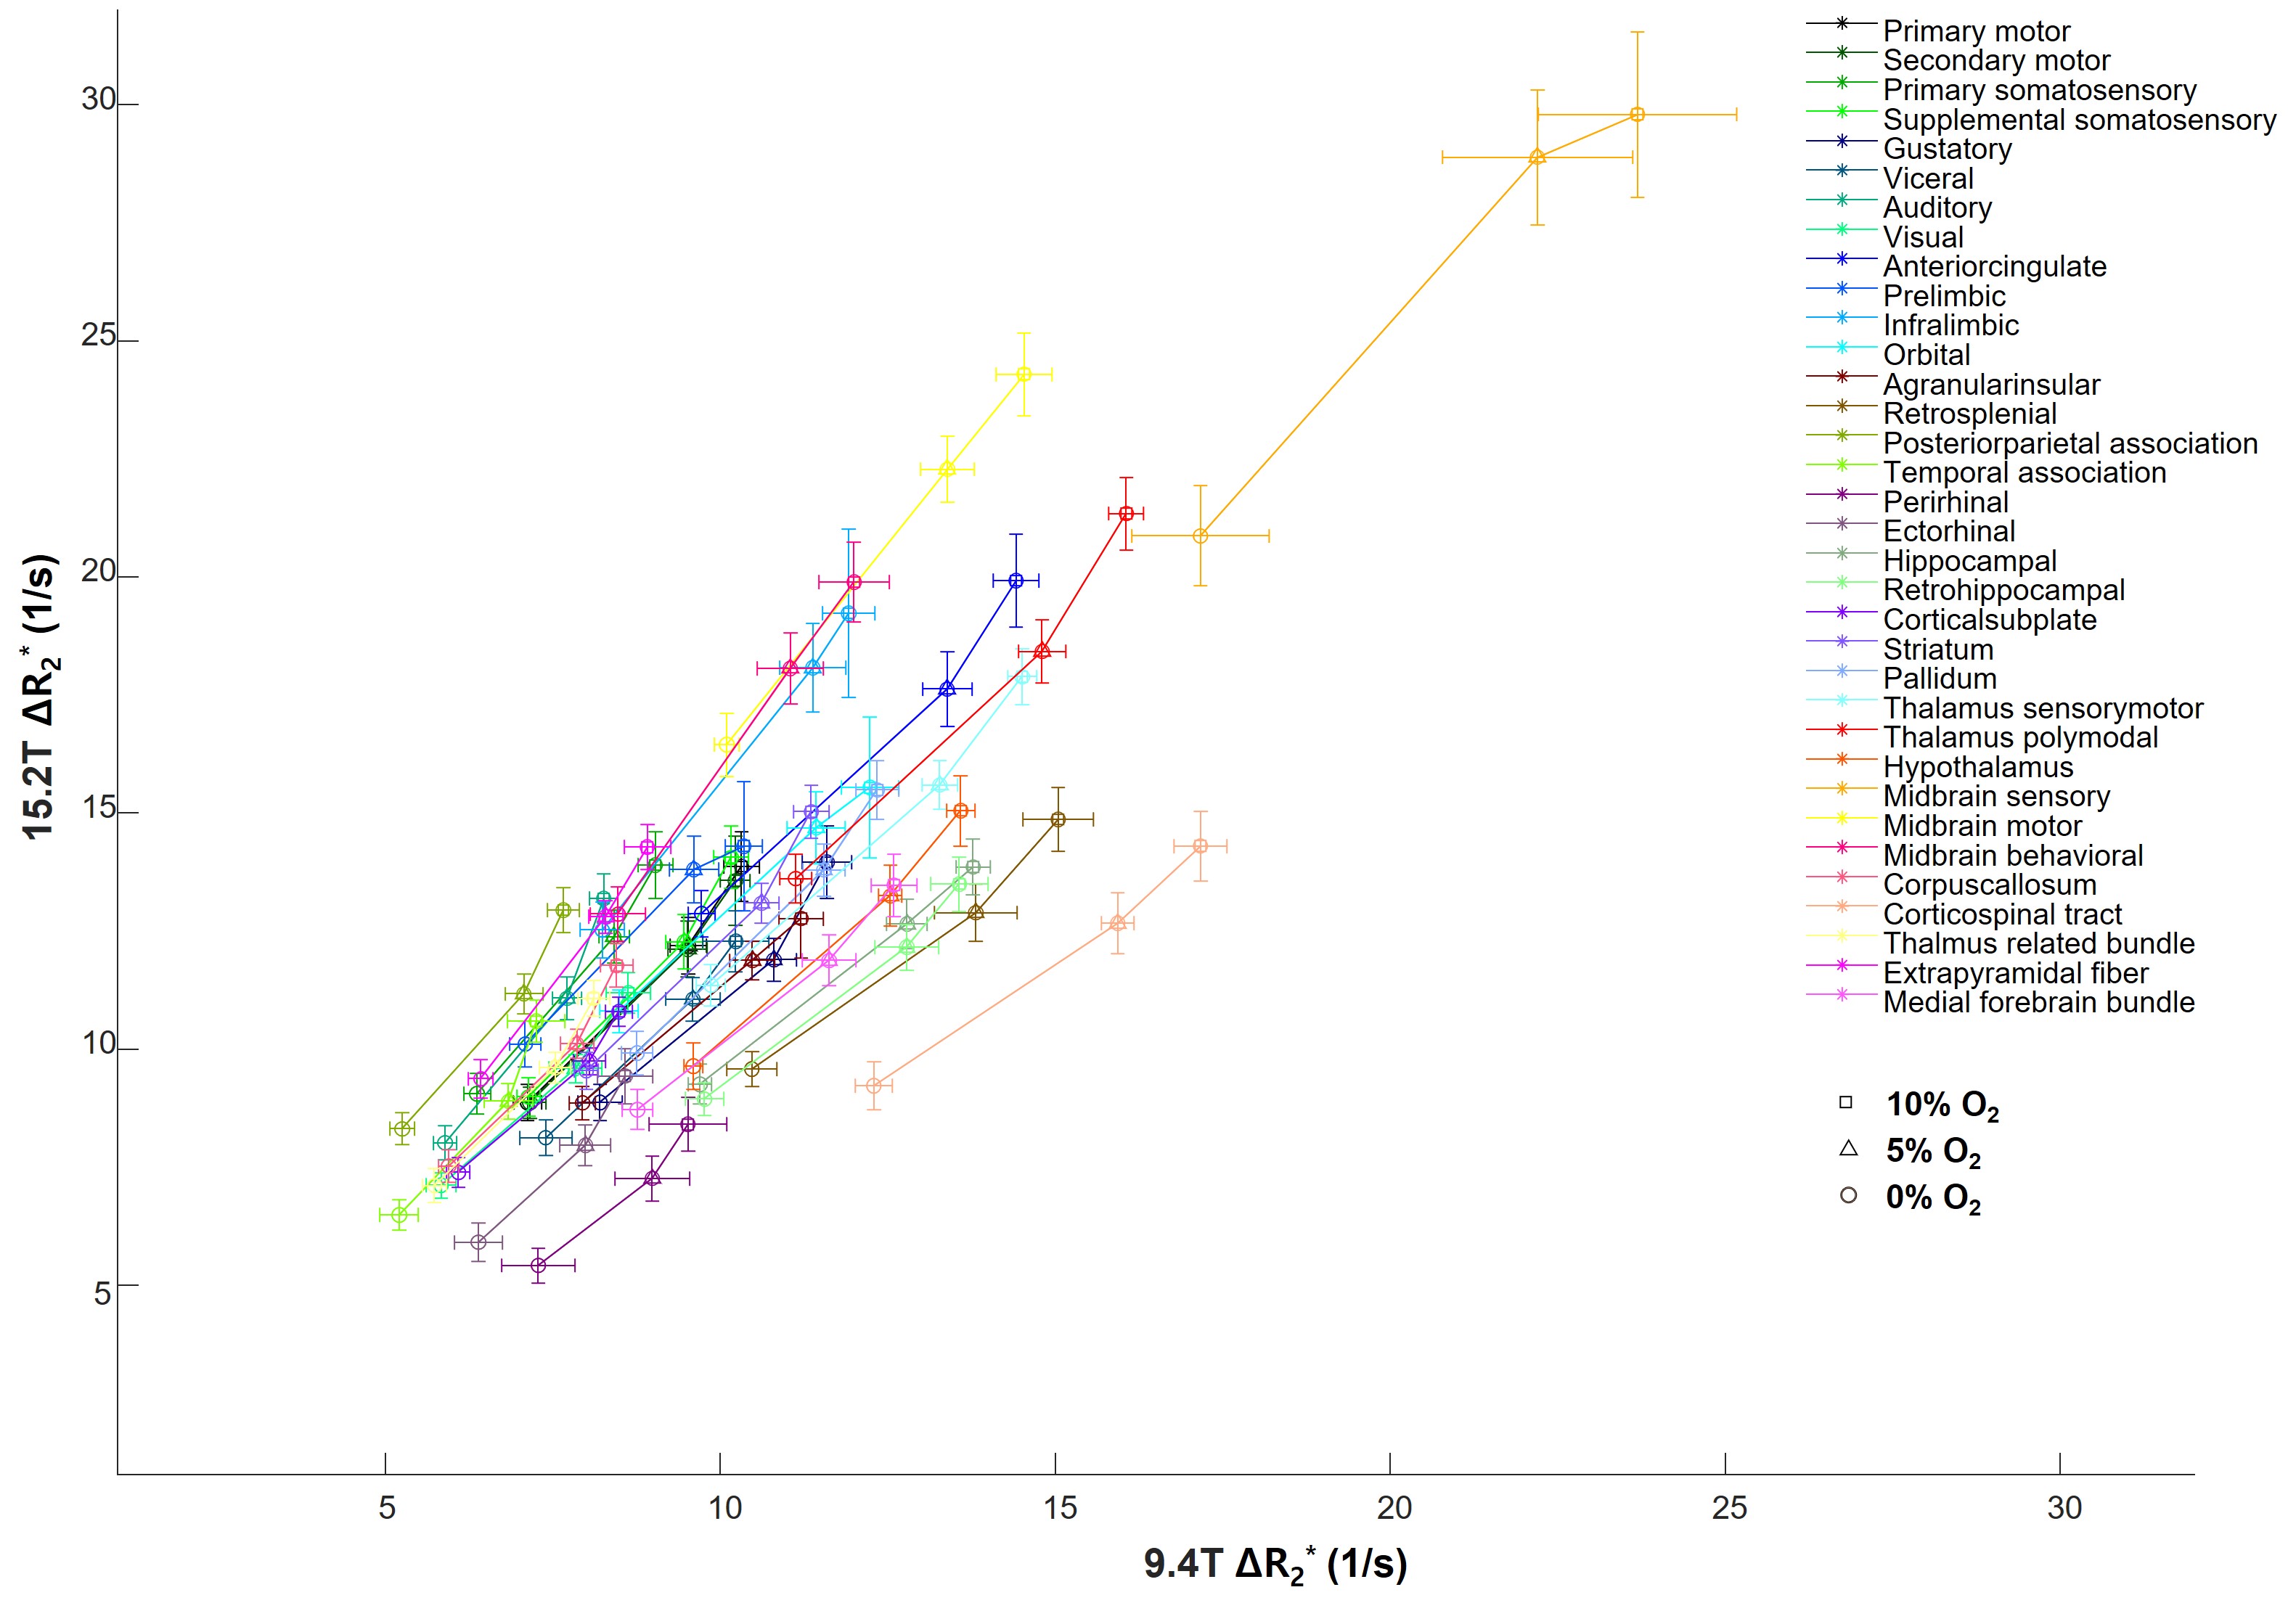
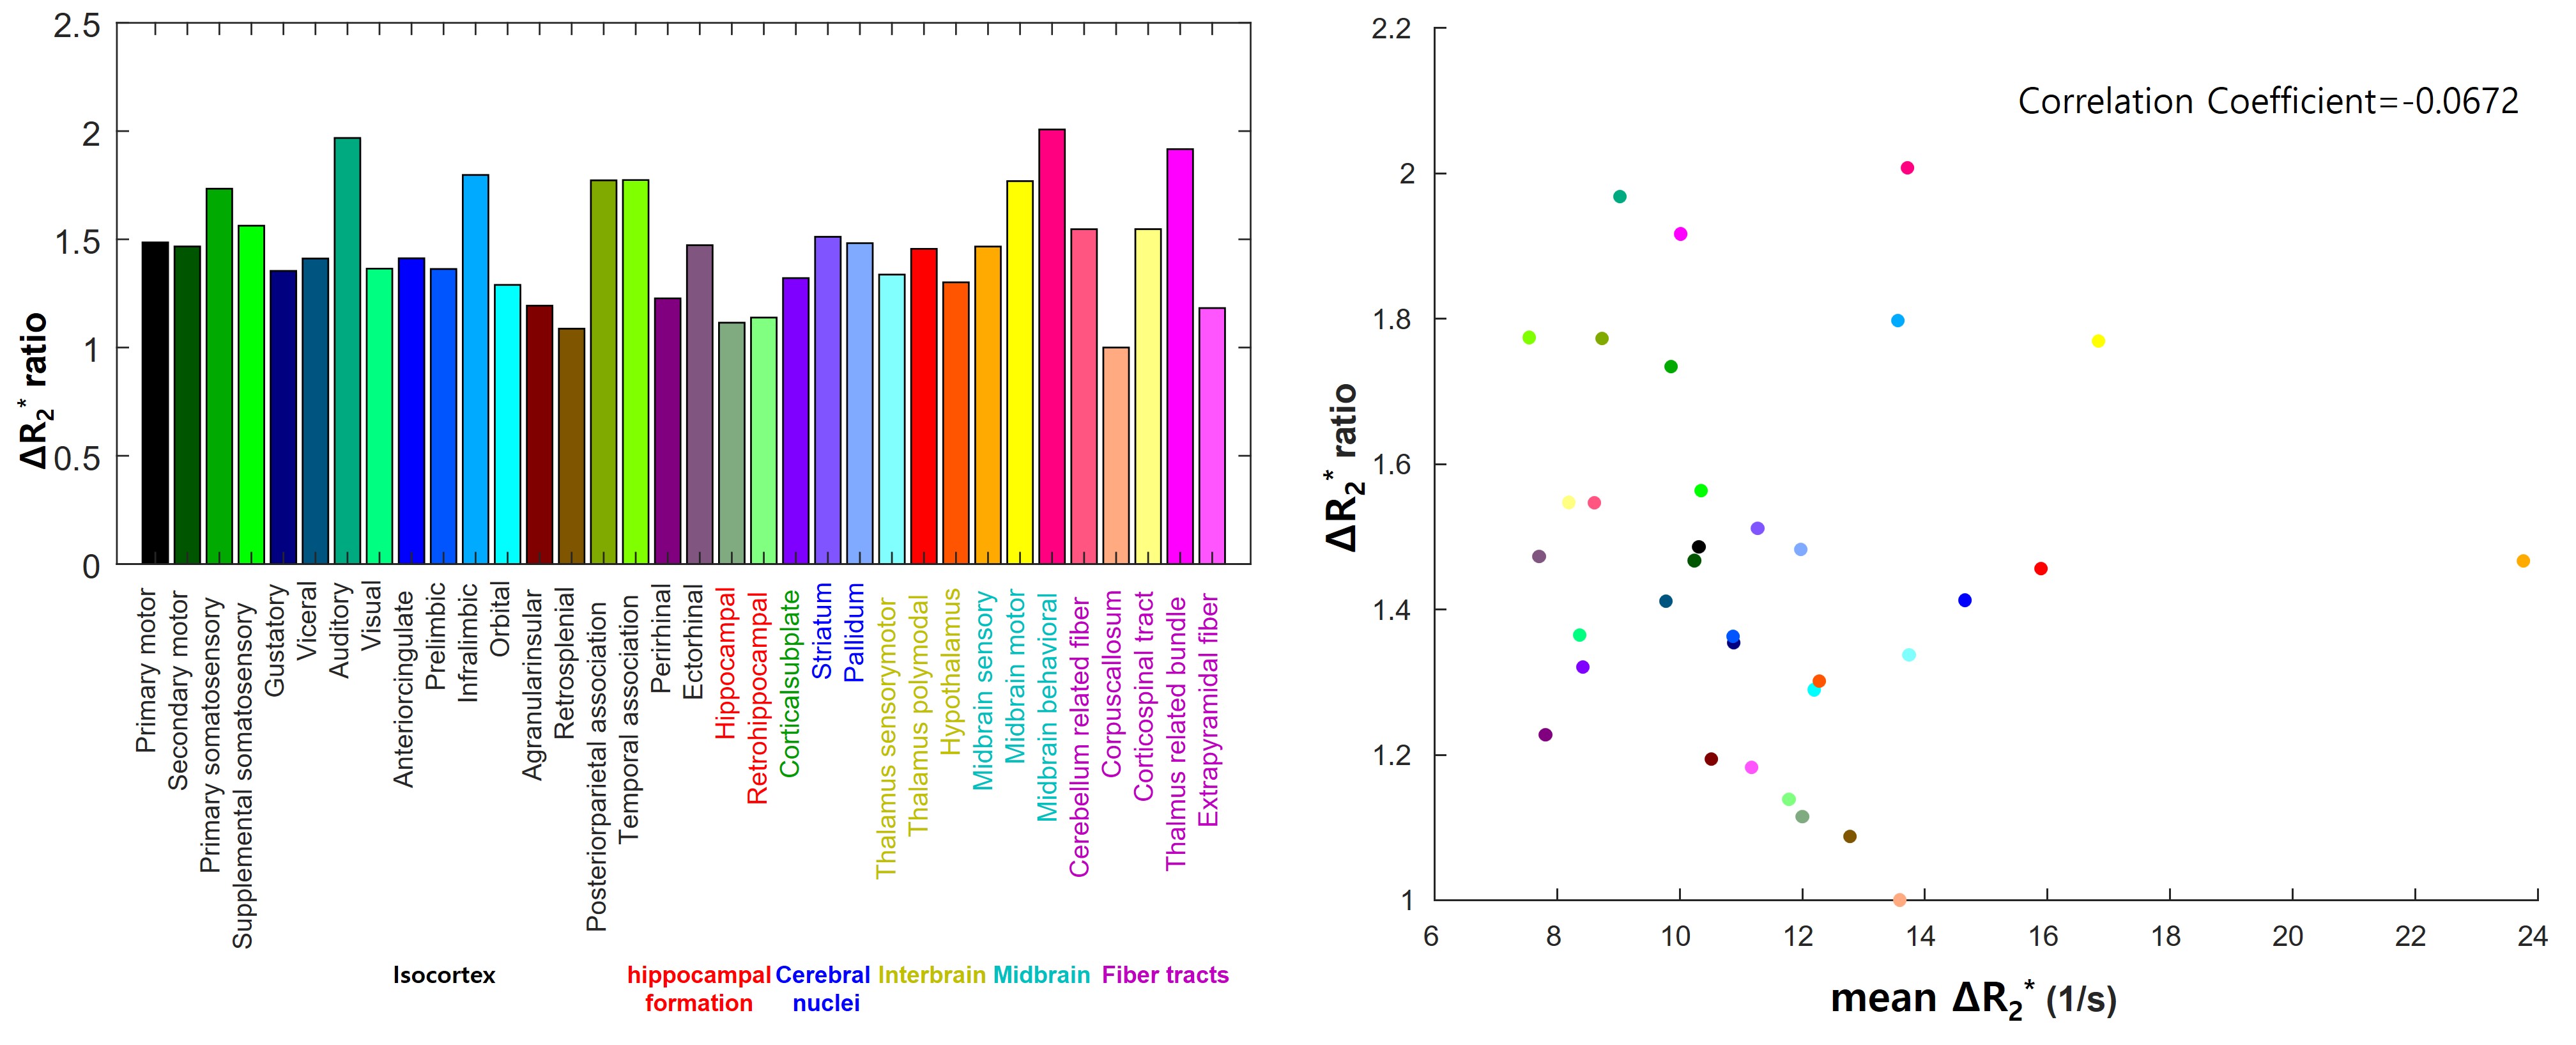
Figure 1 displays representative negative BOLD responses to two blocks of hypoxic stimulus conditions. Lower O2 stimulus conditions and higher magnetic field strength induced a more significant drop in BOLD signals (~-8% to -15%). Based on the relationship between arterial oxygen saturation change and at 9.4T4, we estimated that 0%, 5%, and 10% O2 challenges decrease arterial oxygen saturation levels to ~60%, 70%, and 80%, respectively. As expected, modulates with magnetic field strength and oxygen/nitrogen concentration, higher in vascular areas (Fig. 2). Quantitative regional peak values are presented in Fig. 3. Peak exhibited high heterogeneity across brain regions (region-wise standard deviation/mean=0.281). The midbrain region shows relatively high peak level, while the rhinal region has much lower values.To establish ratios between two fields, 15.2T data were correlated with 9.4T (Fig. 4), and average ratio of 15.2T to 9.4T was estimated by a slope (Fig. 5A). The mean ratio was 1.47, ranging from 1.00 to 2.01. This value closely aligns with the field strength ratio of 1.62 (15.2T/9.4T). For instance, the ratio of the primary somatosensory cortex at 15.2T/9.4T is 1.73, consistent with a value obtained during forepaw stimulation, 1.85. To gain insights into the heterogeneity of 15.2T/9.4T ratios, we correlated the ratios with the mean values (reflecting CBV), as shown in Fig. 5B. However, no obvious relationship was observed, indicating that baseline CBV is not related to heterogeneous ratios.
Discussion
Following hypoxic stimulus, the BOLD signals (arise from all vasculatures including arteries. The presence of large vessels adjacent to the midbrain sensory region exhibits the highest peak levels. It is important to acknowledge that our results do not match with the distribution observed during acute steady-state hypoxia as measured by Dunn et al6. This difference could be attributed to several factors, such as different species (rat vs. mouse), different hypoxic conditions (steady-state 10-30% O2 vs. 5-s 0-10% O2 concentration).Normalizing neural activity-induced BOLD responses by hypoxia-induced BOLD responses can remove sensitivity differences to neuronal activity across the entire brain both at the regional and voxel levels. The unexpected heterogeneity in the 15.2T/9.4T ratio can be explained by differences in vascular compositions (small vs. large vessels), variations in intravascular contributions at a TE of 11 ms, baseline CBV and differences in the blooming effects of large vessels.
Conclusions
We examined field-dependent regional BOLD responses to transient graded hypoxic stimuli. maps revealed heterogeneous BOLD responses, and field-dependent ratio varied slightly among regions. Hypoxia can serve as a reference for normalizing regional BOLD fMRI responses.Acknowledgements
This research was supported by the Institute of Basic Science (IBS-R015-D1).References
1. Kim, S. G. & Ogawa, S. Biophysical and physiological origins of blood oxygenation level-dependent fMRI signals. J Cereb Blood Flow Metab 32, 1188-1206 (2012). https://doi.org:10.1038/jcbfm.2012.23
2. Davis, T. L., Kwong, K. K., Weisskoff, R. M. & Rosen, B. R. Calibrated functional MRI: mapping the dynamics of oxidative metabolism. Proceedings of the National Academy of Sciences 95, 1834-1839 (1998).
3. Chiarelli, P. A., Bulte, D. P., Wise, R., Gallichan, D. & Jezzard, P. A calibration method for quantitative BOLD fMRI based on hyperoxia. Neuroimage 37, 808-820 (2007). https://doi.org:10.1016/j.neuroimage.2007.05.033
4. Lee, D., Le, T. T., Im, G. H. & Kim, S.-G. Whole-brain perfusion mapping in mice by dynamic BOLD MRI with transient hypoxia. Journal of Cerebral Blood Flow & Metabolism, 0271678X221117008 (2022).
5. Han, S., Son, J. P., Cho, H., Park, J. Y. & Kim, S. G. Gradient‐echo and spin‐echo blood oxygenation level–dependent functional MRI at ultrahigh fields of 9.4 and 15.2 Tesla. Magnetic resonance in medicine 81, 1237-1246 (2019).
6. Dunn, J., Wadghiri, Y. Z. & Meyerand, M. Regional heterogeneity in the brain's response to hypoxia measured using BOLD MR imaging. Magnetic Resonance in Medicine: An Official Journal of the International Society for Magnetic Resonance in Medicine 41, 850-854 (1999).
7. Lein, E. S. et al. Genome-wide atlas of gene expression in the adult mouse brain. Nature 445, 168-176 (2007).
Figures