2197
Quantitative Hemodynamic Measurements of the Posterior Circulation in Moyamoya Disease Patients using Arterial Spin Labeling Dynamic MRA1Institute of Science and Technology for Brain-inspired Intelligence, Fudan University, Shanghai, China, 2Laboratory of Functional MRI Technology (LOFT), Stevens Neuroimaging and Informatics Institute, University of Southern California, Los Angeles, CA, United States, 3São Carlos Institute of Physics, University of São Paulo, São Carlos, Brazil, 4Department of Radiology, Beijing Tiantan Hospital, Capital Medical University, Beijing, China, 5University of Oxford, Wellcome Centre for Integrative Neuroimaging, FMRIB Division, Nuffield Department of Clinical Neurosciences, Oxford, United Kingdom, 6Key Laboratory of Computational Neuroscience and Brain-Inspired Intelligence (Fudan University), Ministry of Education, Shanghai, China
Synopsis
Keywords: Blood Vessels, Velocity & Flow, ASL
Motivation: Hemodynamic information in the posterior circulation of Moyamoya disease (MMD) patient is crucial and may hint collateral flow.
Goal(s): To assess feasibility of hemodynamic quantification for the posterior circulation of MMD patients based on ASL dynamic MRA.
Approach: The model-free aBF quantification method based on ASL dynamic MRA, CFD simulation and 3D phase contrast (PC) were compared in the posterior circulation and the circle of Willis.
Results: As compared to CFD, aBF demonstrated better an agreement with PC results and had the potential for quantifying distal vessels. However, its accuracy may be influenced by the choice of AIF.
Impact: This study provides preliminary evidence regarding the feasibility of using ASL dynamic MRA to quantify the flow hemodynamics in Moyamoya disease patients.
Introduction
Moyamoya disease (MMD) is a rare chronic cerebrovascular disease that leads to progressive narrowing of the terminal portions of the internal carotid arteries (ICA)1. The state of the posterior circulation becomes crucial as the condition progresses and collateral circulation develops in response to stenosis or occlusion in the anterior circulation2. However, there is limited quantitative assessments of hemodynamics in the posterior circulation of MMD. Currently, challenges persist both in imaging and quantification, especially for distal peripheral vessels and collateral arteries. In this study, we evaluated the feasibility of using ASL dynamic MRA (dMRA) to quantify the flow hemodynamics3 in the posterior circulation of MMD patients, by comparing it to computational fluid dynamics (CFD) and traditional 3D phase-contrast (3D-PC) imaging.Materials and methods
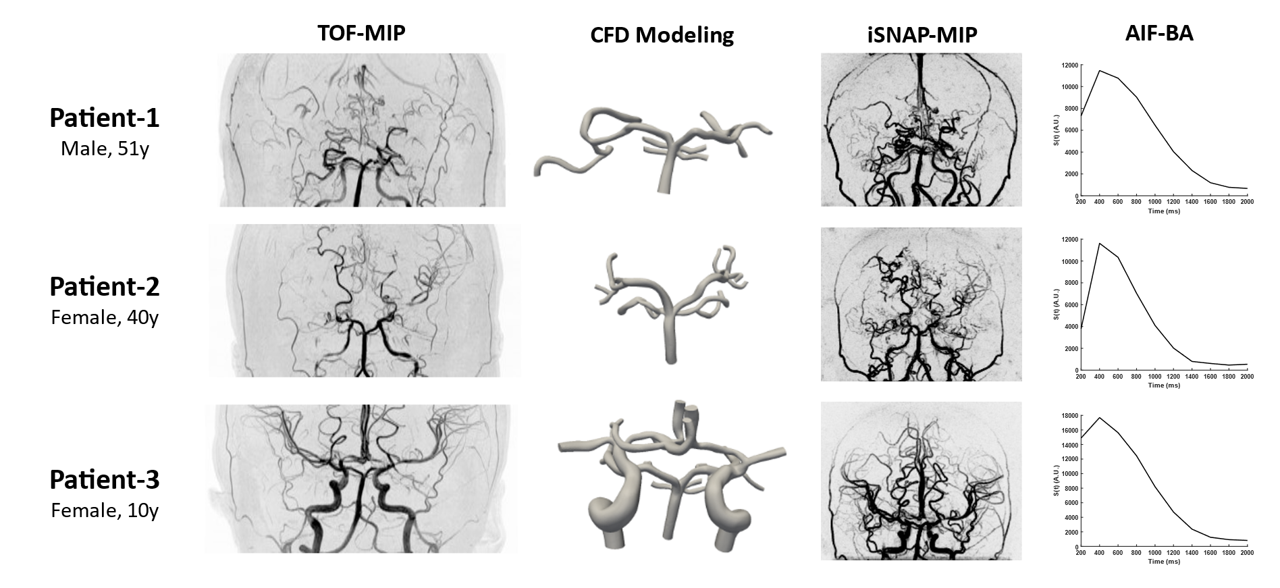
Image acquisitionWe retrospectively analyzed MRI data of three MMD patients (Figure 1). MRI scans were performed on a 3T Philips Ingenia CX scanner (Philips, Best, The Netherlands). Whole brain ASL dMRA images were acquired with a recently-proposed ASL-based sequence named iSNAP4, featuring a temporal resolution of 200 ms and 0.8 mm isotropic resolution. 3D TOF images were acquired to generate the vascular model for CFD. Retrospectively gated 2D-PC single-slice quantitative flow (Qflow) images (TR/TE = 14/9.1ms, VENC = 120cm/s) were placed perpendicular to the basilar artery (BA) to obtain the velocity at the inlet. 3D-PC Qflow images centered at the Circle of Willis (TR/TE = 11/4.8ms, VENC = 120 cm/s) were used for comparison with CFD and aBF quantification.
Hemodynamic measurements
As for CFD, we used the TOF images and 2D-PC images to respectively generate the geometry of our models and patient-specific boundary conditions with the SimVascular software pipeline5. A typical SimVascular pipeline consists of path planning, image segmentation, solid modeling, meshing, and simulation. The model-free approach previously proposed by Shao et al3 was used to perform hemodynamic quantification with ASL dMRA. Arterial input function (AIF) was generated by manually drawing ROI at BA. Arterial blood flow (aBF), arterial blood volume (aBV), mean transit time (MTT), and time-to-peak (TTP) were calculated. For patient-3, we tested the quantification results using two other different AIFs that were extracted from the left and right ICAs. We then presented the hemodynamic information of seven arterial segments, including BA and posterior cerebral artery (PCA), including BA, RPCA-P1, LPCA-P1, RPCA-P2A, LPCA-P2A, RPCA-P2P, LPCA-P2P. The radius of these segments on TOF images was measured to calculate 3D-PC flow rates.
Results
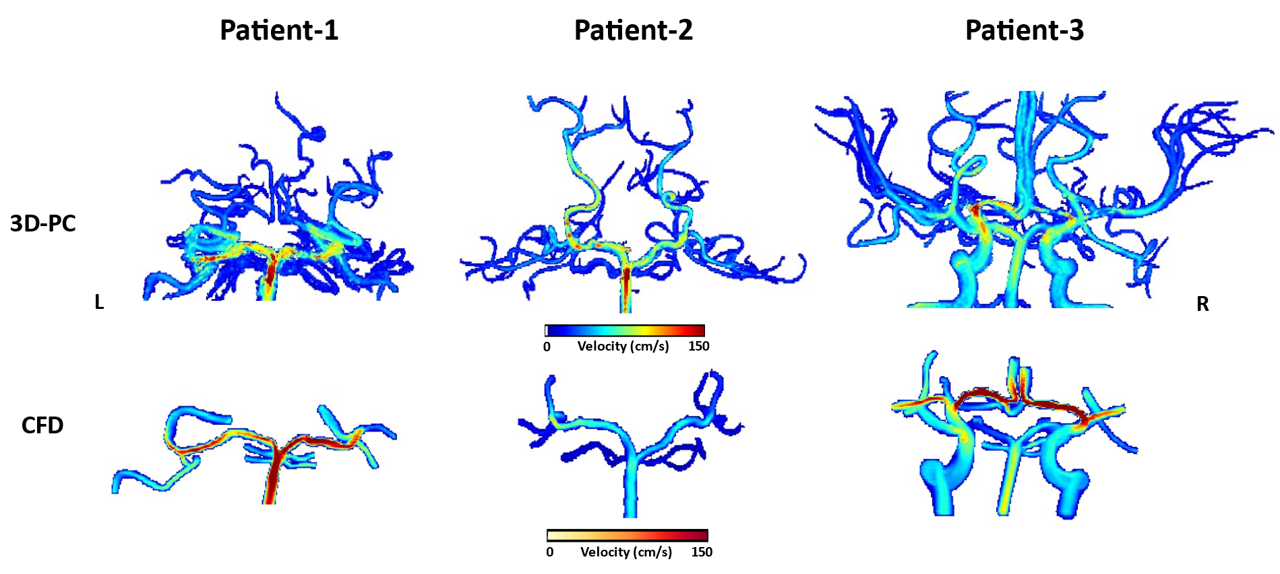
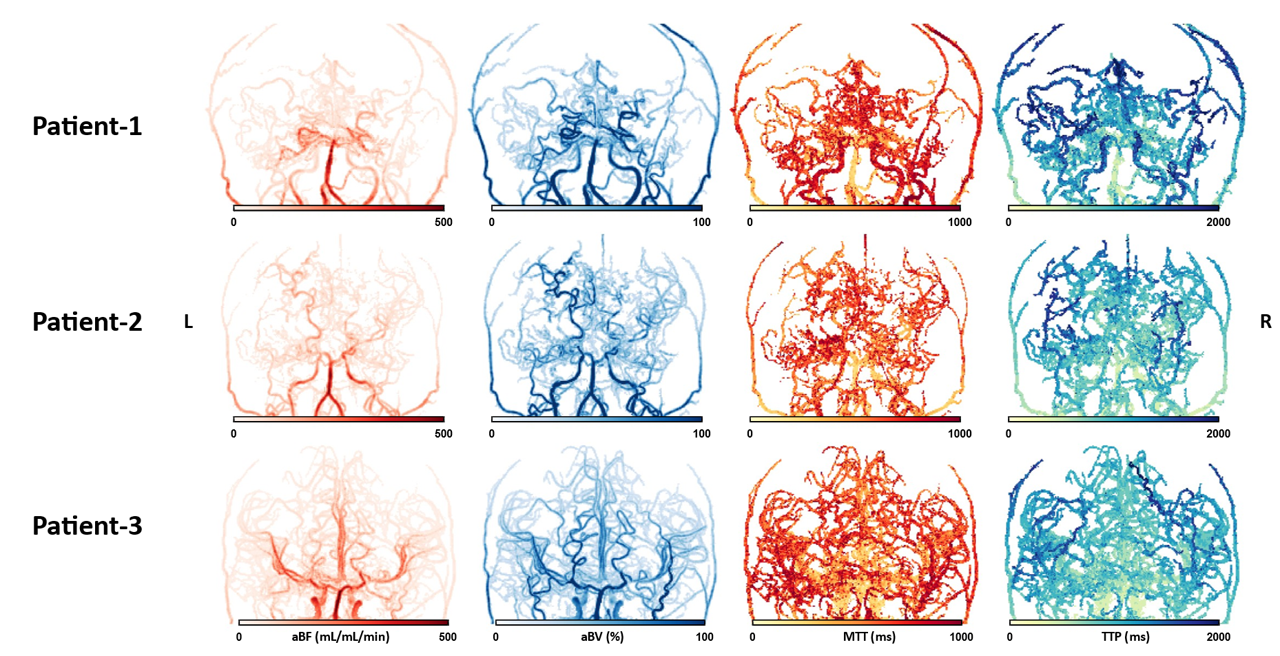
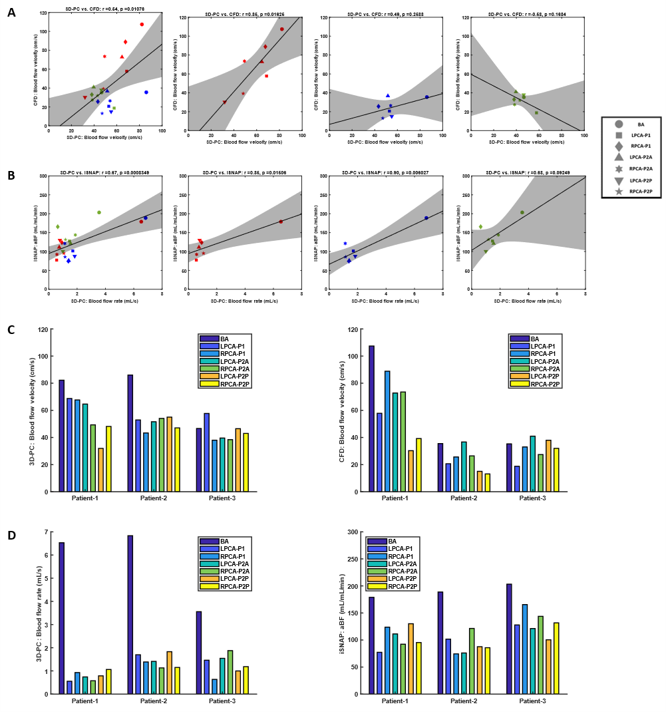
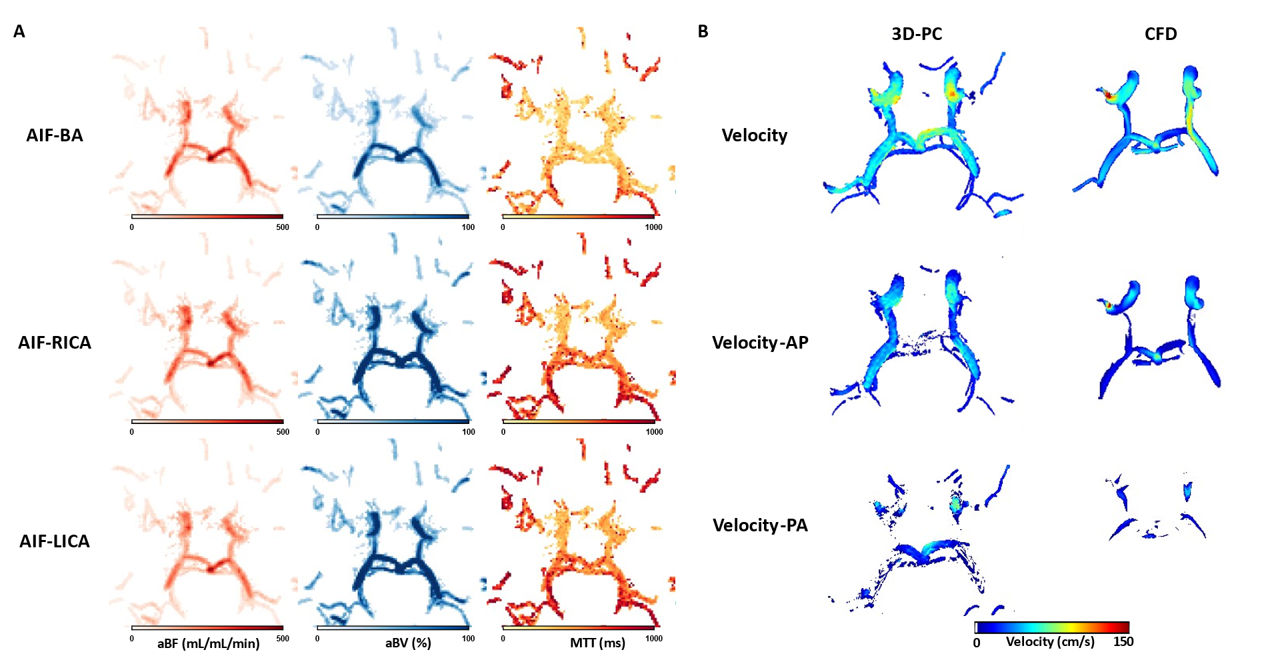
As shown in Figure 1, the first two adult MMD patients have severely degraded anterior circulation, while the pediatric patient (the third one) has a more complete vascular tree. For CFD, we only focused on simulating arteries around the circle of Willis. The simulated velocity maps were shown in Figure 2. The aBF, aBV, MTT, and TTP parameters derived from ASL dMRA were shown in Figure 3. Significant correlation (r = 0.54, p = 0.01, Figure 4A) between CFD and 3D-PC flow velocities was observed, while a stronger correlation (r = 0.67, p<0.001, Figure 4B) was observed between aBF and 3D-PC flow rates. Considering the patient individually, the correlation between aBF and flow rates remained highly significant in both patient 1 and patient 2, while patient 3 showed a marginally significant correlation. However, CFD results showed a weaker correlation on individual subjects, except for patient 1. Excluding the BA segment, there was no significant correlation between CFD and 3D-PC (r = 0.37, p = 0.11), whereas aBF remained positively correlated with flow rates (r = 0.62, p < 0.01). In Figure 5, we showed the complete flow pattern within the circle of Willis of patient 3. It was observed that when ICA was used as the AIF, the calculated aBV and MTT significantly increased (p < 0.001) in the posterior circulation, while aBF significantly decreased (p < 0.01). This trend of change was also evident in the posterior communicating arteries.Discussion and conclusions
The lack of significant correlation between aBF and flow rates in patient 3 may be attributed to the presence of blood flow between the anterior and posterior circulation via communicating arteries. Using an AIF from a single artery may inevitably cause quantification errors. Calculation of hemodynamic parameters, e.g. aBF, in the circle of Willis was accompanied with uncertainty when the flow direction was not clear. In this case, vessel-selective dynamic MRA may be a potential alternative. In conclusion, this study shows that hemodynamics quantification for the posterior circulation in MMD patients with iSNAP dMRA is feasible when dedicated hemodynamic modeling algorithm and proper AIF is used.Acknowledgements
This work was partially supported by Natural Science Foundation of Shanghai (22ZR1403900).References
1. Guey, S., Tournier-Lasserve, E., Herve, D. & Kossorotoff, M. Moyamoya disease and syndromes: from genetics to clinical management. Appl Clin Genet 8, 49-68 (2015).
2. Zhao, M., et al. Posterior circulation involvement in pediatric and adult patients with moyamoya disease: a single center experience in 574 patients. Acta Neurologica Belgica 118, 227-233 (2018).
3. Shao, X., et al. Quantification of intracranial arterial blood flow using noncontrast enhanced 4D dynamic MR angiography. Magnetic Resonance in Medicine 82, 449-459 (2019).
4. Chen, Z., et al. A novel sequence for simultaneous measurement of whole-brain static and dynamic MRA, intracranial vessel wall image, and T1-weighted structural brain MRI. Magnetic Resonance in Medicine 85, 316-325 (2021).
5. Lan, H., et al. A Re-Engineered Software Interface and Workflow for the Open-Source SimVascular Cardiovascular Modeling Package. Journal of Biomechanical Engineering 140(2018).
Figures