2186
Non-Linear Echo Combination Allows for Reduced Scan Times in T2* Weighted Imaging at 1.5T1GE Healthcare, Menlo Park, CA, United States
Synopsis
Keywords: Blood Vessels, Susceptibility, echo combination, multi-echo
Motivation: Scan times for multi-echo T2*w sequences are too long at 1.5T.
Goal(s): Shorten scan times by reducing the number of echoes needed for a specific contrast.
Approach: During this ISMRM, we introduced a novel echo combination method that increases contrast over the standard Root Sum-of-Squares (RSOS) technique. We applied this method to 7 and 6 echo 3D SPGR protocols and compared the results to a 9 echo protocol that used RSOS.
Results: Contrast was comparable or better in the 6 and 7 echo protocols using our technique, compared to the 9 echo protocol with RSOS, resulting in a scan time reduction of 23-26%.
Impact: Our echo combination technique allows fewer echoes in multi-echo T2*w imaging to match the contrast of higher echo protocols resulting in a 23-26% scan time reduction. This alleviates one of the primary concerns clinicians have using T2*w imaging at 1.5T.
Introduction
T2* weighted contrast has become a core part of brain MRI exams and is routinely used by clinicians to aid in the diagnosis of diseases such as MS1 or Alzheimer’s2, and it is a recommended part of a standard acute ischemic stroke triage protocol3. However, because T2* values in the brain are 50-80% longer at 1.5T than they are at 3T4, scan times at 1.5T can be prohibitively long to acquire sufficient contrast. This results in compromises that must be made on spatial resolution, brain coverage, or high parallel acceleration rates to bring the scan times down to clinically acceptable levels.In this work, we apply a novel echo combination method introduced at this ISMRM5 to reduce the scan time of multi-echo T2* weighted acquisitions by reducing the number of echoes needed to achieve the same level of contrast as a longer echo protocol that uses standard Root-Sum-of-Squares (RSOS) echo combination. We show that scan times can be reduced by 23-26% using this echo combination strategy without any loss in contrast or vessel conspicuity.
Methods
We scanned one healthy volunteer on a 1.5T MR450 system (GE Healthcare, Chicago, Il). Images were acquired using a fully-flow compensated 3D multi-echo SPGR sequence with unipolar echoes for 9, 7, and 6 echo protocols at different readout bandwidths (rBW). Data was acquired according to the table below:| Num Echoes | rBW (Hz/pixel) | TEs(ms) | Scan Time |
| 9 | 416 | 26,30.2,34.3,38.5,42.7,46.8,51.0,55.2,59.3 | 7:57 |
| 7 | 416 | 26,30.2,34.3,38.5,42.7,46.8,51.0 | 6:20 |
| 7 | 275 | 26,31.2,36.4,41.6,46.8,52.0,57.2 | 6:04 |
| 6 | 416 | 23.9,28.1,32.3,36.4,40.6,44.7 | 5:32 |
| 6 | 233 | 23.1,28.9,34.7,40.5,46.2,52.0 | 5:52 |
$$RSOS(echo):=\sqrt{\sum (echo_n\cdot echo_n)}\qquad\quad(1)$$
$$TE\cdot ln(echo):=exp^{\sum\big(\frac{TE_n}{\sum TE_n}\cdot ln(echo_n)\big)}\qquad\quad(2)$$
SWI images were created from these echo combined magnitude images5.
Results
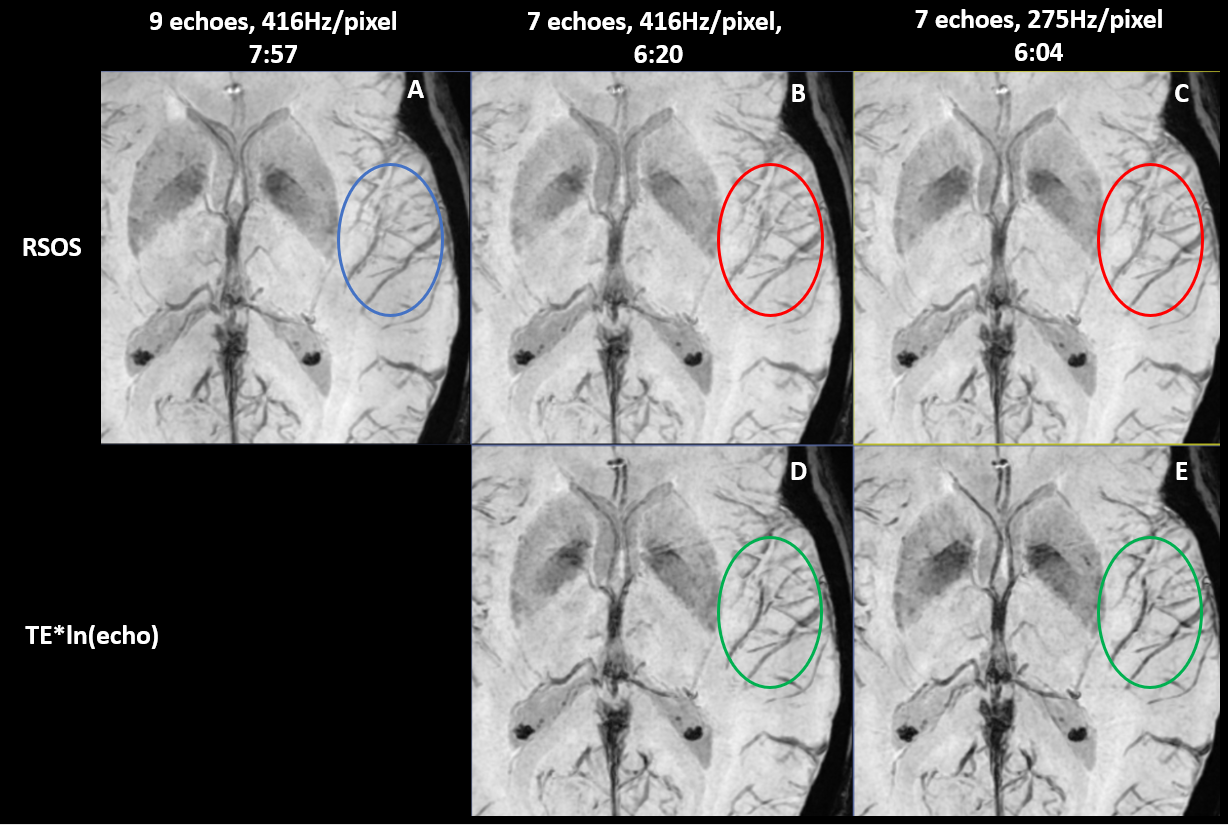
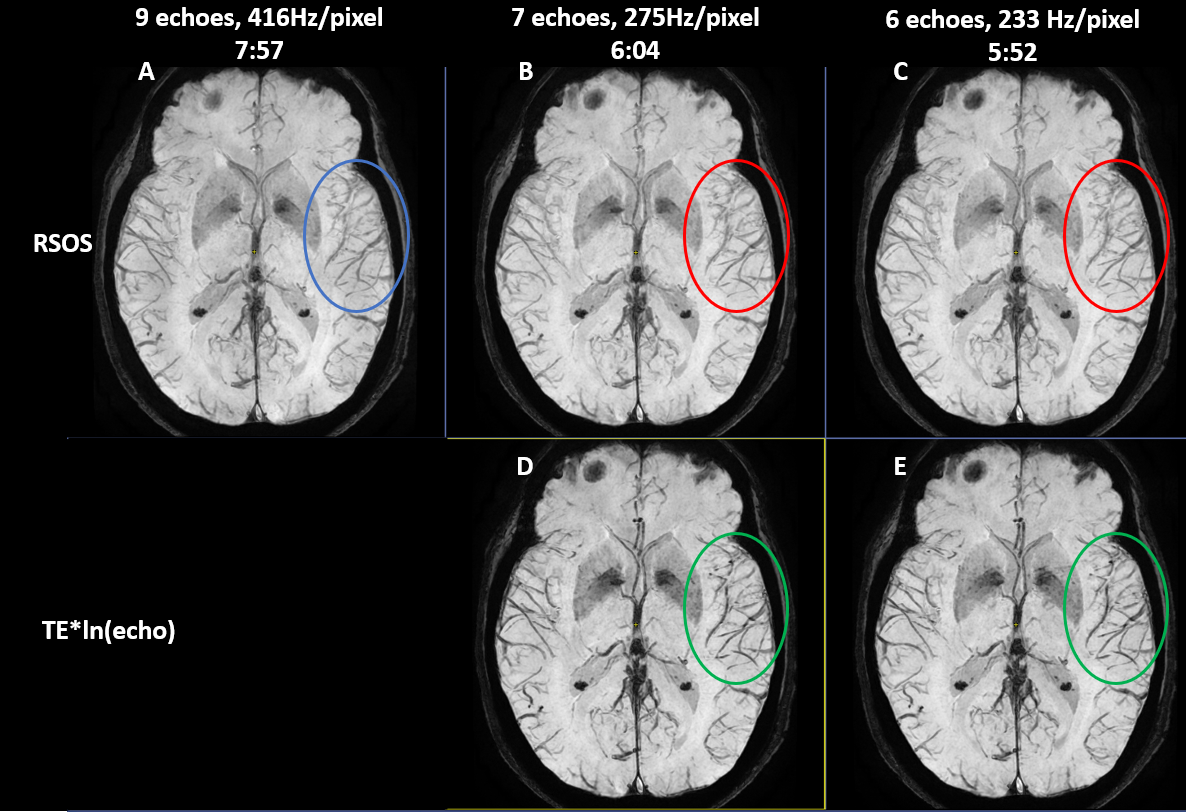
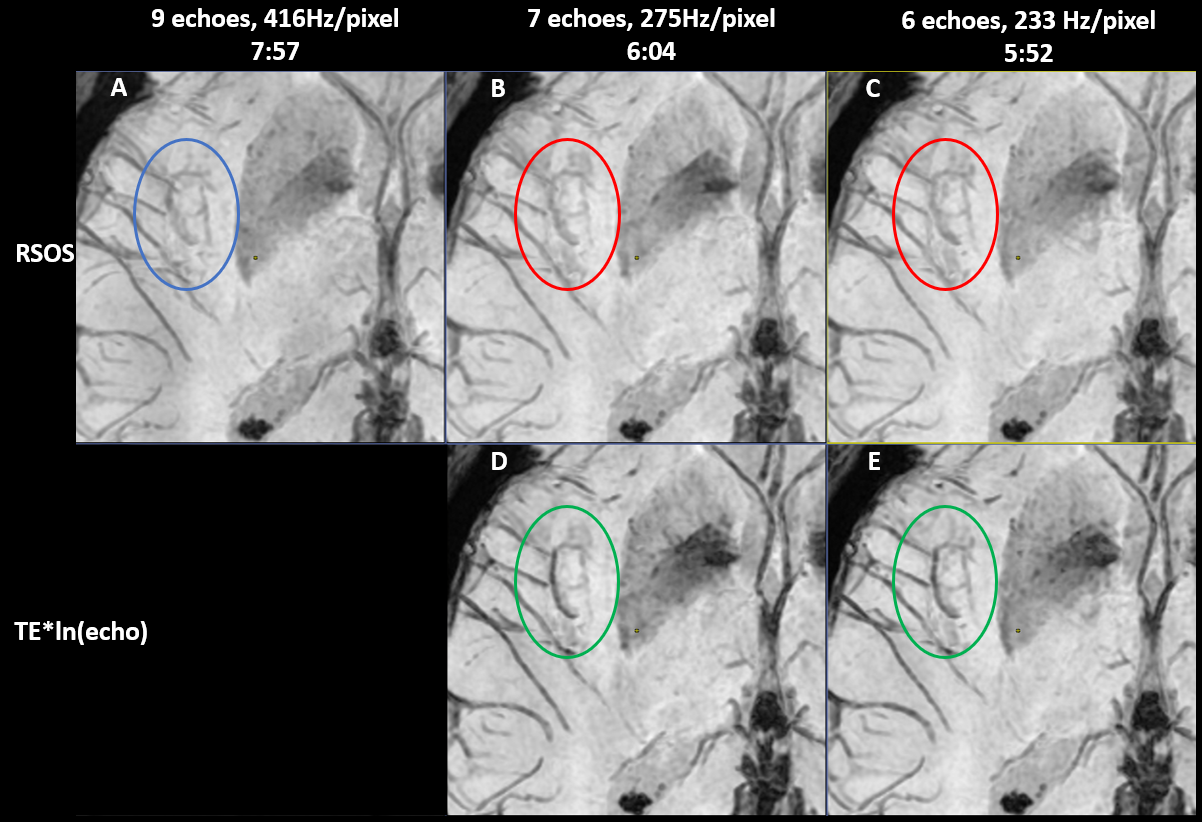
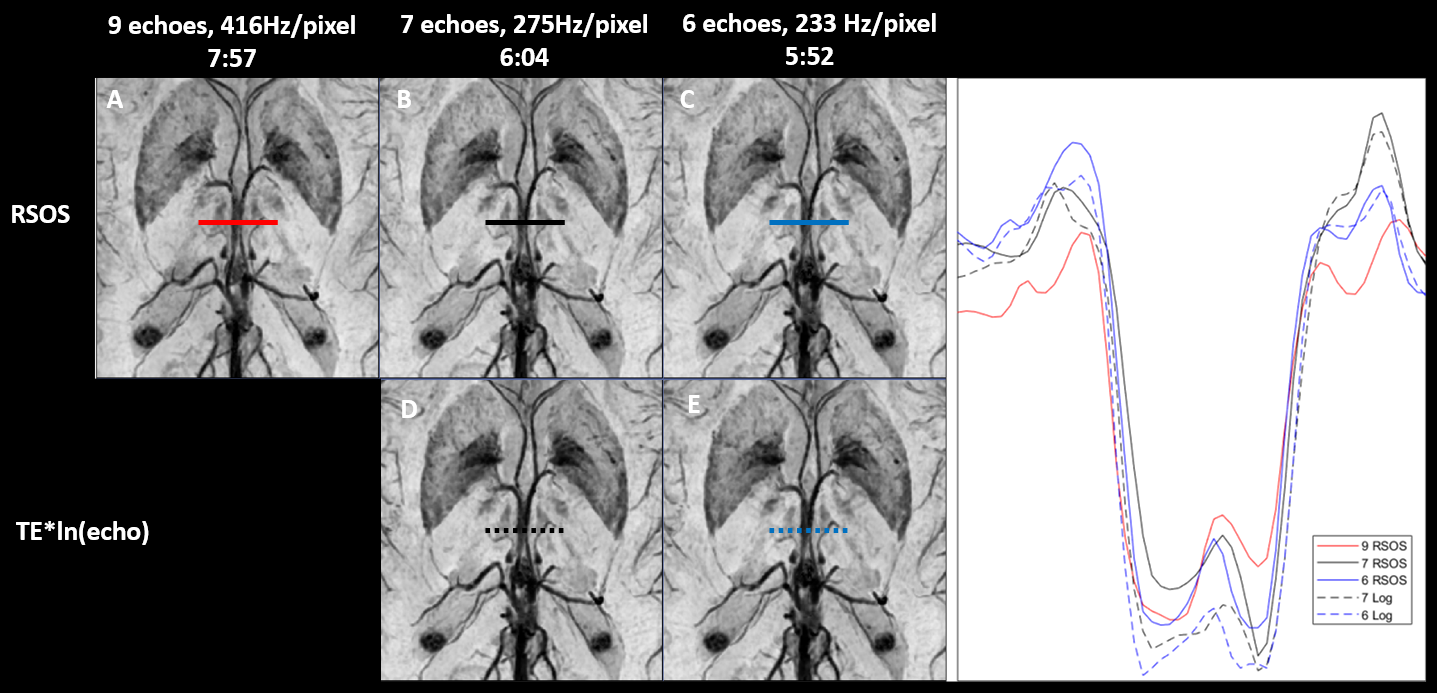
Figure 1 shows a 10mm MinIP of echo combined magnitude images using either RSOS or the proposed TE*ln(echo) combination method for the 9 and 7 echo protocols. Comparing the RSOS results for the 9 echo protocol in Fig 1A to the 7 echo protocol in Fig 1B we see that reducing the number of echoes at the same rBW results in an expected loss of contrast and small vessel conspicuity. The 7 echo protocol with reduced rBW in Fig 1C shows some of the SNR and contrast recovered, but smaller vessels are still less conspicuous than the 9 echo protocol in Fig 1A. Figs 1D and 1E show the results for the TE*ln(echo) combined 7 echo protocols. The proposed echo combination method produces more contrast with higher vessel conspicuity than RSOS even when it is applied to a higher echo protocol.Figures 2 and 3 show 10mm MinIP magnitude image comparisons between RSOS and TE*ln(echo) combined 9, 7, and 6 echo protocols, with Figure 3 showing a zoomed in view of Figure 2. As can be seen, the 7 and 6 echo protocols in Figs 2D and 2E reconstructed with TE*ln(echo) echo combination have superior vessel conspicuity and overall contrast compared to the RSOS echo combined data sets in Figs 2A, 2B, and 2C.
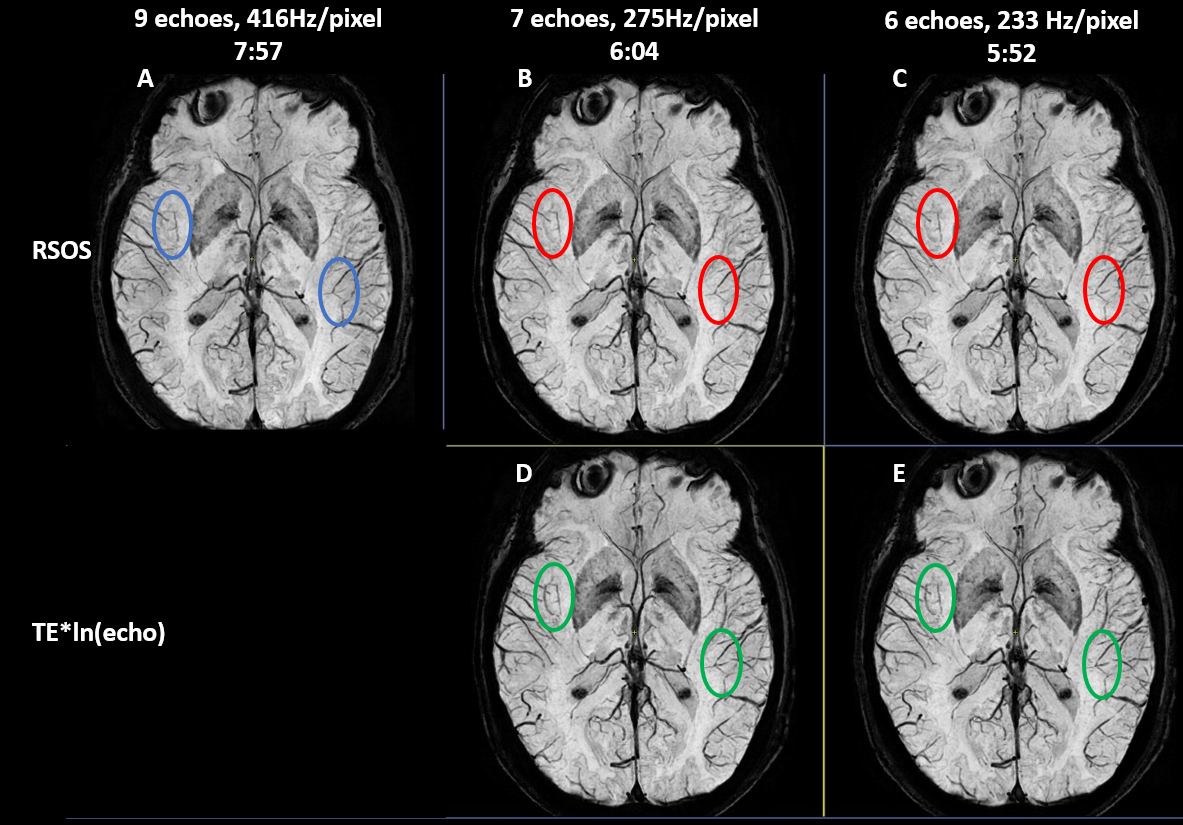
Figure 4 shows the 10 mm MinIP SWI images generated from the magnitude images in Figs 2 and 3. The contrast benefits from the TE*ln(echo) echo combination are still evident in Figs 4D and 4E, albeit not as pronounced as the magnitude image results.
Line profiles across the two internal cerebral veins in the 10mm MinIP SWI from Fig 4 are shown in Fig 5. Comparing the width and depth of the TE*ln(echo) echo combined line profiles to RSOS, we can see the depth and width are increased by ~10-15% because of the increased influence on contrast from later echoes, where increased T2* signal dephasing makes large veins wider. This change in line profile translates to blacker cerebral veins with sharper edges using our method.
Discussion/Conclusion
These results confirm that reducing the rBW and number of echoes in a 1.5T multi-echo acquisition can improve SNR and CNR. However, the contrast and vessel conspicuity will not match a higher echo protocol if RSOS echo combination is used. Our proposed echo combination method can recover, if not surpass, the contrast lost by shortening the echo train, resulting in shortened scan times at 1.5T of up to 23-26%.Acknowledgements
The author would like to thank Dr Janine Lupo and Dr Suchandrima Banerjee for their valuable feedback.References
- Sati P, et al. The central vein sign and its clinical evaluation for the diagnosis of multiple sclerosis: a consensus statement from the North American Imaging in Multiple Sclerosis Cooperative. Nat Rev Neurol. 2016;12:714-722
- Cogswell PM, et al. Amyloid-Related Imaging Abnormalities with Emerging Alzheimer Disease Therapeutics: Detection and Reporting Recommendations for Clinical Practice. AJNR. 2022; DOI: 10.3174/ajnr.A7586
- Alberts M, et al. Recommendations for Comprehensive Stroke Centers: A Consensus Statement From the Brain Attack Coalition. Stroke. 2005;36:1597–1616
- Peters A, et al. T2* measurements in human brain at 1.5, 3 and 7 T. Mag Reason Imag. 2007;25:748-753
- Burns B, Improved Susceptibility Contrast in Multi-Echo T2* Imaging Through Non-Linear Echo Combination, Proc. Intl. Soc. Mag. Reson. Med. 2024
- Haacke EM, et al. Susceptibility Weighted Imaging (SWI). Mag Reson Med. 2004;52:612–618
Figures