2183
NAD+ proton T1 and T2 relaxation measured in vivo in the human brain at 7T using single-slice spectrally-selective downfield MRS1Department of Bioengineering, University of Pennsylvania, Philadelphia, PA, United States, 2Department of Radiology, University of Pennsylvania, Philadelphia, PA, United States
Synopsis
Keywords: Relaxometry, Spectroscopy, Downfield
Motivation: NAD+ is a key metabolite in aging and disease, but its absolute in vivo tissue quantification requires correction for T1 and T2 relaxation effects.
Goal(s): Our goal was to determine T1 and T2 of NAD+ in human brain in vivo at 7T.
Approach: We utilized spectrally-selective downfield spectroscopy with slice localization.
Results: We measured an average T1 of 164.6±28.1ms and an average T2 of 33.5±10.3ms across three NAD+ downfield resonances.
Impact: Our measurements of NAD+ T1 and T2 in human brain can be used as correction factors to quantify absolute concentration of NAD+, a potential biomarker to study metabolic derangements in many diseases.
Introduction
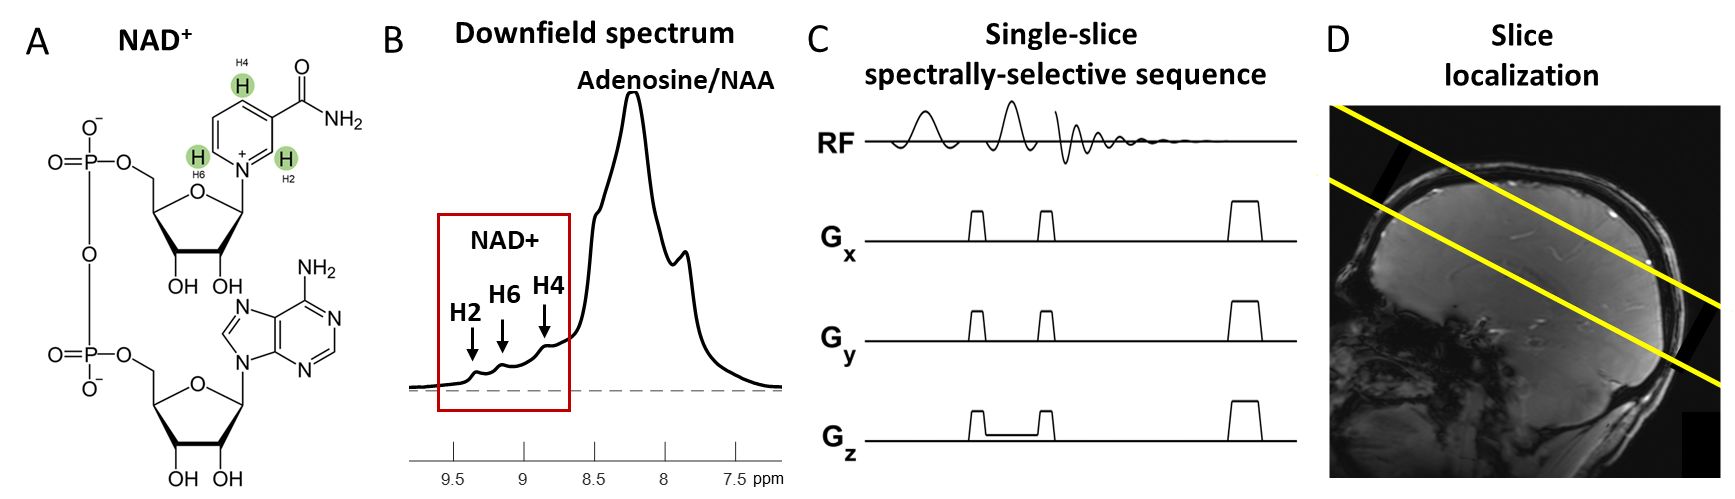
Nicotinamide adenine dinucleotide (NAD+) has gained interest in recent years as a potential biomarker and therapeutic target for disease. NAD+ is integral to many cellular mechanisms, including oxidative metabolism, DNA repair, and cell-cell communication. Its depletion is seen in multiple pathologies, including cardiovascular disease, neurodegeneration, and cancer1-3. Noninvasive detection of downfield (>4.7ppm) NAD+ resonances using 1H magnetic resonance spectroscopy is challenged by low concentration (< 1mM), short T2 relaxation time, and cross-relaxation with water4-6. Additionally, accurate quantification of NAD+ concentration requires correction for T1 and T2 relaxation effects. In this study, we use a single-slice spectrally-selective sequence with a minimum echo time of 13ms to measure T1 and T2 relaxation times of NAD+ proton resonances in the downfield 1H MRS spectrum in human brain at 7 T in vivo.Methods
Healthy human volunteers were scanned at 7T (MAGNETOM Terra, Siemens Healthcare, Erlangen, Germany) using a 32-channel RF head coil (Nova Medical, Wilmington, MA, USA) in accordance with local IRB protocols. Downfield spectra were acquired at multiple echo times in all subjects to measure T2 relaxation, and saturation recovery data were acquired in a subset of participants to measure T1 relaxation. The NAD+ resonances of interest arise from the H2, H6, and H4 protons of nicotinamide moiety at 9.3, 9.1, and 8.9ppm, respectively. The downfield acquisition used a spectrally-selective 90° sinc pulse for excitation centered at 9.1ppm with a bandwidth of 2ppm, followed by a 180° spatially-selective Shinnar-Le Roux refocusing pulse for localization. For all scans, the slice was axial and obliqued to avoid the frontal sinus with a thickness of 40mm (Fig. 1). For the multiple echo experiment, spectra were collected with echo times ranging from 13 to 33ms; TR=1000ms; and 128 averages. For the saturation recovery experiment, saturation was performed prior to excitation using the same spectrally-selective sinc pulse as was used for excitation. Saturation delay times (TS) ranged from 100 to 600ms and TR/TE=2500/13ms. An additional dataset without saturation but with the same TR/TE was acquired to measure the equilibrium magnetization. The TS=100, 200ms datasets were acquired with 256 averages; all others were acquired with 128 averages. In all scan sessions, a water reference spectrum was also acquired with excitation centered at 4.7 ppm, TR/TE=1000/13ms, averages=16.Coil combination was done offline following a channel-wise frequency shift correction. All spectra were 5Hz line broadened and fit using Hankel singular value decomposition7,8. Amplitudes of the NAD+ resonances acquired at multiple echo times were corrected for effects of J-modulation9. The corrected amplitudes were fit to a two-parameter exponential decay model to measure T2 relaxation time: S(t)=M0*exp(-TE/T2). For the saturation recovery experiment, the dataset without saturation was assigned to a saturation recovery time of 5s when fitting a two-parameter model for the measurement of T1 relaxation time: S(t)=M0*(1-exp(TS/T1)).
Results
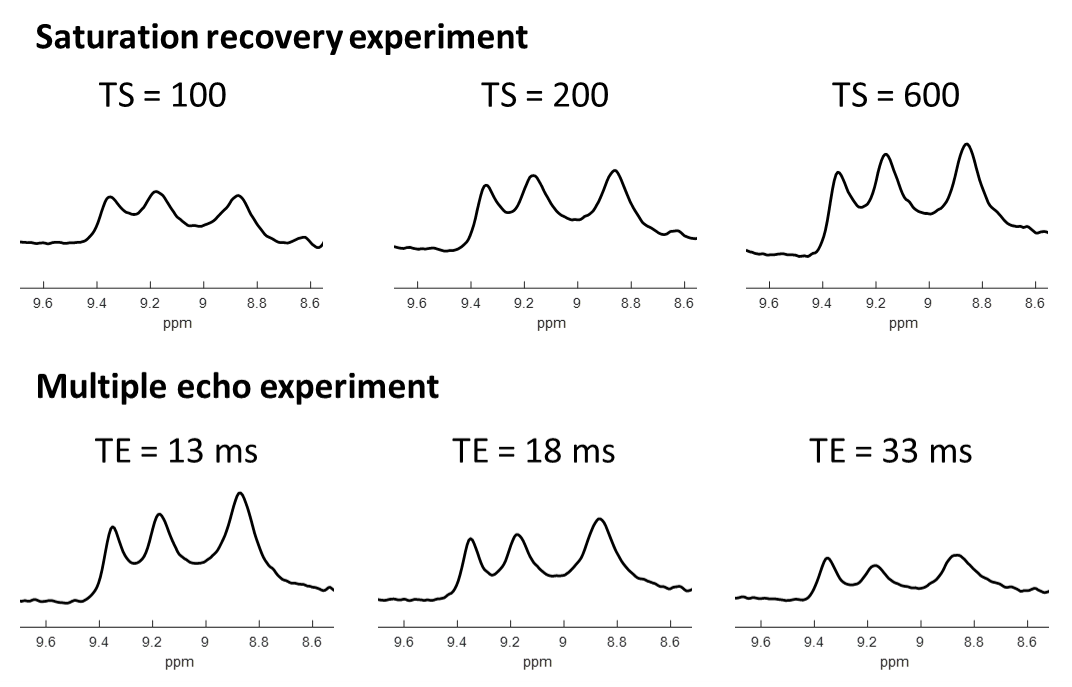
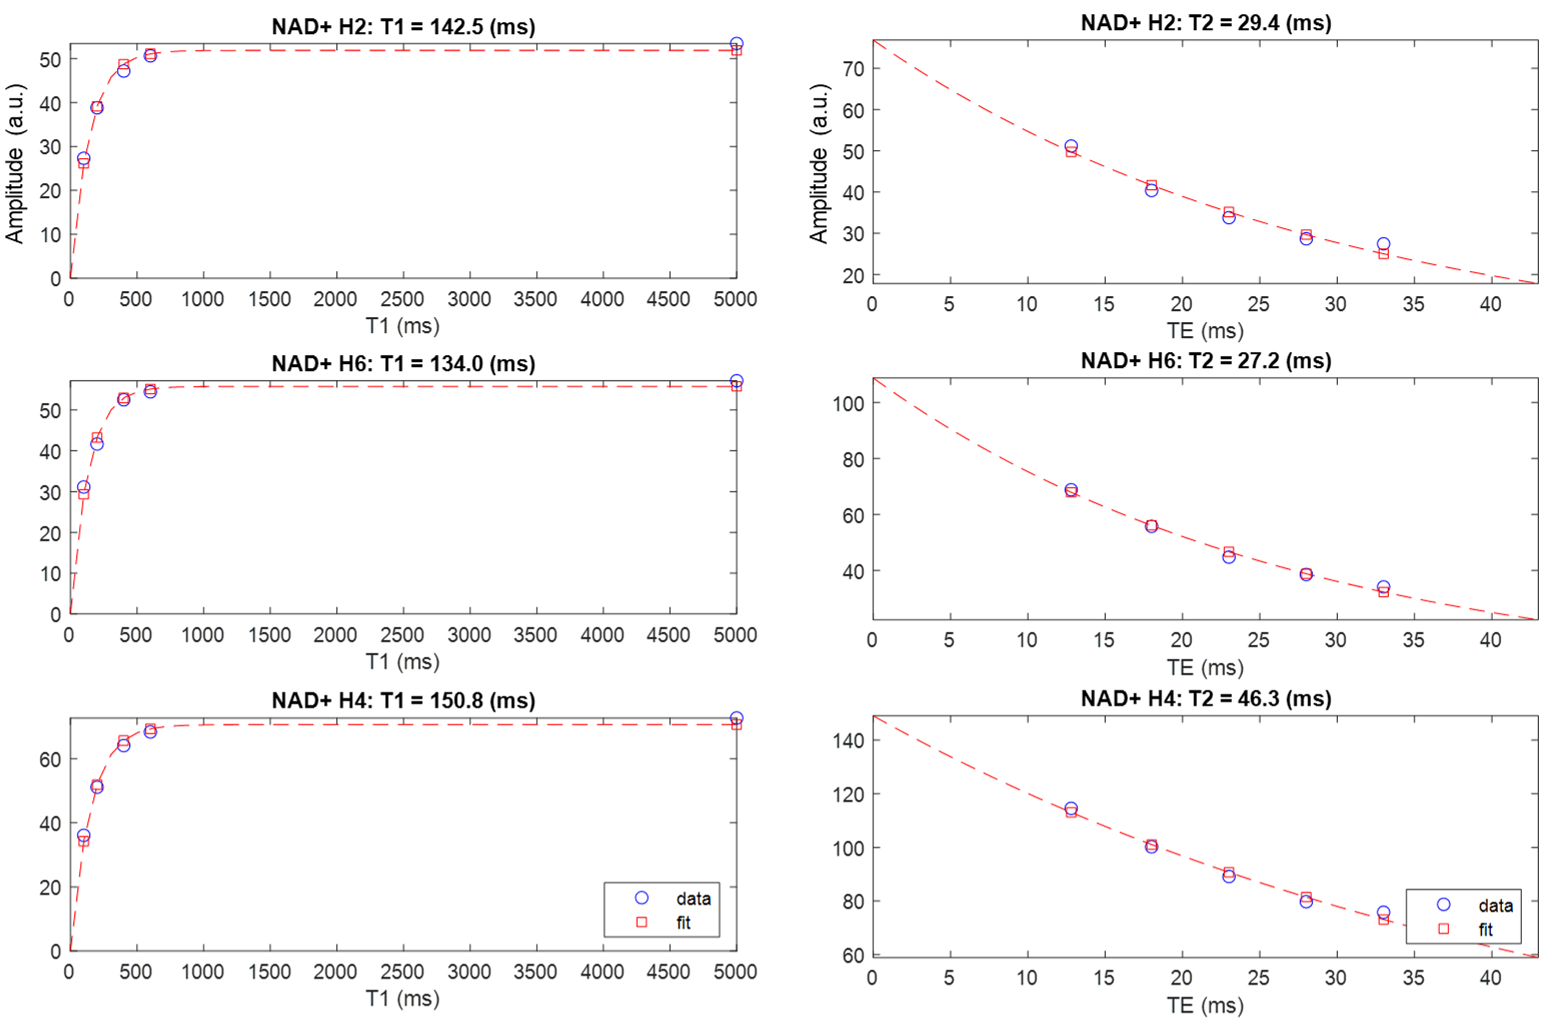
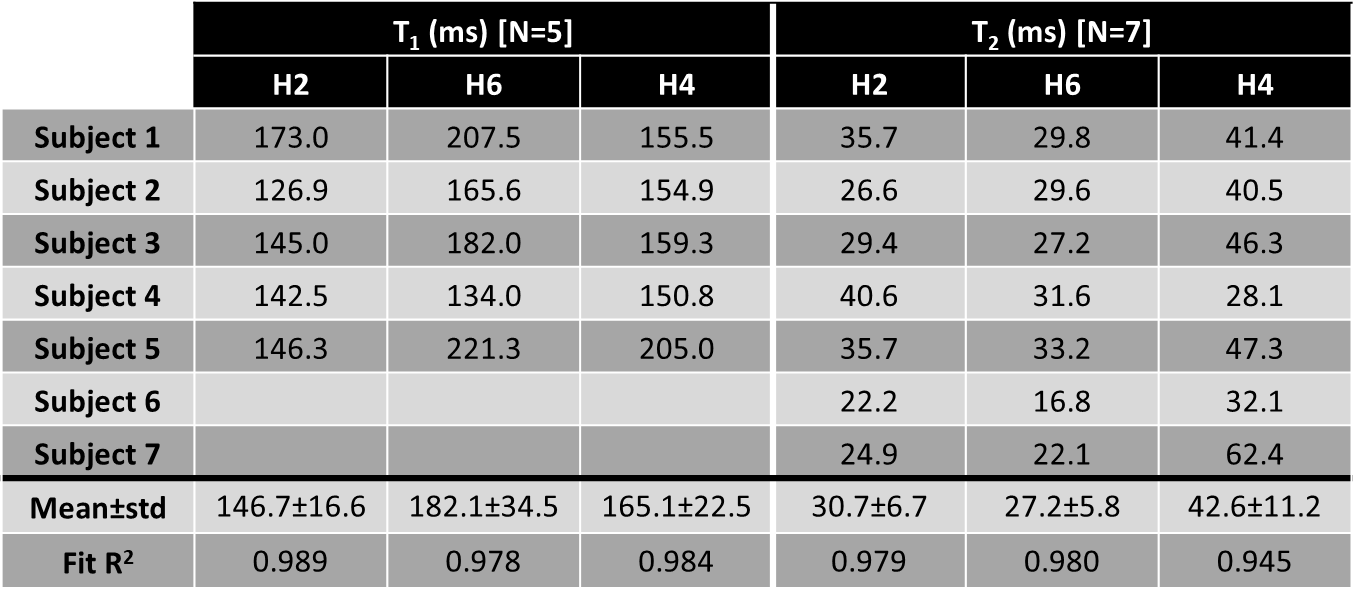
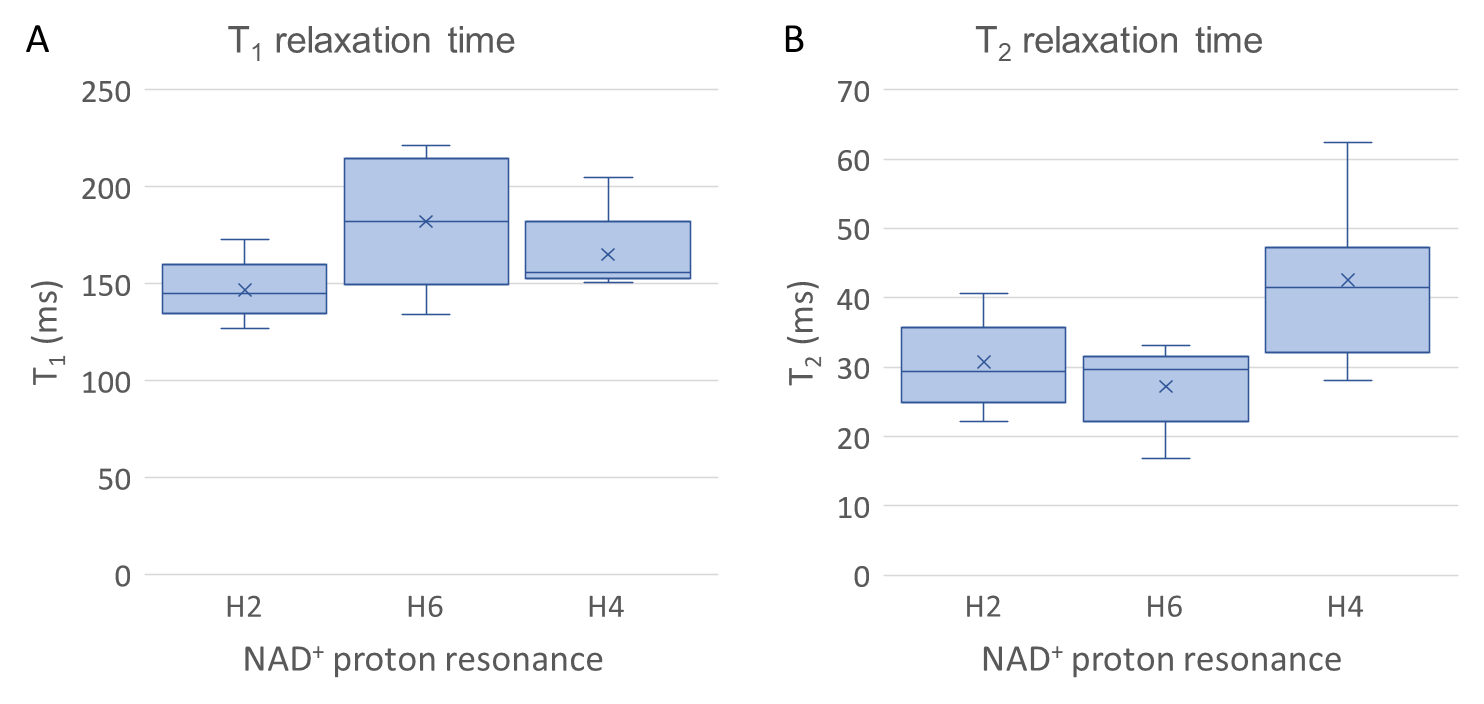
Representative downfield spectra of NAD+ acquired at increasing saturation delay times and increasing echo times are shown in Figure 2. T1 recovery and T2 decay fits are shown from a single subject in Figure 3. The mean R2 of all T1 fits were greater than 0.97. The mean R2 of the T2 fits of the H2 and H4 proton resonances were also greater than 0.97, while the mean R2 of the T2 fits of the H4 proton was above 0.94 (Table 1). The mean±standard deviation of T1 relaxation times of the H2, H6, and H4 protons were 146.7±16.6, 182.1±34.5, and 165.1±22.5ms, respectively (Fig. 4A). The mean±standard deviation of T2 relaxation times of the H2, H6, and H4 protons were 30.7±6.7, 27.2±5.8, and 42.6±11.2ms, respectively (Fig. 4B).Discussion
The T1 and T2 relaxation times of NAD+ resonances were measured at 7T using a spectrally-selective downfield spectroscopy sequence. In general, the H2 and H6 protons resulted in fits with higher R2 values, while the H2 proton showed low variance in measured T1 and T2 relaxation times between subjects. The longer measured T2 relaxation time and less reliable fits of the H4 proton are likely due to the fact that the H4 peak overlaps with the NAA/adenosine complex upfield of NAD+. Compared to T1 and T2 measured in rat brain in situ at 11.7T, the T1 relaxation times in this study were shorter (147-180ms vs 207-333ms), as were the T2 times (31-43ms vs 51-75ms)9.Conclusion
Accurate measurements of T1 and T2 relaxation times are integral for absolute quantification of NAD+ as a noninvasive biomarker. Using downfield spectrally-selective spectroscopy with single-slice localization, we measured NAD+ T1 and T2 relaxation times of ~165ms and ~34ms respectively in the human brain in vivo at 7T.Acknowledgements
Research reported in this publication was supported by the National Institute of Biomedical Imaging and Bioengineering of the National Institutes of Health under award Number P41EB029460, and by the National Heart, Lung, and Blood Institute of the National Institutes of Health under award Numbers R01HL137984, R01HL169378 and F31HL158217.
References
1. Imai S, Guarente L. NAD+ and sirtuins in aging and disease. Trends Cell Biol 2014;24(8):464-471.
2. Garrido A, Djouder N. NAD+ Deficits in Age-Related Diseases and Cancer. Trends Cancer 2017;3(8):593-610.
3. Kane AE, Sinclair DA. Sirtuins and NAD+ in the development and treatment of metabolic and cardiovascular diseases. Circulation research 2018;123(7):868-885.
4. de Graaf RA, De Feyter HM, Brown PB, Nixon TW, Rothman DL, Behar KL. Detection of cerebral NAD(+) in humans at 7T. Magn Reson Med 2017;78(3):828-835.
5. Bagga P, Hariharan H, Wilson NE, Beer JC, Shinohara RT, Elliott MA, Baur JA, Marincola FM, Witschey WR, Haris M. Single‐Voxel 1H MR spectroscopy of cerebral nicotinamide adenine dinucleotide (NAD+) in humans at 7T using a 32‐channel volume coil. Magnetic Resonance in Medicine 2020;83(3):806-814.
6. Shemesh N, Dumez JN, Frydman L. Longitudinal relaxation enhancement in 1H NMR spectroscopy of tissue metabolites via spectrally selective excitation. Chemistry 2013;19(39):13002-13008.
7. Barkhuijsen H, De Beer R, Van Ormondt D. Improved algorithm for noniterative time-domain model fitting to exponentially damped magnetic resonance signals. Journal of Magnetic Resonance (1969) 1987;73(3):553-557.
8. Swago S, Elliott MA, Nanga RPR, Wilson NE, Cember A, Reddy R, Witschey WR. Quantification of cross‐relaxation in downfield 1H MRS at 7 T in human calf muscle. Magnetic Resonance in Medicine 2023.
9. de Graaf RA, Behar KL. Detection of cerebral NAD(+) by in vivo (1)H NMR spectroscopy. NMR Biomed 2014;27(7):802-809.
Figures