2182
T2* relaxometry in the human cervical spinal cord at 7T1Department of Physics, Norwegian University of Science and Technology, Trondhiem, Norway
Synopsis
Keywords: Relaxometry, Spinal Cord
Motivation: In spinal cord T2* relaxometry, only mono-exponential models have previously been used, neglecting the potential presence of multiple compartments.
Goal(s): Determine if a mono- or bi-exponential model is better for T2* relaxometry in the cervical spinal cord white matter (WM) and grey matter (GM).
Approach: Mask the ventral half of the GM and WM in a 7-echoes GRE acquisition. Fit a mono-/bi-exponential model to the average signal in the masks for each slice. Compute R2, F-tests and p-values.
Results: A bi-exponential model gave statistically better results in WM. No relevant difference between the models was measured in GM for most slices.
Impact: A bi-exponential model is statistically better than a mono-exponential one for T2* relaxometry in spinal cord white matter, but not grey matter. The model can be used for contrast optimization, e.g. to improve lesion detection in demyelinating diseases.
Introduction
Relaxation times play a central role in MRI as they determine image contrast to a large degree. Relaxometry, has been proposed as a way of obtaining reproducible relaxation times measurements that quantitatively reflect underlying tissue changes.In the spinal cord, T2*-weighted multi-echo GRE images show excellent contrast between grey matter (GM) and white matter (WM), being also sensitive to spinal cord lesions, e.g. in multiple sclerosis1. T2* relaxometry in the spinal cord has been previously performed, always assuming a mono-exponential signal decay2,3,4. In brain imaging, it is known that the presence of myelin in WM creates multiple water compartments, giving multi-exponential signal decay.
In this study we aim to investigate whether a mono or bi-exponential model is more suitable for T2* relaxometry of GM and WM in the spinal cord.
Methods
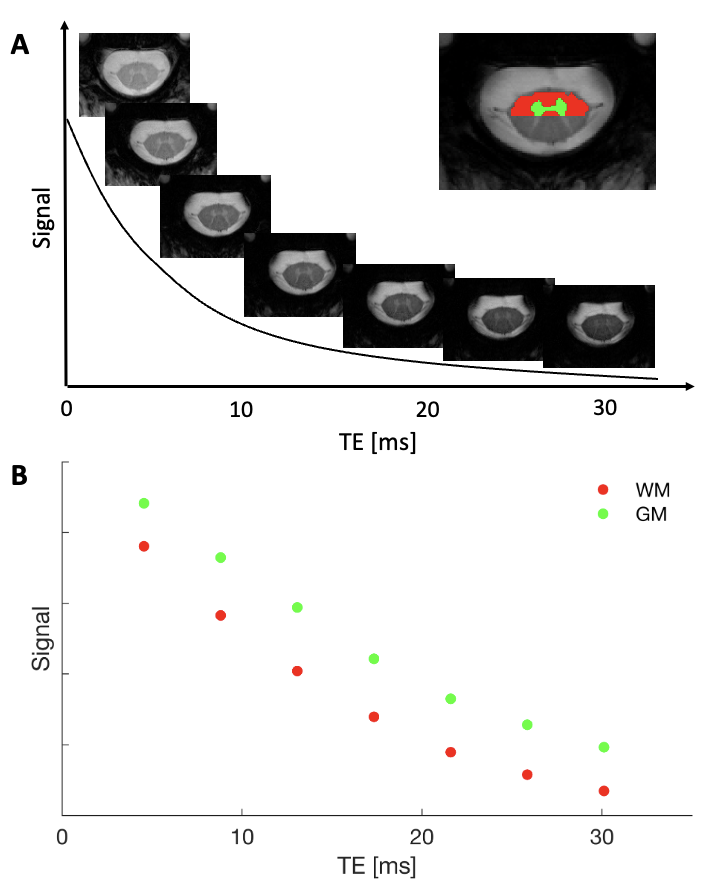
Two healthy volunteers were scanned on a 7T Siemens Terra system using a 24Rx cervical spine coil (MRI.TOOLS GmbH). A 2D multi-echo GRE was acquired with the following parameters: 3mm slice thickness, FOV=128x128mm2, res=0.256x0.256mm2, 7 echoes, TE=4.55/8.81/13.07/17.33/21.59/25.85/30.11ms, TR=415ms, flip angle=39°, 2 repetitions. A navigator5 echo was recorded in the k-space centre for each TR. 5 slabs consisting of 2 axial-oblique slices (no gap) were centred in the spinal canal mid-vertebra (C2 to C6 for subj. 1 and C1 to C5 for subj. 2) and angulated perpendicularly to the cord. A navigator-based correction was applied to demodulate the breathing-induced field variations (FFT-nav algorithm from MRINavigator.jl6). The images were then reconstructed6,7 offline using a SENSE8,9 algorithm (10 iterations) and the repetitions were averaged.WM and GM were segmented using Spinal Cord Toolbox10 on an image obtained combining the first five echoes. One pixel erosion was applied to the external outline of the WM mask to address partial volume effects. The ventral half of the spinal cord was selected, to exclude voxels strongly affected by dephasing due to B0 field inhomogeneity. The signal (S) from all voxels inside the masks was averaged for each slice (Fig. 1). Mono exponential and bi exponential fits where then applied to WM and GM in every slice:
$$$S=ae^{-TE/T_{2}^*}\,, \qquad S=a_{1}e^{-TE/T_{2}^{*}}+a_{2}e^{-TE/T_{2}^{*}\text{'}}\,.$$$
The goodness of the fits was evaluated by R2. WM and GM voxels in all slices with R2>0.98 (upper 5 slices subj.1, all slices subj.2) were then averaged, and fitted. An F-test was conducted to determine the most suited model.
Results
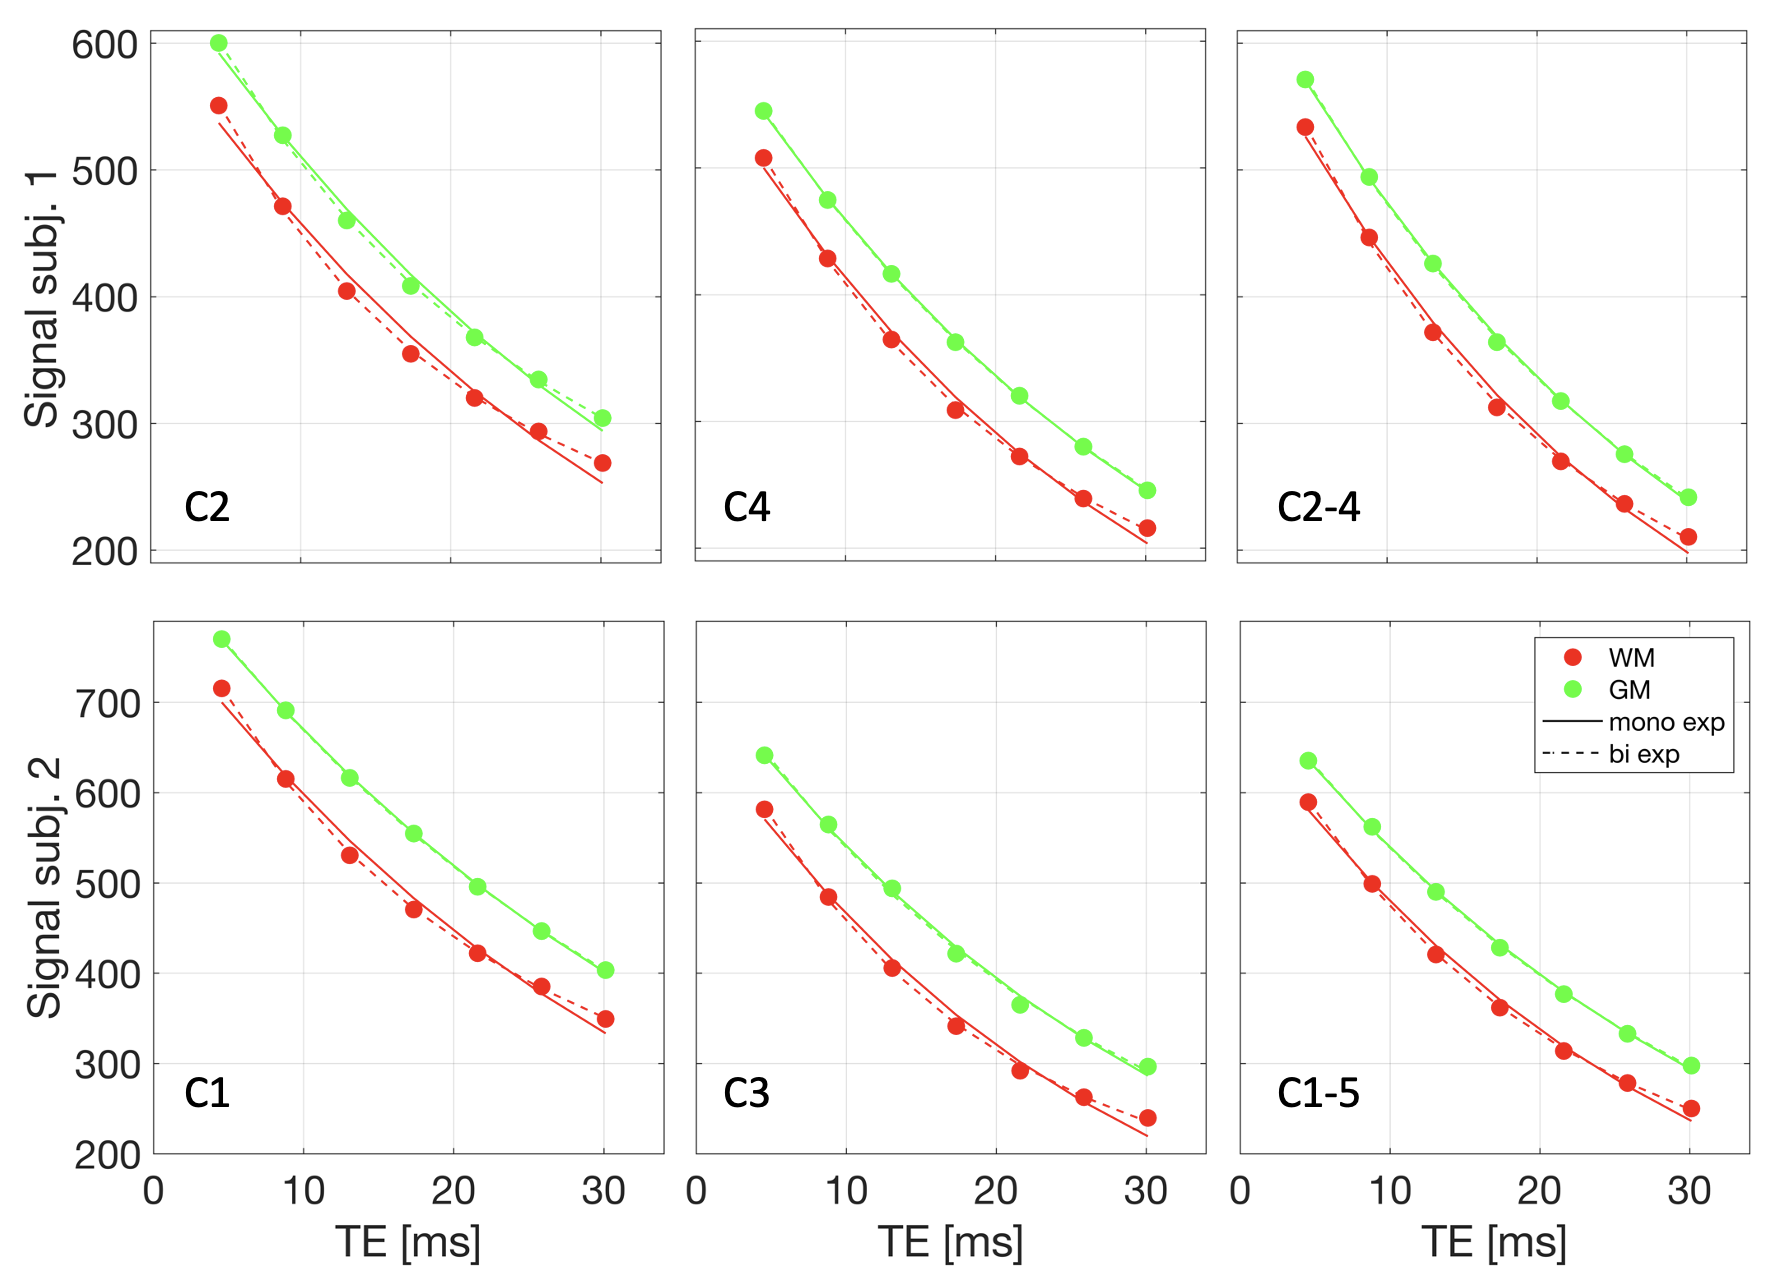
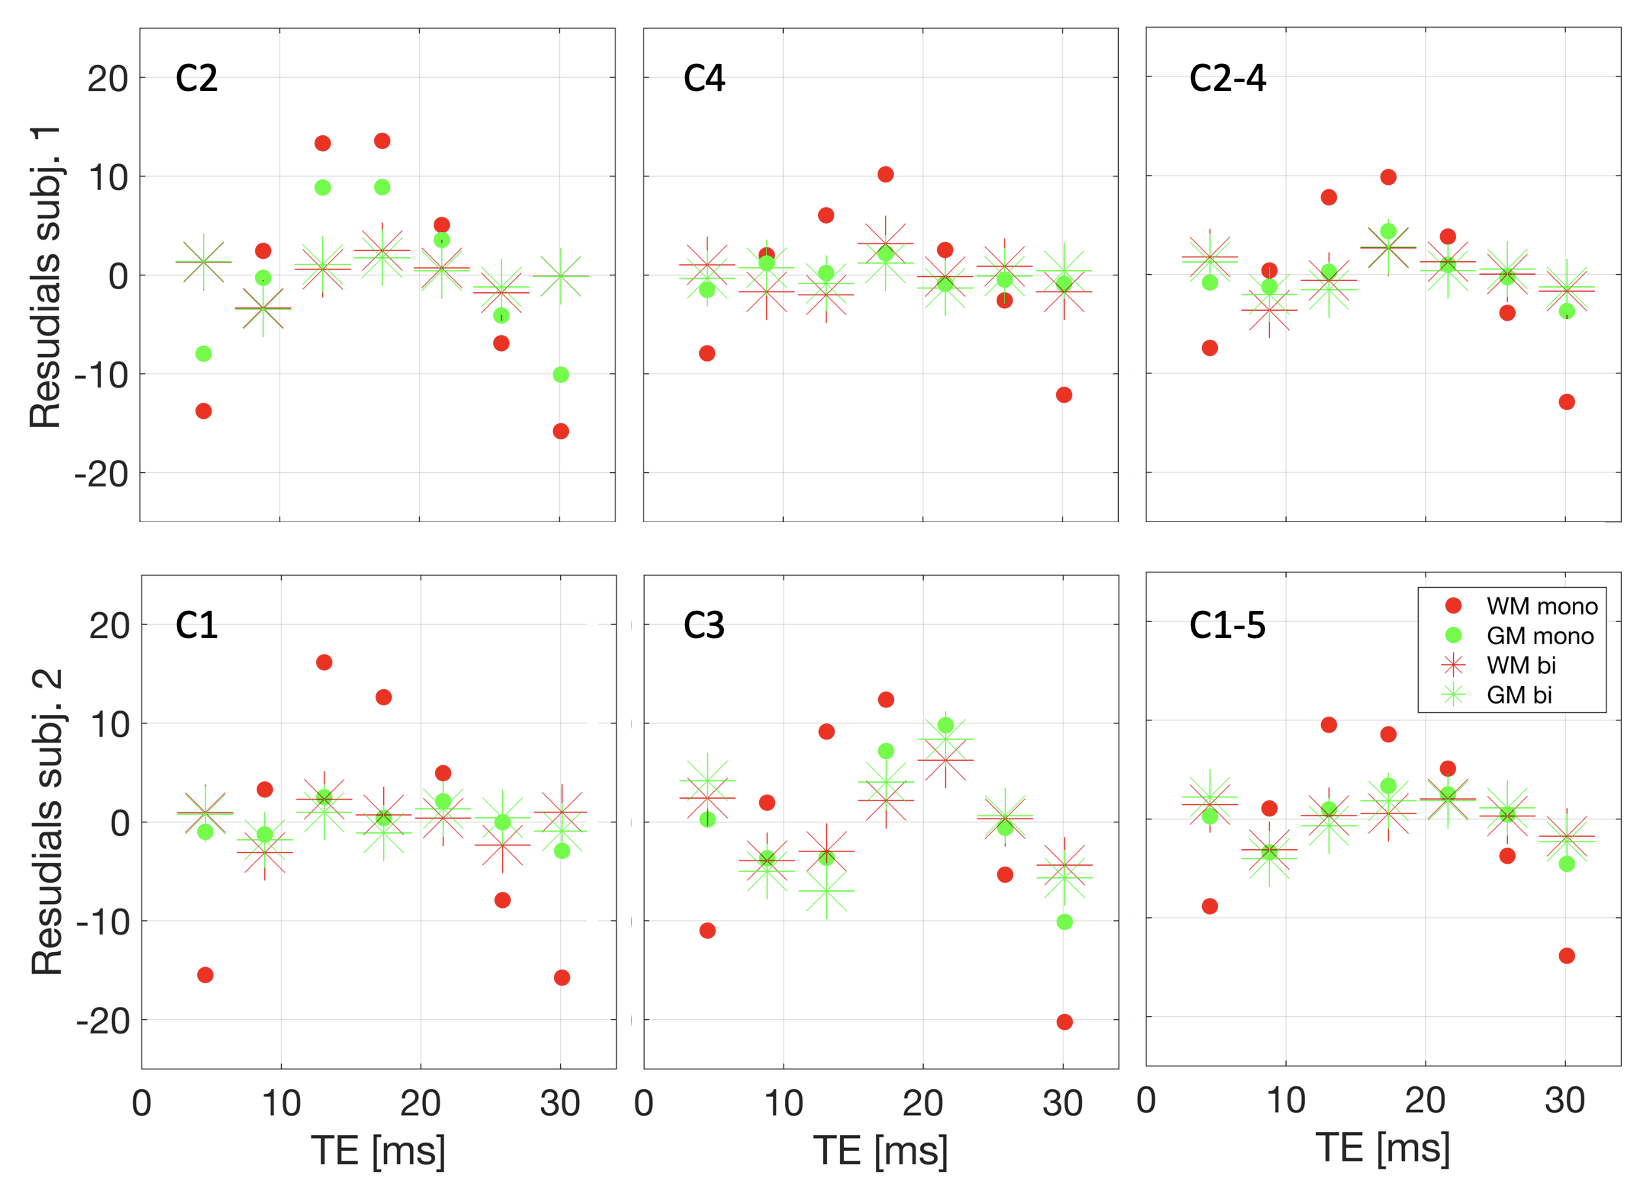
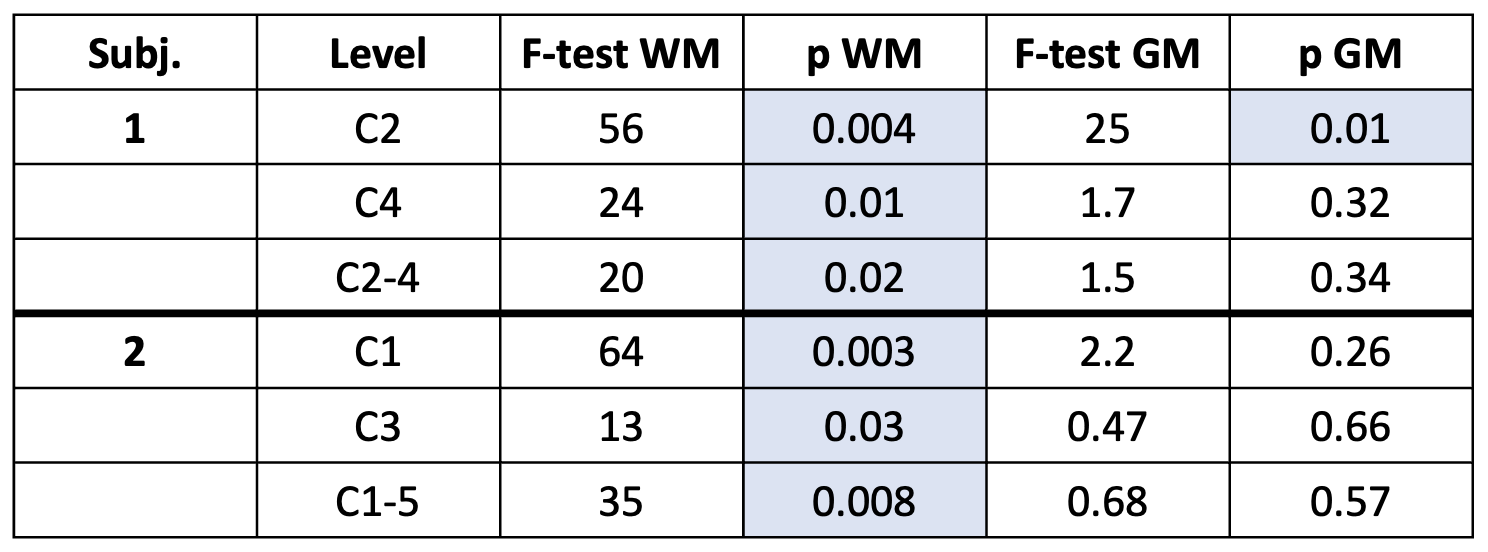
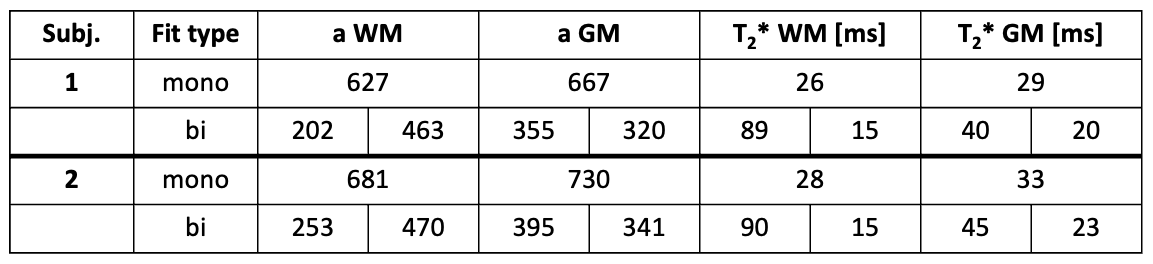
All slices except the lower half in subj. 1 (affected by residual ghosting artifacts), passed the goodness-of-fit threshold (R2>0.98). The mono and bi-exponential models yielded similar fit results in GM, but distinguishable results in WM, with the bi-exponential visually performing better (Fig. 2). The residuals confirmed this, as in WM a persistent trend was visible with the mono-exponential model. The bi-exponential model residuals showed a more noise-like behavior (Fig. 3). The GM residuals showed no consistent pattern and no substantial change by the bi-exponential model, except a few slices (e.g. C2 in subj.1). The F-test (Fig. 4) confirmed that the bi-exponential model is statistically better than the mono-exponential in WM (subj. 1 C2-4: F=20, p=0.02, subj. 2 C1-5: F=35 p=0.008). In GM there were significant results only in one of the considered slices (subj. 1 C2: F=25, p=0.01).Fig. 5 shows preliminary T2* relaxometry results. The mono-exponential model gave a T2* estimate of around 27ms in WM and 31ms in GM. With the bi-exponential model the measured T2* components were around 90 and 15ms in WM and around 42 and 21ms in GM.
Discussion and conclusion
A statistically significant preference for the bi-exponential model was shown in WM, but not in GM in most cases. This agrees with the assumption that the WM signal contains a substantial component of myelin water. One GM slice did show a statistical preference for the bi-exponential model, which may be due to strong partial volume effects due to the thin shape of GM in the upper cervical cord.The T2* values obtained with the mono-exponential model are compatible with previously published results at 7T2. The values obtained with the bi-exponential model are preliminary and need to be confirmed in more participants. Furthermore, both the acquisition and data processing should be optimized for the spinal cord to yield robust multi-exponential relaxometry results.
T2*-weighted imaging is frequently used in diagnostic imaging of the spinal cord1. Better understanding of the underlying signal can be used to optimise acquisition parameters, in order to maximize contrast and, therefore, the sensitivity to lesions in demyelinating diseases. The T2* measurements in themselves may further be useful as a diagnostic metric, after determining a healthy range in a representative cohort.
Acknowledgements
No acknowledgement found.References
- Dula, A. N., Pawate, S., Dortch, R. D., Barry, R. L., George-Durrett, K. M., Lyttle, B. D., Dethrage, L. M., Gore, J. C., & Smith, S. A. (2016). Magnetic resonance imaging of the cervical spinal cord in multiple sclerosis at 7T. Multiple Sclerosis Journal, 22(3), 320–328. https://doi.org/10.1177/1352458515591070
- Barry, R. L., & Smith, S. A. (2019). Measurement of T2* in the human spinal cord at 3T. Magnetic Resonance in Medicine, 82(2), 743–748. https://doi.org/10.1002/mrm.27755
- Massire, A., Taso, M., Besson, P., Guye, M., Ranjeva, J.-P., & Callot, V. (2016). High-resolution multi-parametric quantitative magnetic resonance imaging of the human cervical spinal cord at 7T. NeuroImage, 143, 58–69. https://doi.org/10.1016/j.neuroimage.2016.08.055
- Samson, R. S., Ciccarelli, O., Kachramanoglou, C., Brightman, L., Lutti, A., Thomas, D. L., Weiskopf, N., & Wheeler-Kingshott, C. a. M. (2013). Tissue- and column-specific measurements from multi-parameter mapping of the human cervical spinal cord at 3T. NMR in Biomedicine, 26(12), 1823–1830. https://doi.org/10.1002/nbm.3022
- Versluis, M. J., Peeters, J. M., van Rooden, S., van der Grond, J., van Buchem, M. A., Webb, A. G., & van Osch, M. J. P. (2010). Origin and reduction of motion and f0 artifacts in high resolution T2*-weighted magnetic resonance imaging: Application in Alzheimer’s disease patients. NeuroImage, 51(3), 1082–1088. https://doi.org/10.1016/j.neuroimage.2010.03.048
- Beghini L., David G., Liechti D. M., Büeler S., Vannesjo S. J. (2023). Optimised navigator correction of physiological field fluctuations in multi-echo GRE of the lumbar spinal cord at 3T. Proceedings of the International Society for Magnetic Resonance in Medicine (ISMRM). https://github.com/NordicMRspine/MRINavigator.jl
- Knopp, T., & Grosser, M. (2021). MRIReco.jl: An MRI reconstruction framework written in Julia. Magnetic Resonance in Medicine, 86(3), 1633–1646. https://doi.org/10.1002/mrm.28792
- Pruessmann, K. P., Weiger, M., Scheidegger, M. B., & Boesiger, P. (1999). SENSE: Sensitivity encoding for fast MRI. Magnetic Resonance in Medicine, 42(5), 952–962. https://doi.org/10.1002/(SICI)1522-2594(199911)42:5<952::AID-MRM16>3.0.CO;2-S
- Pruessmann, K. P., Weiger, M., Börnert, P., & Boesiger, P. (2001). Advances in sensitivity encoding with arbitrary k -space trajectories: SENSE With Arbitrary k -Space Trajectories. Magnetic Resonance in Medicine, 46(4), 638–651. https://doi.org/10.1002/mrm.1241
- De Leener B, Lévy S, Dupont SM, et al. (2017) SCT: Spinal Cord Toolbox, an open-source software for processing spinal cord MRI data. NeuroImage. 145, 24-43. https://doi.org/10.1016/j.neuroimage.2016.10.009
Figures