2181
Automatic detection and measurement of WM lesions in MS patients using MR-STAT and a self-supervised bivariate Gaussian probabilistic model1Computational Imaging Group for MR Therapy and Diagnostics, UMC Utrecht, Utrecht, Netherlands, 2Department of Radiology and Nuclear Medicine, UMC Utrecht, Utrecht, Netherlands, 3Department of Radiology, Amsterdam UMC, Amsterdam, Netherlands, 4Department of Radiotherapy, UMC Utrecht, Utrecht, Netherlands, 5Department of Medical Imaging, Radboud UMC, Nijmegen, Netherlands
Synopsis
Keywords: Relaxometry, Relaxometry, MR-STAT, Multiple sclerosis, Machine Learning
Motivation: Radiology workflow around multiple sclerosis (MS) patients is time-consuming.
Goal(s): To automatically count and measure individual white matter anomalies in MS patients from a five-minute Magnetic Resonance Spin TomogrAphy in Time-domain (MR-STAT) scan.
Approach: We imaged ten healthy volunteers (HV) and six MS patients using a five-minute MR-STAT protocol. Resulting quantitative data from seven HVs was fit to a multivariate Gaussian probabilistic model. The model was tested on three HVs and six MS patients.
Results: Automatic anomaly detection was moderately accurate in MS patients. No anomalies were found in HVs. These results underline the potential for a shorter acquisition with automatic outlier detection.
Impact: MRI protocols for MS patients are lengthy and the assessing the images is a time-consuming task for the radiologist. We combine a fast (five-minute) MR-STAT relaxometry scan with a data-driven, automatic outlier detection strategy to potentially accelerate the clinical workflow.
Introduction
Recent guidelines for multiple sclerosis (MS) Magnetic Resonance Imaging (MRI) recommend using multiple contrast weighted scans to diagnose and monitor disease progression and treatment1. However, acquiring multiple contrast weighted scans and the visual assessment of images are time-consuming tasks. Especially the image assessment is labor-intensive, since lesions must be counted to assess the state of disease1.Fast, quantitative MRI potentially offers a solution to both problems. Earlier work on relaxometry has demonstrated the potential of using quantitative maps to detect white matter (WM) anomalies in MS patients using either T1, T2 or the ratio T2/T12,3. However, in that earlier work, the acquisition time was ~12 minutes2,3. In this work, we use (1) a fast MR-STAT4 relaxometry protocol of just five minutes and (2) cast the reconstructed T1- and T2-values into a multivariate Gaussian model. Contrary to supervised learning, which requires individual class labels, this self-supervised model only requires T1- and T2-values from WM and lesions are automatically identified as outliers without the need of gadolinium based contrast agents or other imaging data.
Methods
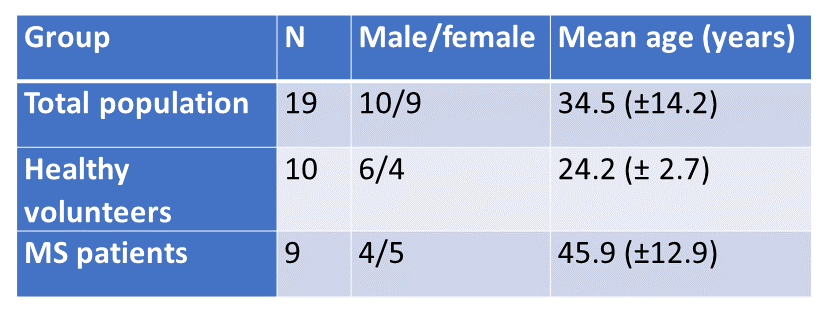
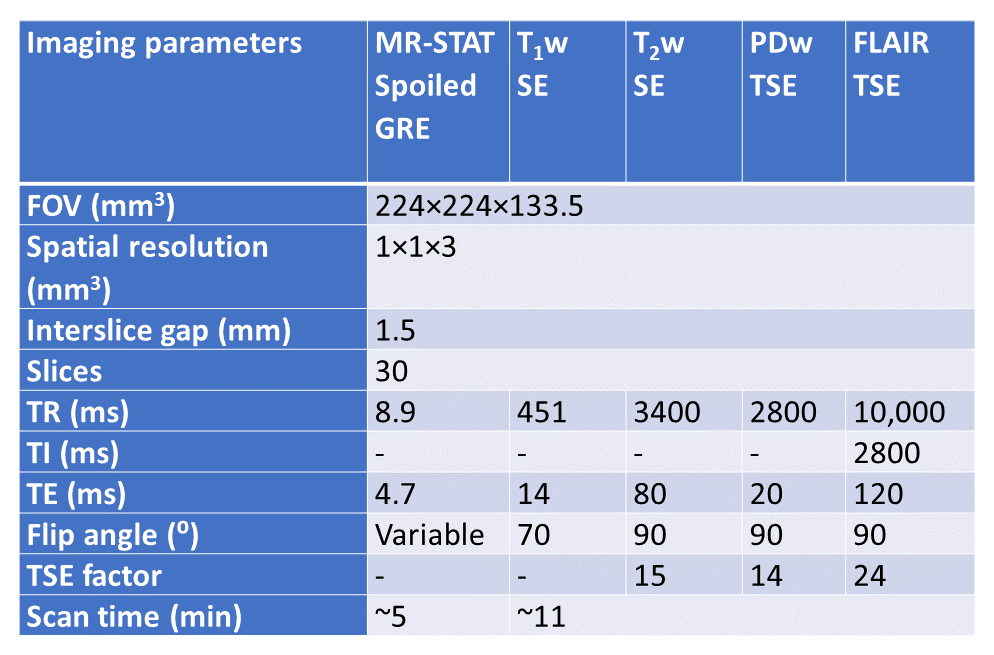
19 adults (21-67 years old) were retrospectively included from an MR-STAT clinical study5. See Figure 1.MRI acquisitions were performed on a 3T Philips MR System (Ingenia, Philips Healthcare, The Netherlands) using a 15 channel receiver head coil. For validation, conventional scans (T1-weighted, T2-weighted, Proton Density-weighted, Fluid-Attenuated Inversion Recovery) were acquired (see Figure 2). These scans were used to define the lesions mask. Data reconstruction was performed according to methods described earlier6.
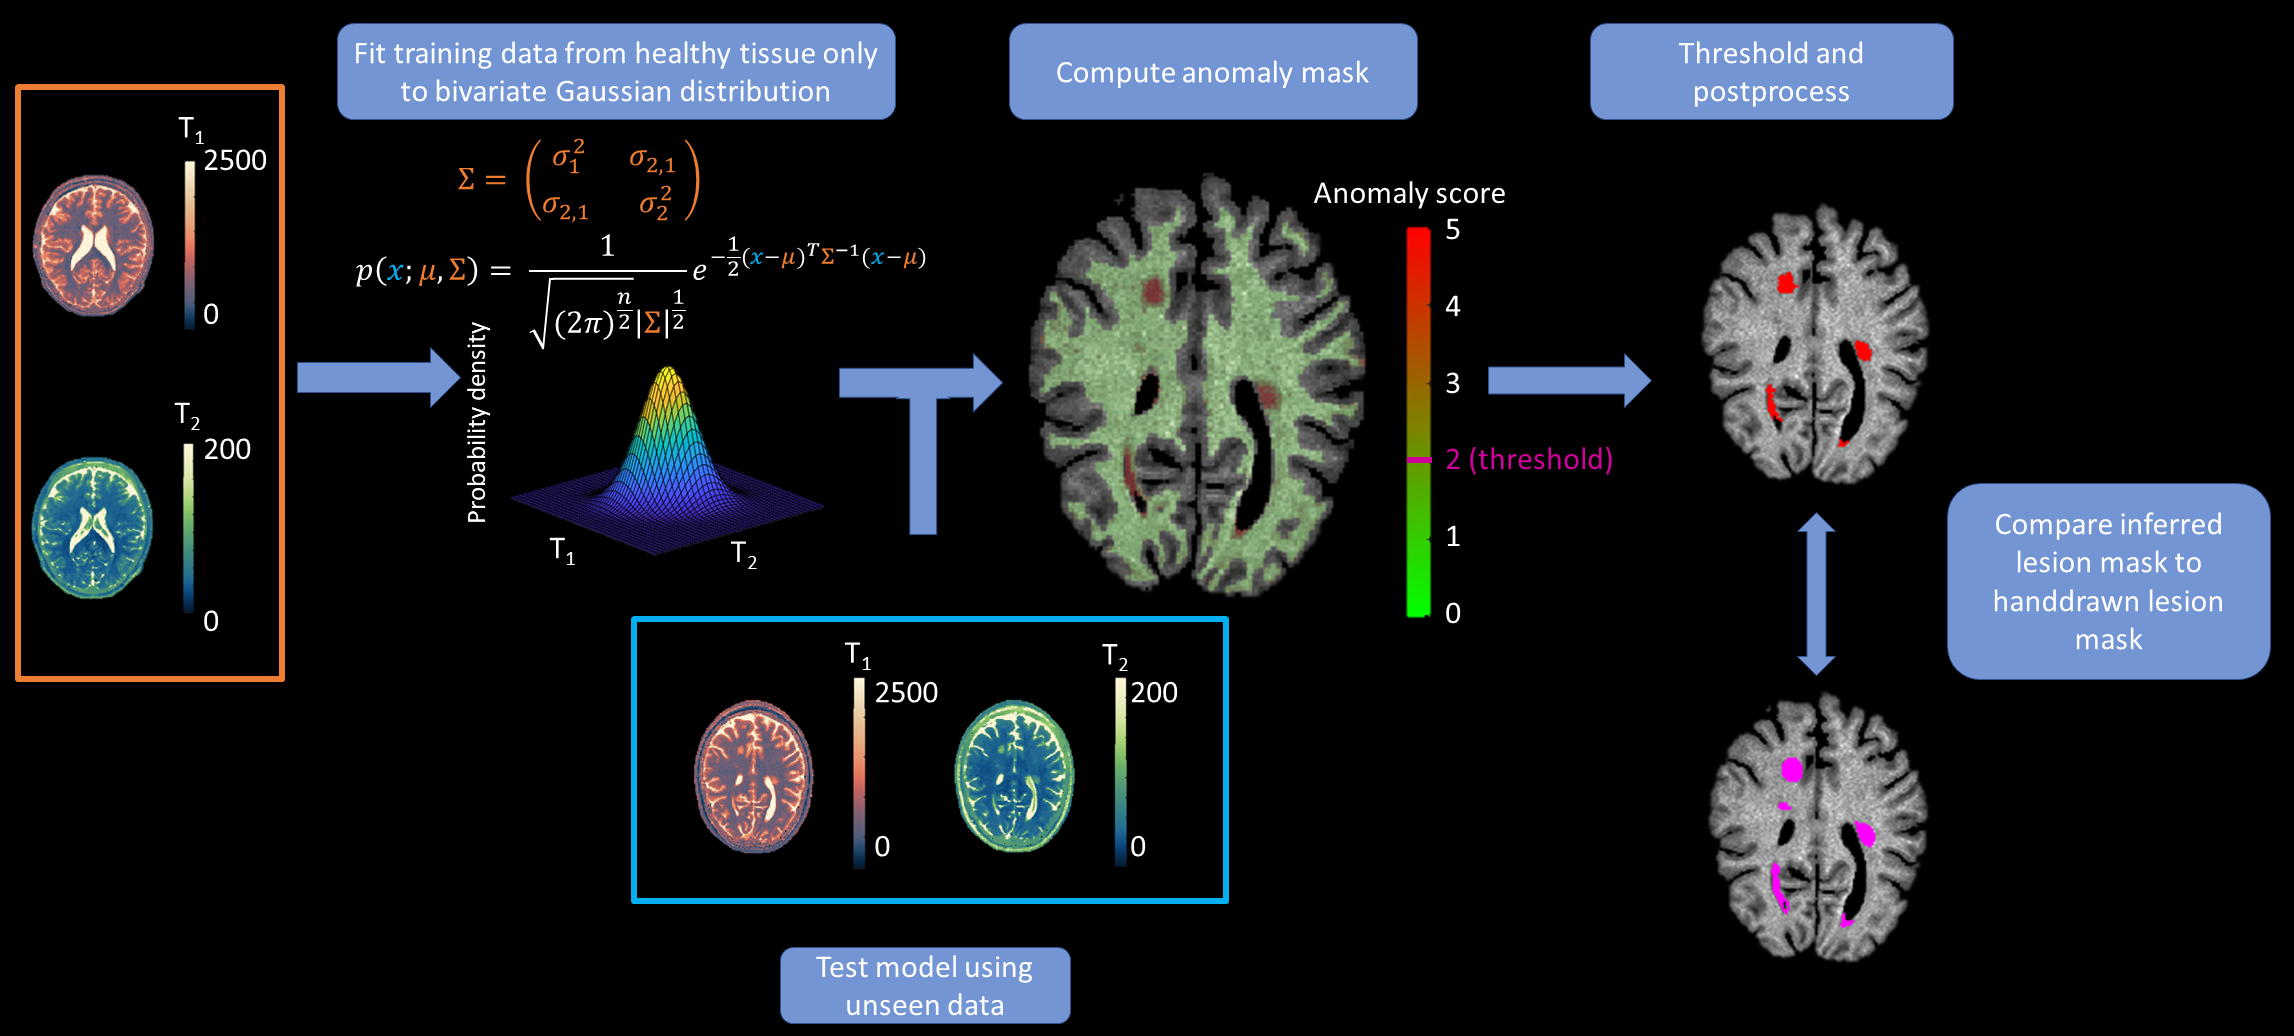
The focus of this work will primarily be on counting lesions because of guideline recommendations1. Measuring volume is a secondary goal. For that reason, slices from MS patients that contained separable lesions only were included in the analysis. Slices from MS patients with confluent lesions and slices without lesions were therefore excluded. Consequently, 3 MS patients were excluded from the analysis. Data was split in a training (seven healthy volunteers (HV)) and a testing (three HVs, six MS patients) set. None of the HVs had visible lesions on the contrast-weighted scans. WM lesions in MS patients were manually segmented in FSL7. The lesion detection procedure contained the following steps (see Figure 3):
(1) Healthy WM data from the training set was obtained by automatic segmentation of WM using the Vol2brain software8;
(2) A bivariate Gaussian probability density function was fit to the T1- and T2-values from WM voxels of the training group. Values were shifted and scaled to fit a standard normal distribution (N(0,I));
(3) Conform to earlier literature9,10, data was corrected for age;
(4) T1- and T2-maps for participants in the testing set were scaled and shifted according to the bivariate Gaussian model (step (2)) and were corrected for age (step (3)). Values in the resulting anomaly score map correspond to the distance a pair of T1-and T2-values deviates from the age-expected values. This distance is quantified in terms of standard deviations (SD);
(5) The cut-off (ε) for the anomaly score maps was set to +/-2 SDs from the expected values, resulting in lesion masks. To reduce false positives, anomalies with less than four in-slice connected voxels were removed.
Precision, recall, Dice score and detected lesion volume as fraction of ground truth volume were calculated automatically between the inferred and the manually segmented lesion masks.
Results
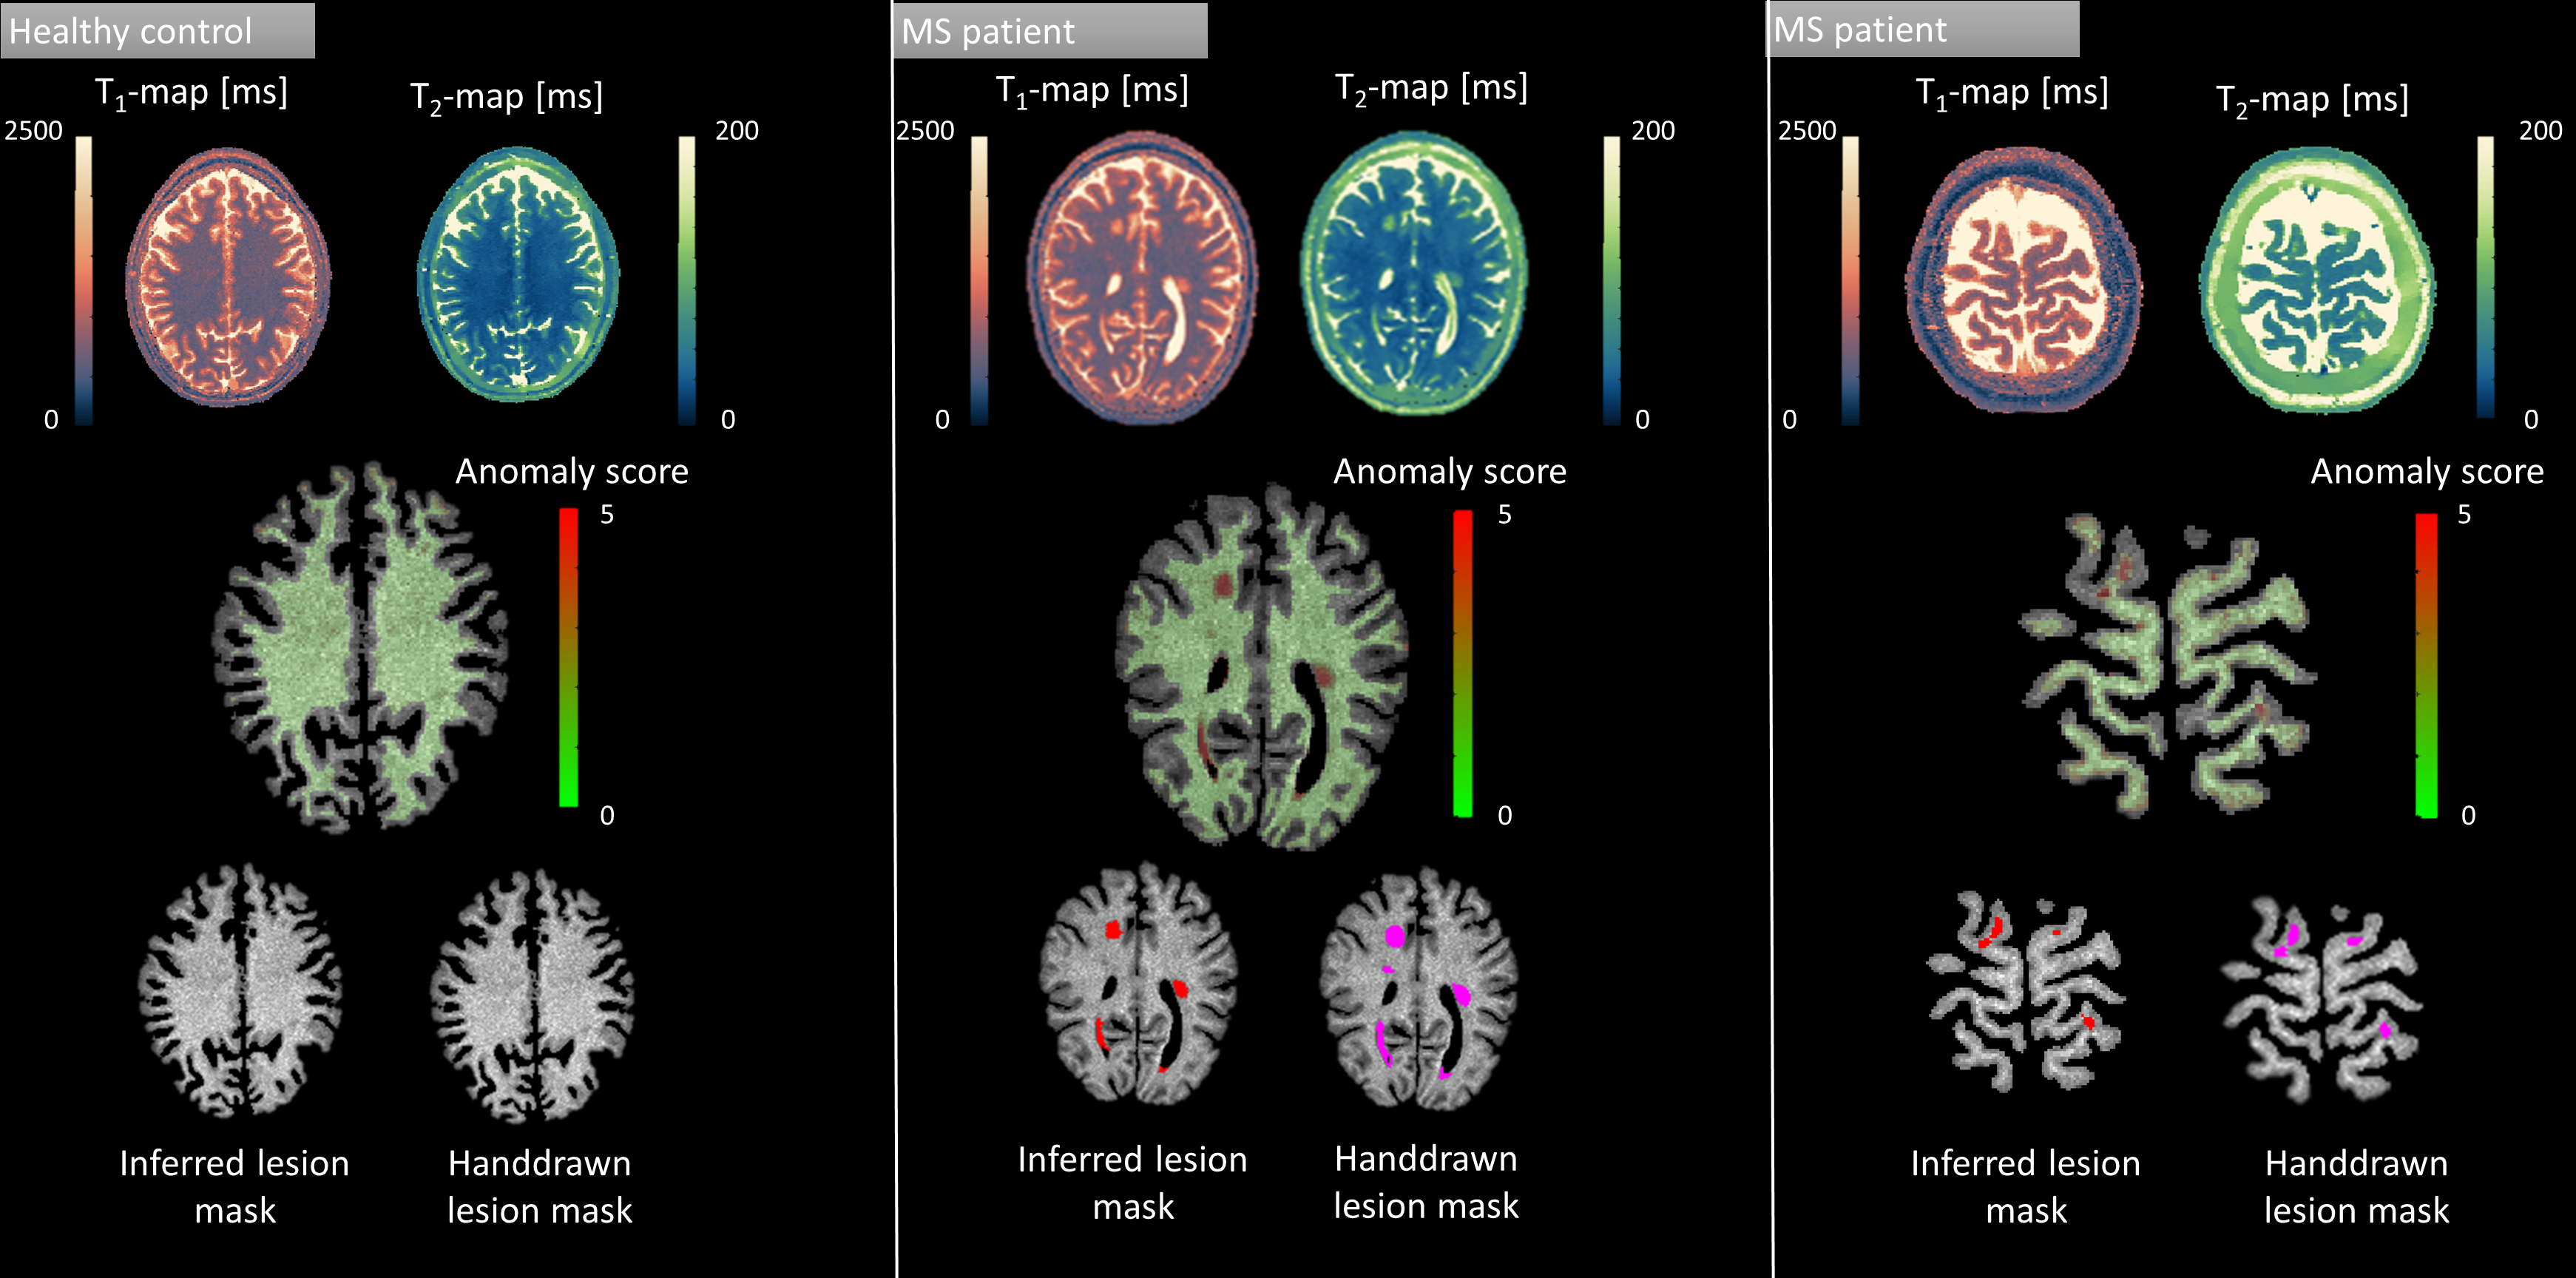
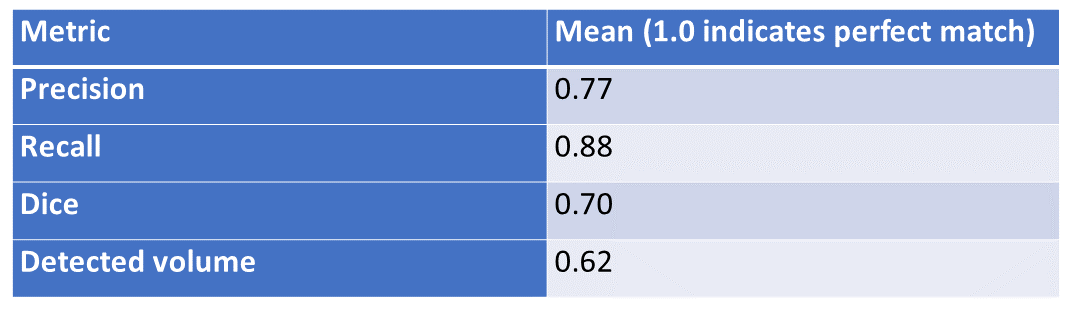
Figure 4 shows example T1- and T2-maps, anomaly maps, resulting masks and ground truth masks for one HV and two MS patients (test data). The bottom row shows the inferred and hand drawn lesion mask. One lesion was not detected for the MS patient in the middle. For the three HVs, no lesions were detected. For the six MS patients, the results (precision=0.77; recall=0.88; Dice=0.7; detected volume=0.62) are summarized in Figure 5.Discussion & conclusion
Leveraging the multiparametric quantitative nature of MR-STAT, we demonstrated the potential of a multivariate Gaussian probabilistic model to detect WM lesions and quantify individual lesion volume from a five-minute protocol insightfully. This could help to accelerate the radiology workflow for MS patients.The high scores on precision and recall indicate accurate automatic lesion detection based on T1- and T2-values obtained with a multiparametric MR-STAT protocol. However, the dice and volume scores indicate that volumes of lesions were, in general, underestimated. This is likely due to partial volume effects, which can be alleviated by using a higher-resolution protocol11. Note that only HV data was used for training, highlighting the practical advantages of a self-supervised probabilistic approach. Future research should evaluate this model’s performance on patients with confluent lesions.
Acknowledgements
No acknowledgement found.References
1. Wattjes MP, Ciccarelli O, Reich DS, et al. 2021 MAGNIMS–CMSC–NAIMS consensus recommendations on the use of MRI in patients with multiple sclerosis. Lancet Neurol. 2021;20(8):653-670. doi:10.1016/S1474-4422(21)00095-8
2. Piredda GF, Hilbert T, Granziera C, et al. Quantitative brain relaxation atlases for personalized detection and characterization of brain pathology. Magn Reson Med. 2020;83(1):337-351. doi:10.1002/mrm.27927
3. Ravano V, Caneschi S, Krasensky J, et al. Normative brain atlas of T2/T1 relaxometry ratio for detection of microstructural pathology. In: Proc. Intl. Soc. Mag. Reson. Med. 31 (2023). ; 2023.
4. Sbrizzi A, Heide O van der, Cloos M, et al. Fast quantitative MRI as a nonlinear tomography problem. Magn Reson Imaging. 2018;46:56-63. doi:10.1016/j.mri.2017.10.015
5. Kleinloog JPD, Mandija S, D’Agata F, et al. Synthetic MRI with Magnetic Resonance Spin TomogrAphy in Time-Domain (MR-STAT): Results from a Prospective Cross-Sectional Clinical Trial. J Magn Reson Imaging. 2023;57(5):1451-1461. doi:https://doi.org/10.1002/jmri.28425
6. Liu H, van der Heide O, Mandija S, van den Berg CAT, Sbrizzi A. Acceleration Strategies for MR-STAT: Achieving High-Resolution Reconstructions on a Desktop PC Within 3 Minutes. IEEE Trans Med Imaging. 2022;41(10):2681-2692. doi:10.1109/TMI.2022.3168436
7. McCarthy P. FSLeyes. Published online June 13, 2023. doi:10.5281/ZENODO.8033457
8. Manjón J V., Romero JE, Vivo-Hernando R, et al. vol2Brain: A New Online Pipeline for Whole Brain MRI Analysis. Front Neuroinform. 2022;16. doi:10.3389/fninf.2022.862805
9. Okubo G, Okada T, Yamamoto A, et al. Relationship between aging and T 1 relaxation time in deep gray matter: A voxel-based analysis. J Magn Reson Imaging. 2017;46(3):724-731. doi:10.1002/jmri.25590
10. Badve C, Yu A, Rogers M, et al. Simultaneous T1 and T2 Brain Relaxometry in Asymptomatic Volunteers Using Magnetic Resonance Fingerprinting. Tomography. 2015;1(2):136-144. doi:10.18383/j.tom.2015.00166
11. Liu H, Van Der Heide O, Versteeg E, et al. A three-dimensional MR-STAT protocol for high-resolution multi-parametric quantitative MRI. NMR Biomed. 2023;IN PRESS
Figures