2180
Diffusion Time Dependent Radial Diffusivity & Myelin qMRI in Ex Vivo Ferret Spinal Cord1Biomedical Engineering, Vanderbilt University, Nashville, TN, United States, 2Vanderbilt University Institute of Imaging Science, Nashville, TN, United States, 3Radiology and Radiological Sciences, Vanderbilt University Medical Center, Nashville, TN, United States
Synopsis
Keywords: Relaxometry, White Matter
Motivation: There remains a gap in knowledge surrounding what microstructural features impact similar myelin qMRI metrics.
Goal(s): The goal of this work is to evaluate the relationship between a novel axon diameter surrogate and myelin qMRI metrics.
Approach: Ex vivo ferret spinal cords were imaged at 15T using multiple spin echo, selective inversion recovery and diffusion tensor imaging sequences.
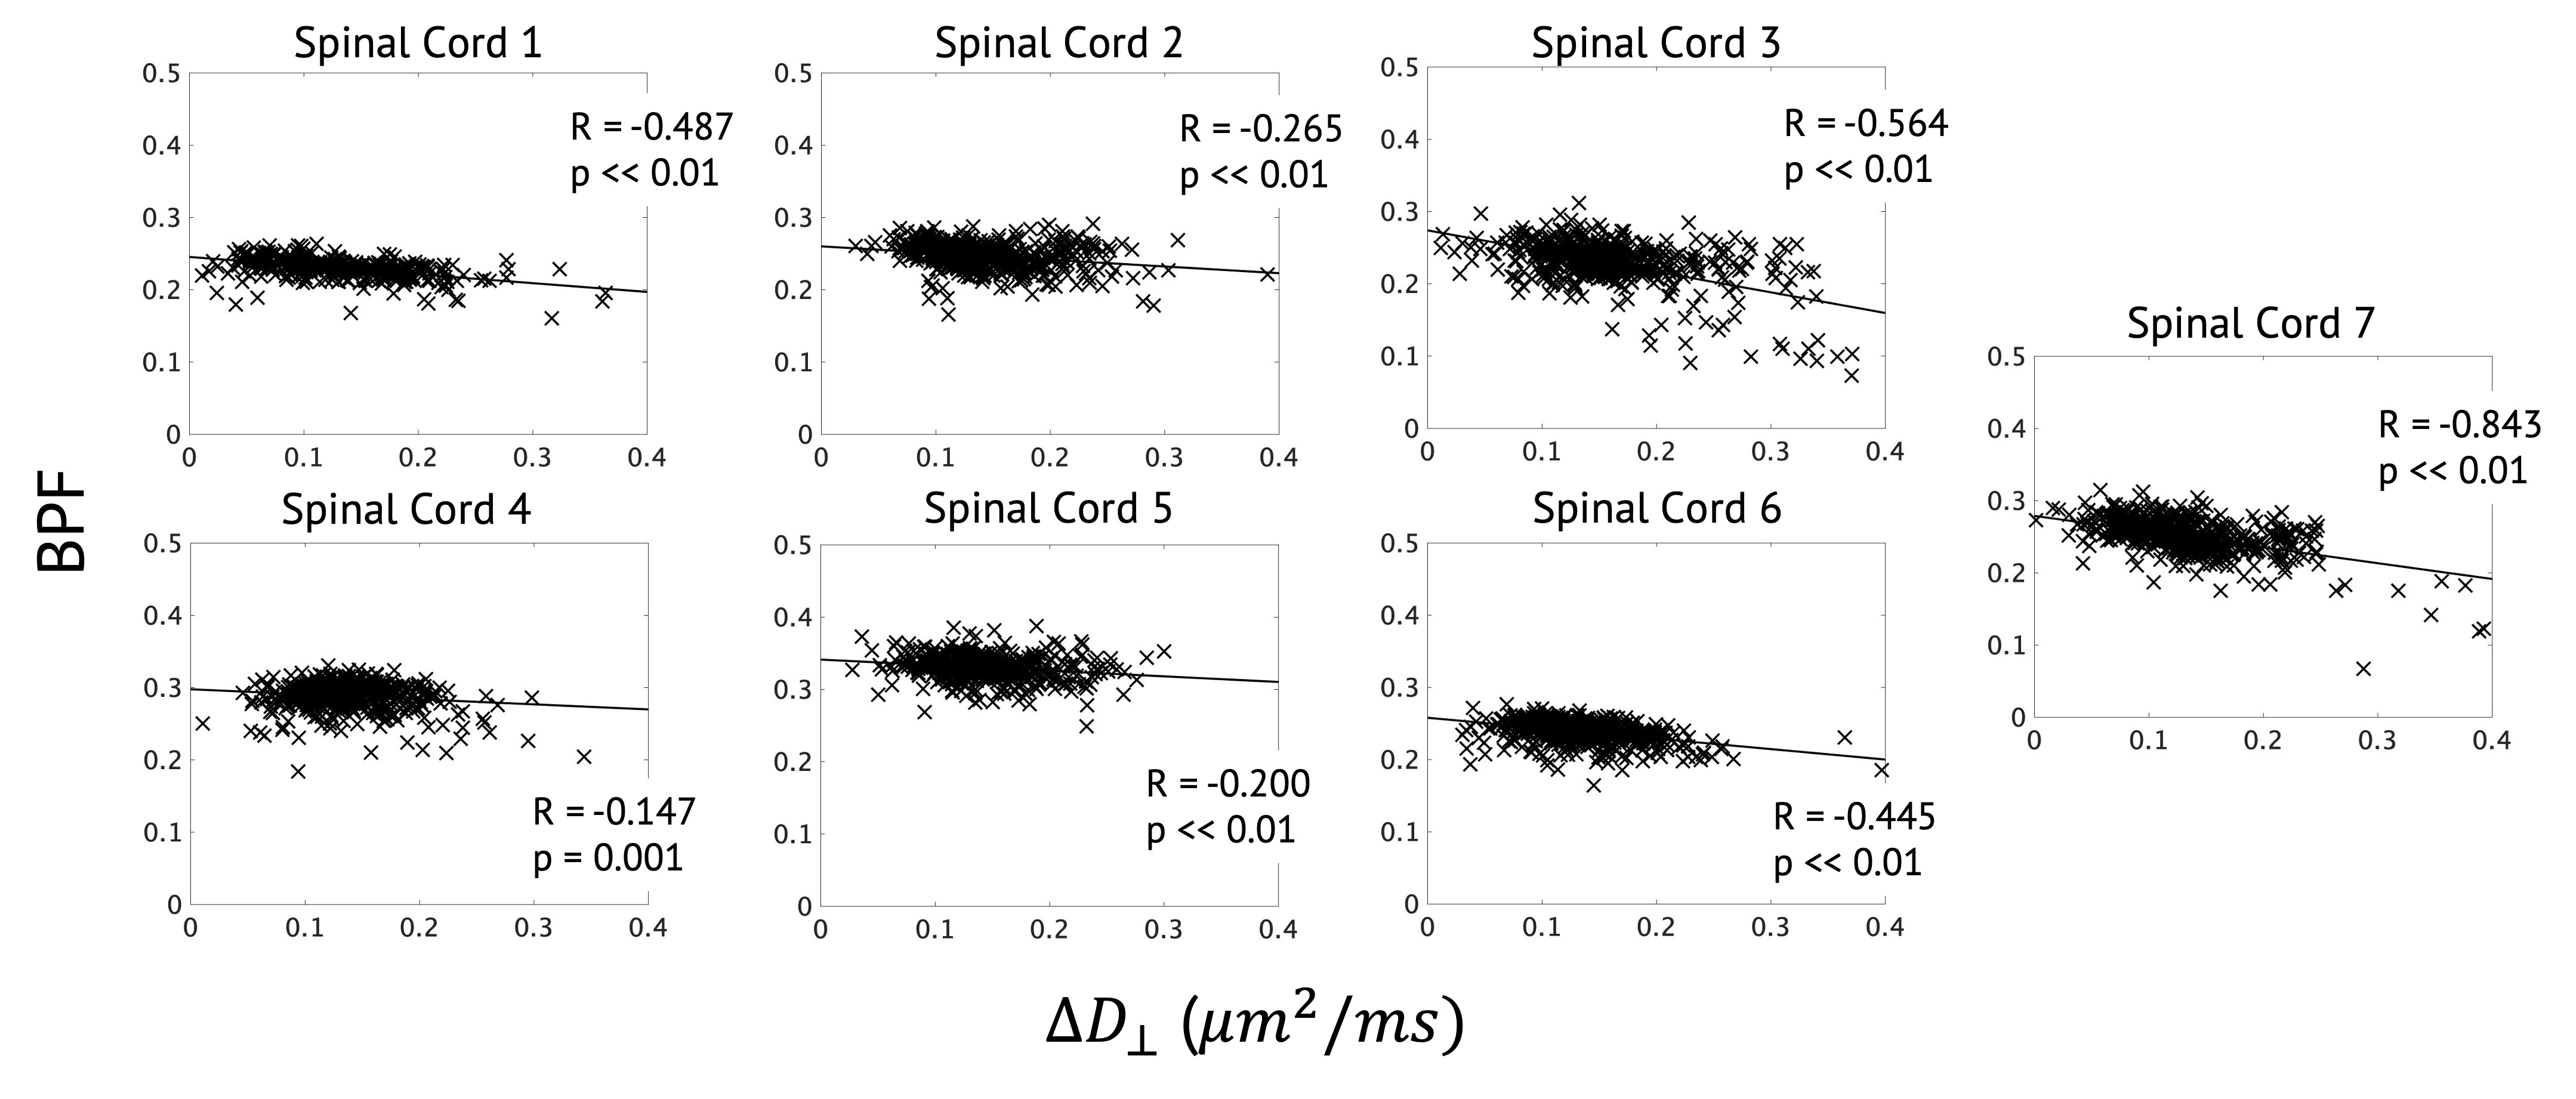
Results: BPF was found to have a negative correlation with the axon diameter surrogate measure. MET2 derived metrics were found to have no correlation with the axon diameter surrogate measure.
Impact: The diffusion time dependence of the radial diffusivity is thought to report on axon diameter towards detecting microstructural changes as a result of pathology. This work provides further evaluation of this metric and other relaxation parameters of white matter.
Background and Significance
Several quantitative magnetic resonance imaging (qMRI) methods report on the microstructural features of white matter. Specifically, multiple spin echo (MSE) and selective inversion recovery (SIR) can be used to measure myelin water fraction (MWF) and bound pool fraction (BPF), respectively. Both of these metrics correlate with histologic quantifications of myelin, though there remains uncertainty regarding their interpretation and what microstructural features influences each of them. Previous work in rat spinal cords (SCs) found MWF and BPF to have different relationships with histology derived measures of axon diameter (AD) and myelin thickness1. These data indicate that MWF and BPF are influenced by more than just myelin content and may provide insight on other microstructural features. This work investigates these relationships on a voxel-wise basis in ex vivo ferret SCs using a recently proposed surrogate for AD, the change in radial diffusivity (ΔD⊥) with effective diffusion time (Δeff)2.Methods
Tissues: Adult male ferrets (N = 7) were anesthetized and perfused following which, their SCs were extracted. Tissues were submersed in Fomblin for imaging.MRI Acquisitions: MSE and SIR acquisitions were performed to measure multi-exponential T2 (MET2) and magnetization transfer (MT) metrics respectively. Diffusion tensor imaging was also performed using both an oscillating gradient spin echo (OGSE) sequence with Δeff = 2.5 ms and a pulsed gradient SE (PGSE) sequence with Δeff = 25 ms.
Analyses: Image reconstruction and analyses were completed in MATLAB using the REMMI toolbox. A threshold of FA > 0.7 was used to segment white matter from gray matter. The threshold mask was applied to parameter maps as shown in Figure 1. Linear correlations were assessed and considered significant for p < 0.002 including the Bonferroni correction for 28 comparisons.
Results
Representative segmented parameter maps from SC 2 are shown in Figure 1, as well as an anatomic reference image. Scatter plots are shown for MET2 derived metrics, MWF, “other” water T2 (OWT2), and myelin water T2 (MWT2) in Figures 2, 3, and 4 respectively. Across seven SCs, MWF and MWT2 were found to have no correlation with ΔD⊥. OWT2 was found to have a positive correlation with ΔD⊥ in 4/7 SCs. The correlation coefficients describing this relationship were 0.426, 0.157, 0.141 and 0.742 (p < 0.002 in all cases). In Figure 5 the correlation between MT derived BPF and the AD surrogate are shown. All seven SCs showed a negative correlation between BPF and ΔD⊥ with correlation coefficients ranging from -0.147 to -0.843 (p < 0.002 in all cases).Discussion
Previous work in rat SC found a positive correlation between MET2 derived metrics and histology derived AD (ADhist). The results found in that work were interpreted to be due to an exchange of water between myelin and non-myelin compartments, with a higher rate of exchange in thin myelin causing an underestimation of MWF, MWT2 and OWT2. In the current study, no clear correlation was found between MET2 metrics and ΔD⊥. However, while the negative correlation between BPF and ADhist was not significant in the previous study, this work found significant negative correlations in all SCs between BPF and ΔD⊥.There are differences between the previous study and the current work in addition to the different animal species. The previous study was performed at 7T, and the tissues were not doped with gadolinium (Gd), while the current work was performed at 15.2T with samples soaked in solution with 1 mM of Gd. Though higher field provides higher SNR, the reduced T2s affect fitting the short T2 signal peak. Additionally, previous work used ADhist, while current analyses exploit the proposed AD surrogate, ΔD⊥. To this point ΔD⊥ has only been evaluated in simulation as an AD surrogate and may not be as robust in tissue samples. Future work will include performing scanning electron microscopy on the SCs included in this study to gain crucial insight to the microstructure, as well as evaluating ΔD⊥ against ADhist, and imaging a subset of these samples at 7T after washing out the Gd to assess the impact on the relationships in question.
Conclusion
In conclusion, MET2 derived metrics were found to have no significant correlation with the proposed axon diameter surrogate, ΔD⊥. Conversely, BPF was found to have a significant negative correlation with ΔD⊥.Acknowledgements
Funding: NIH RO1 EB031954 and the National Science Foundation Graduate Research Fellowship.
References
1. Dula, A. N., Gochberg, D. F., Valentine, H. L., Valentine, W. M. & Does, M. D. Multiexponential T2, magnetization transfer, and Quantitative histology in white matter tracts of rat spinal cord. Magn Reson Med 63, 902–909 (2010).
2. Harkins, K. D., Beaulieu, C., Xu, J., Gore, J. C. & Does, M. D. A simple estimate of axon size with diffusion MRI. Neuroimage 227, (2021).
Figures
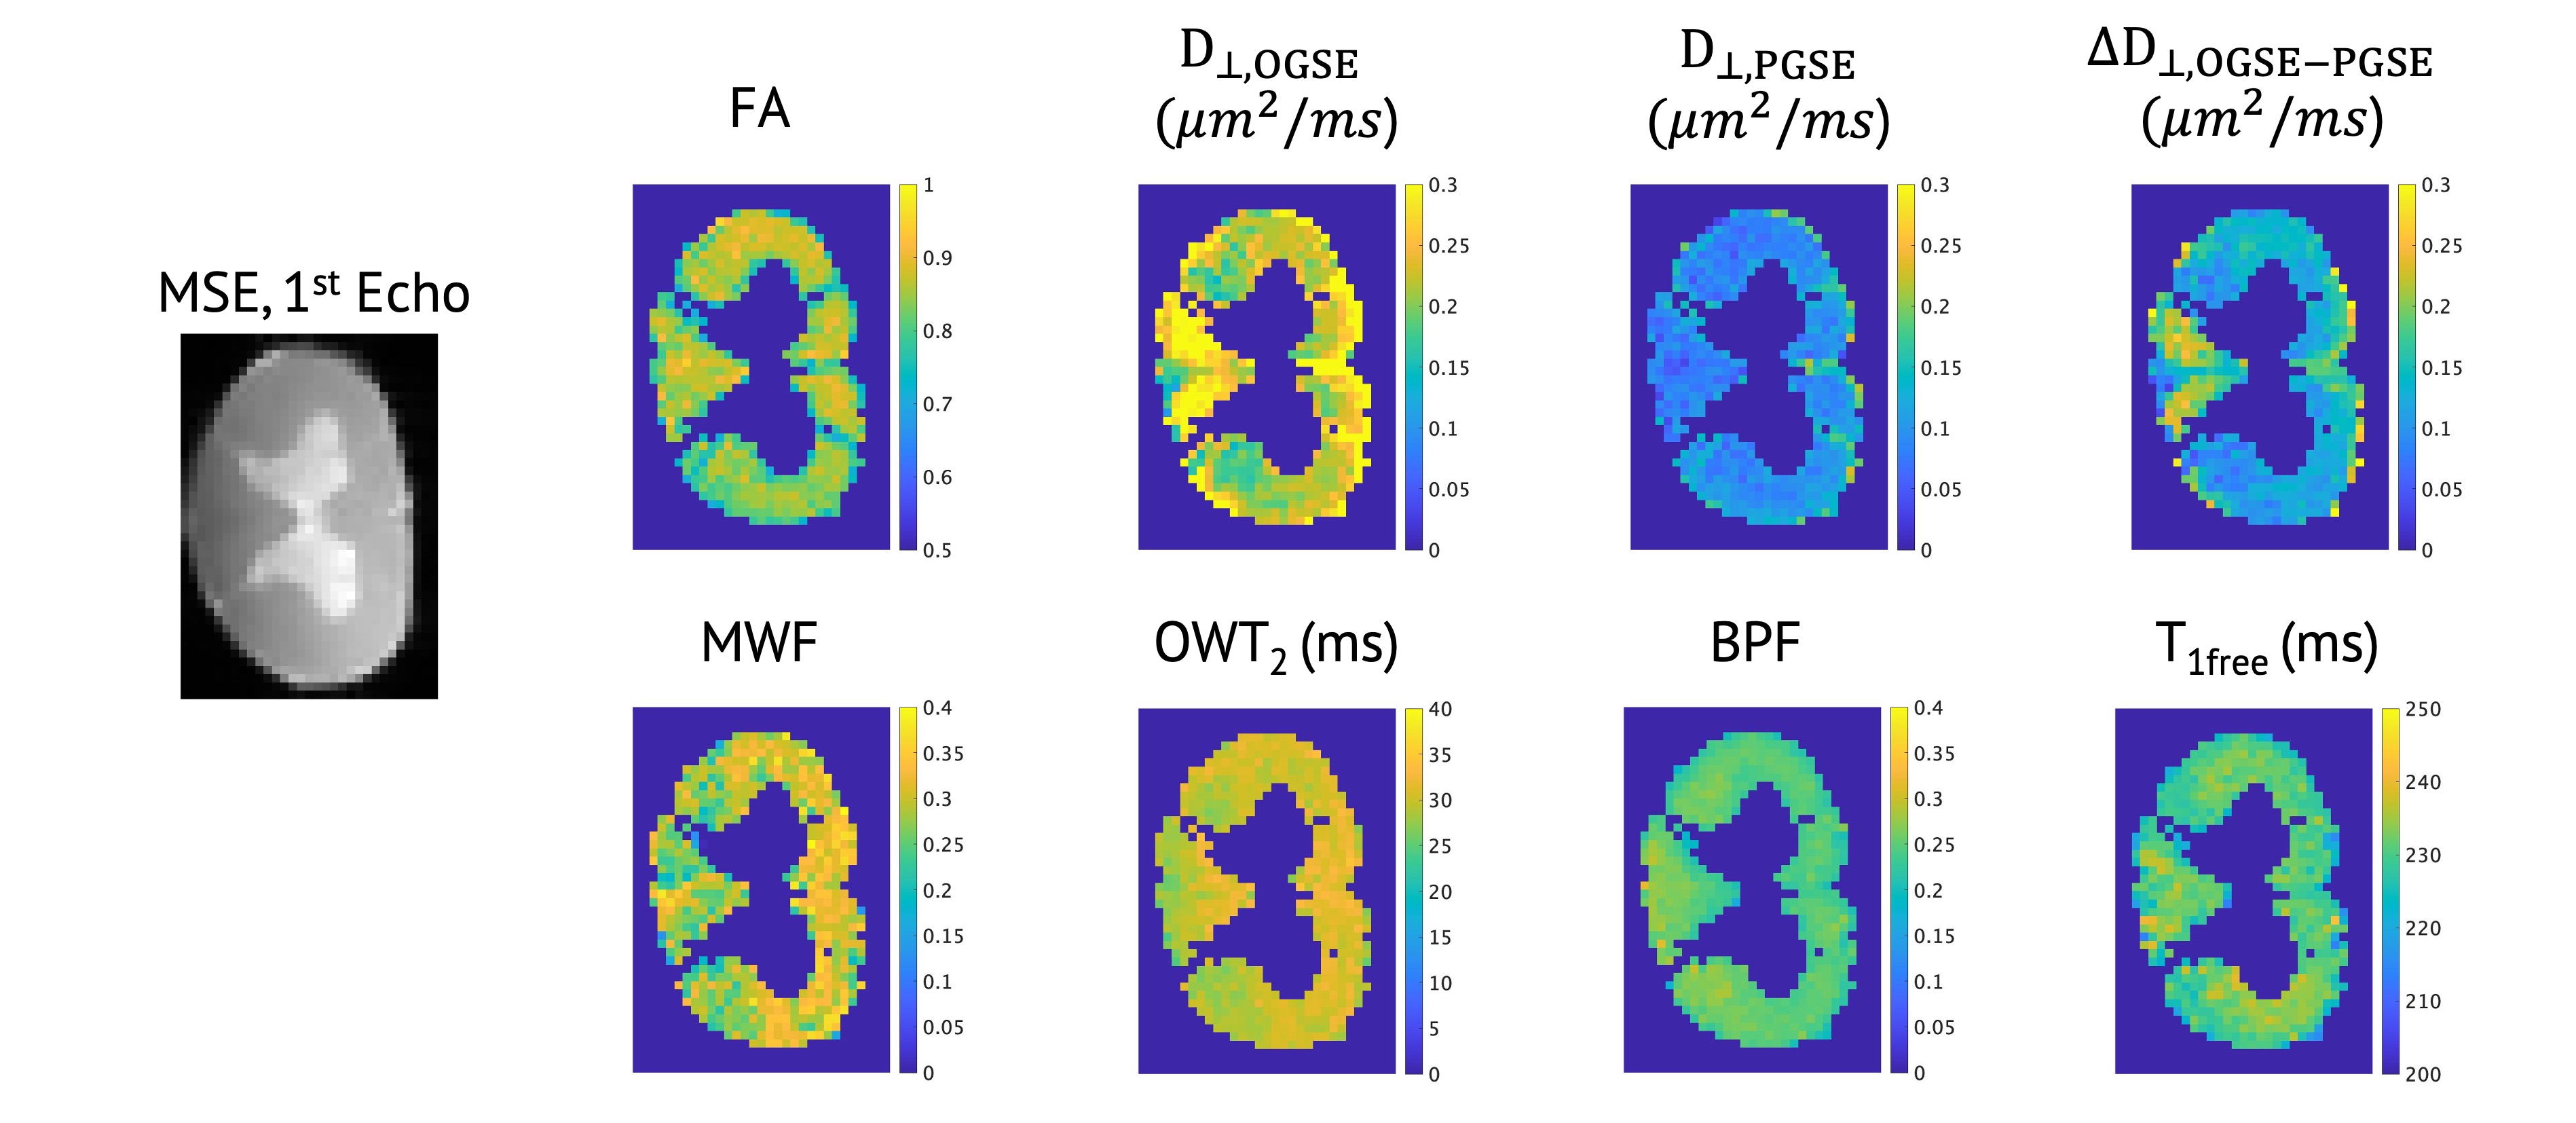
Figure 1: Far left, first echo image from the MSE acquisition for anatomic reference. The remaining eight images are parameter maps from a representative spinal cord with a white matter mask applied.
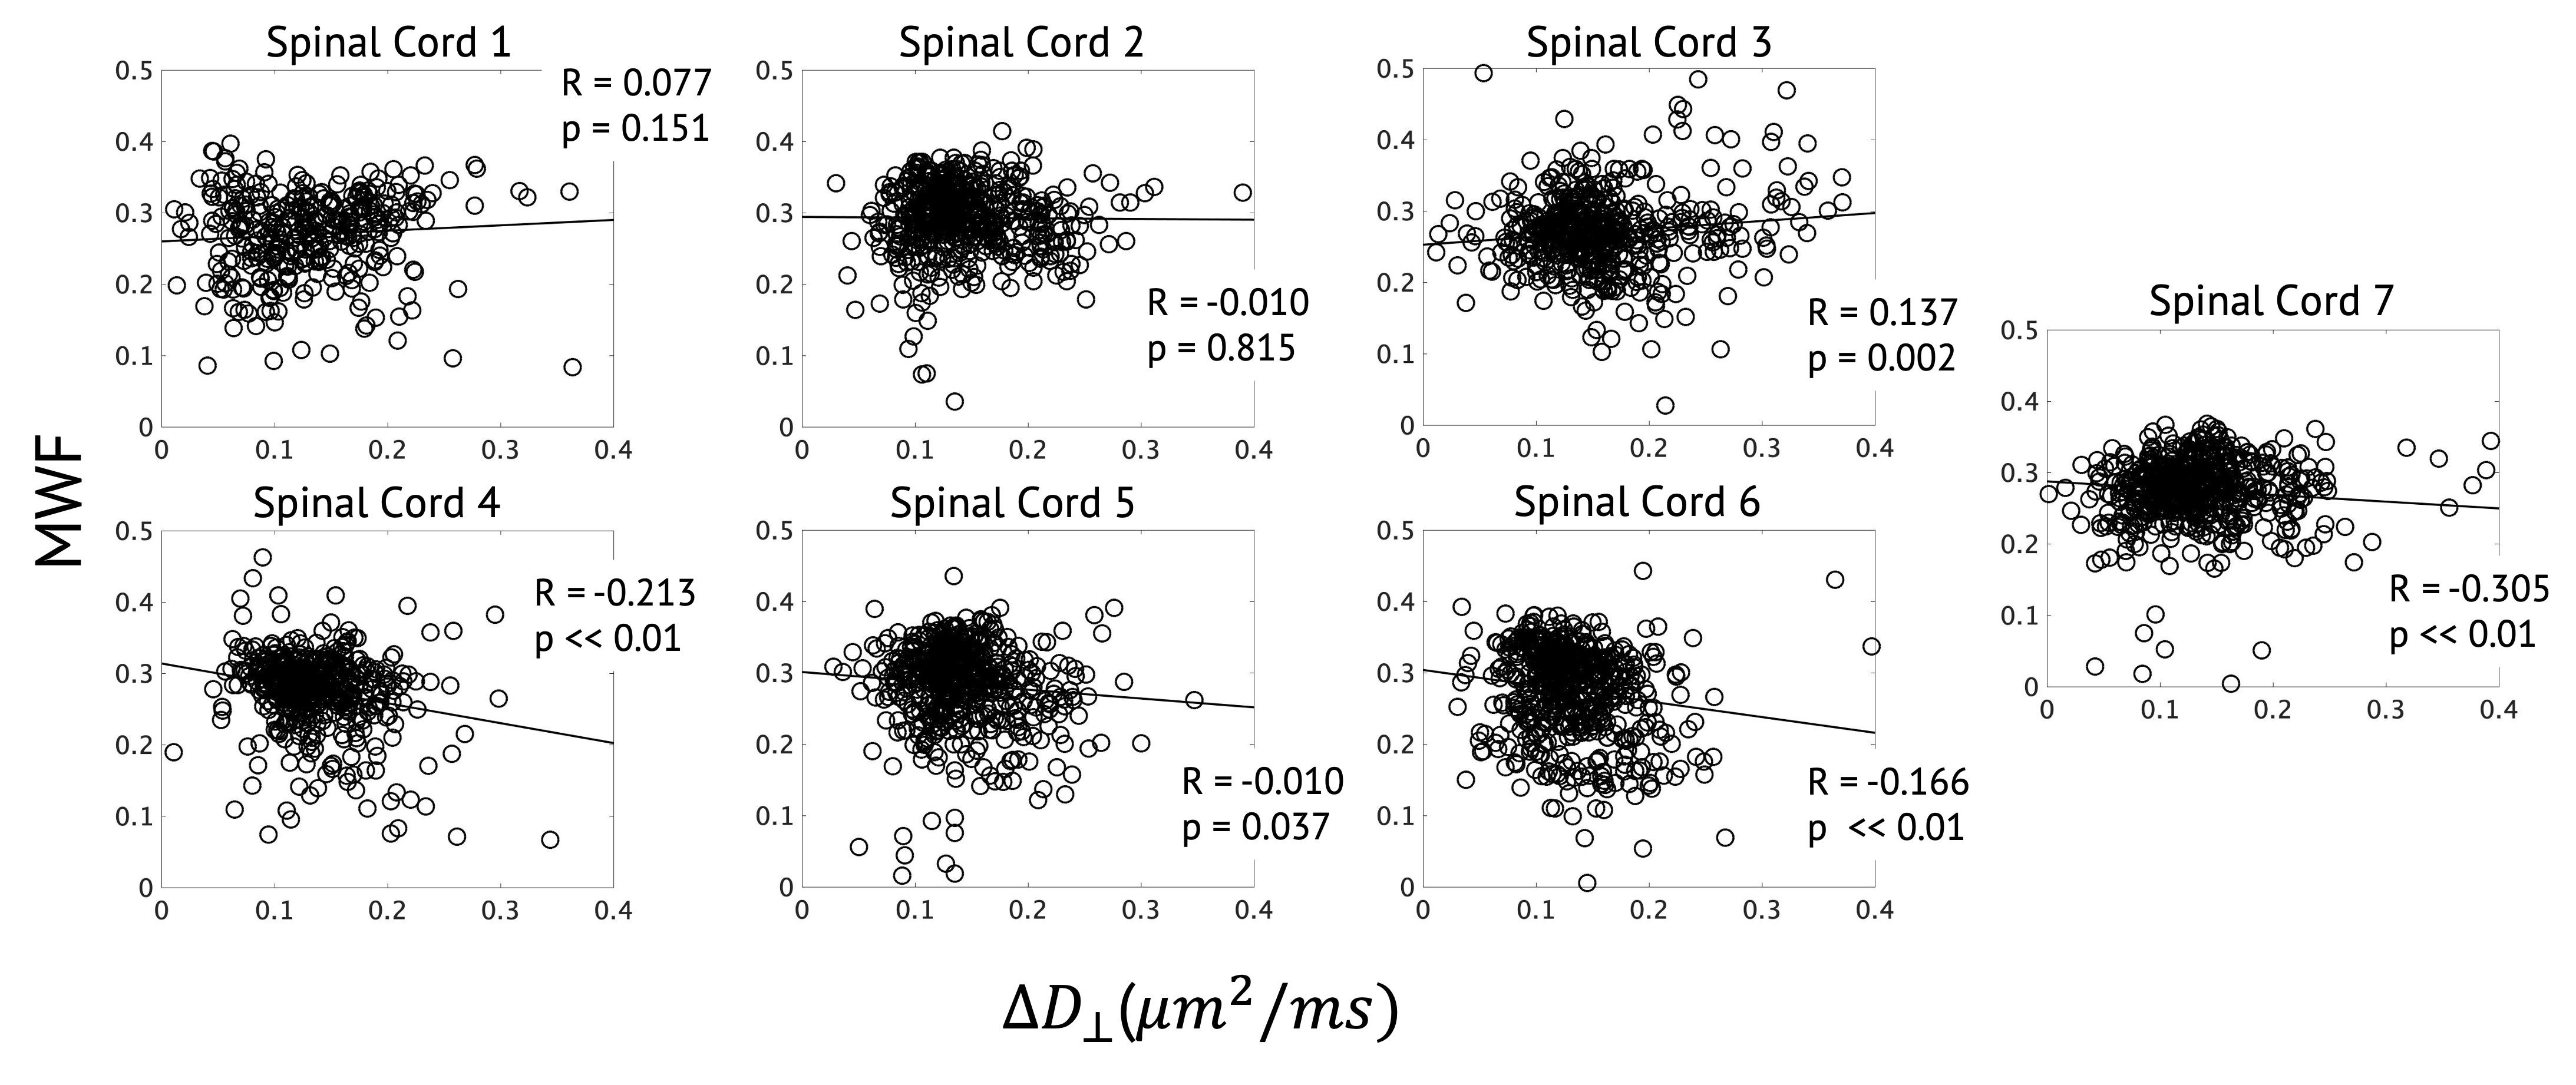
Figure 2: Plots showing the relationship between MWF and ΔD⊥ for each SC. Linear correlations are considered significant for p < 0.002, with the applied Bonferroni correction.
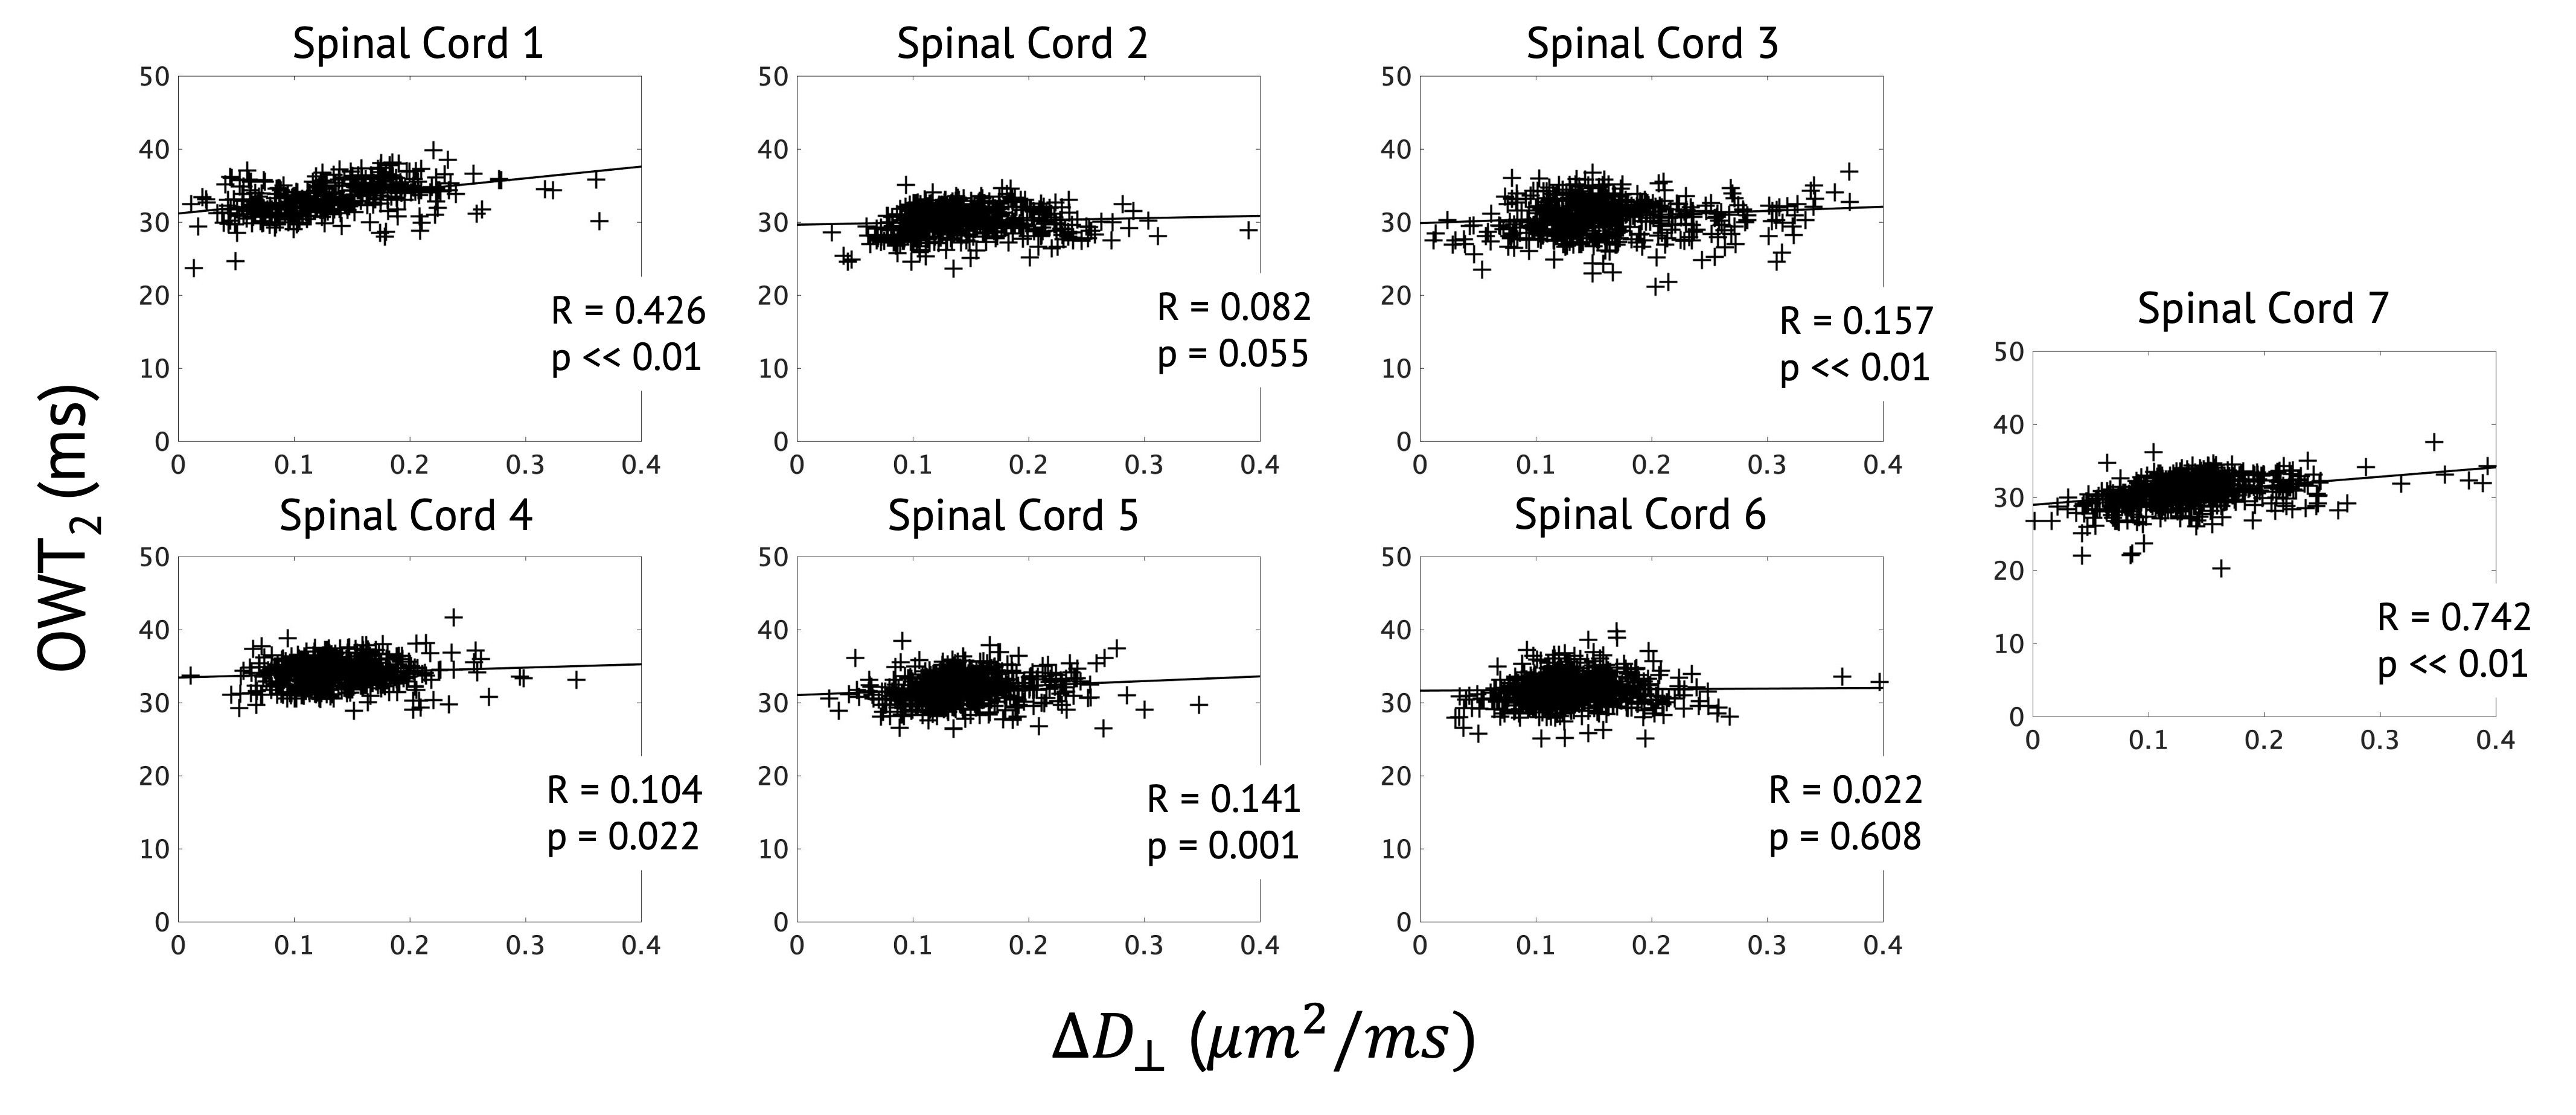
Figure 3: Plots showing the relationship between OWT2 and ΔD⊥ for each SC. Linear correlations are considered significant for p < 0.002, with the applied Bonferroni correction.
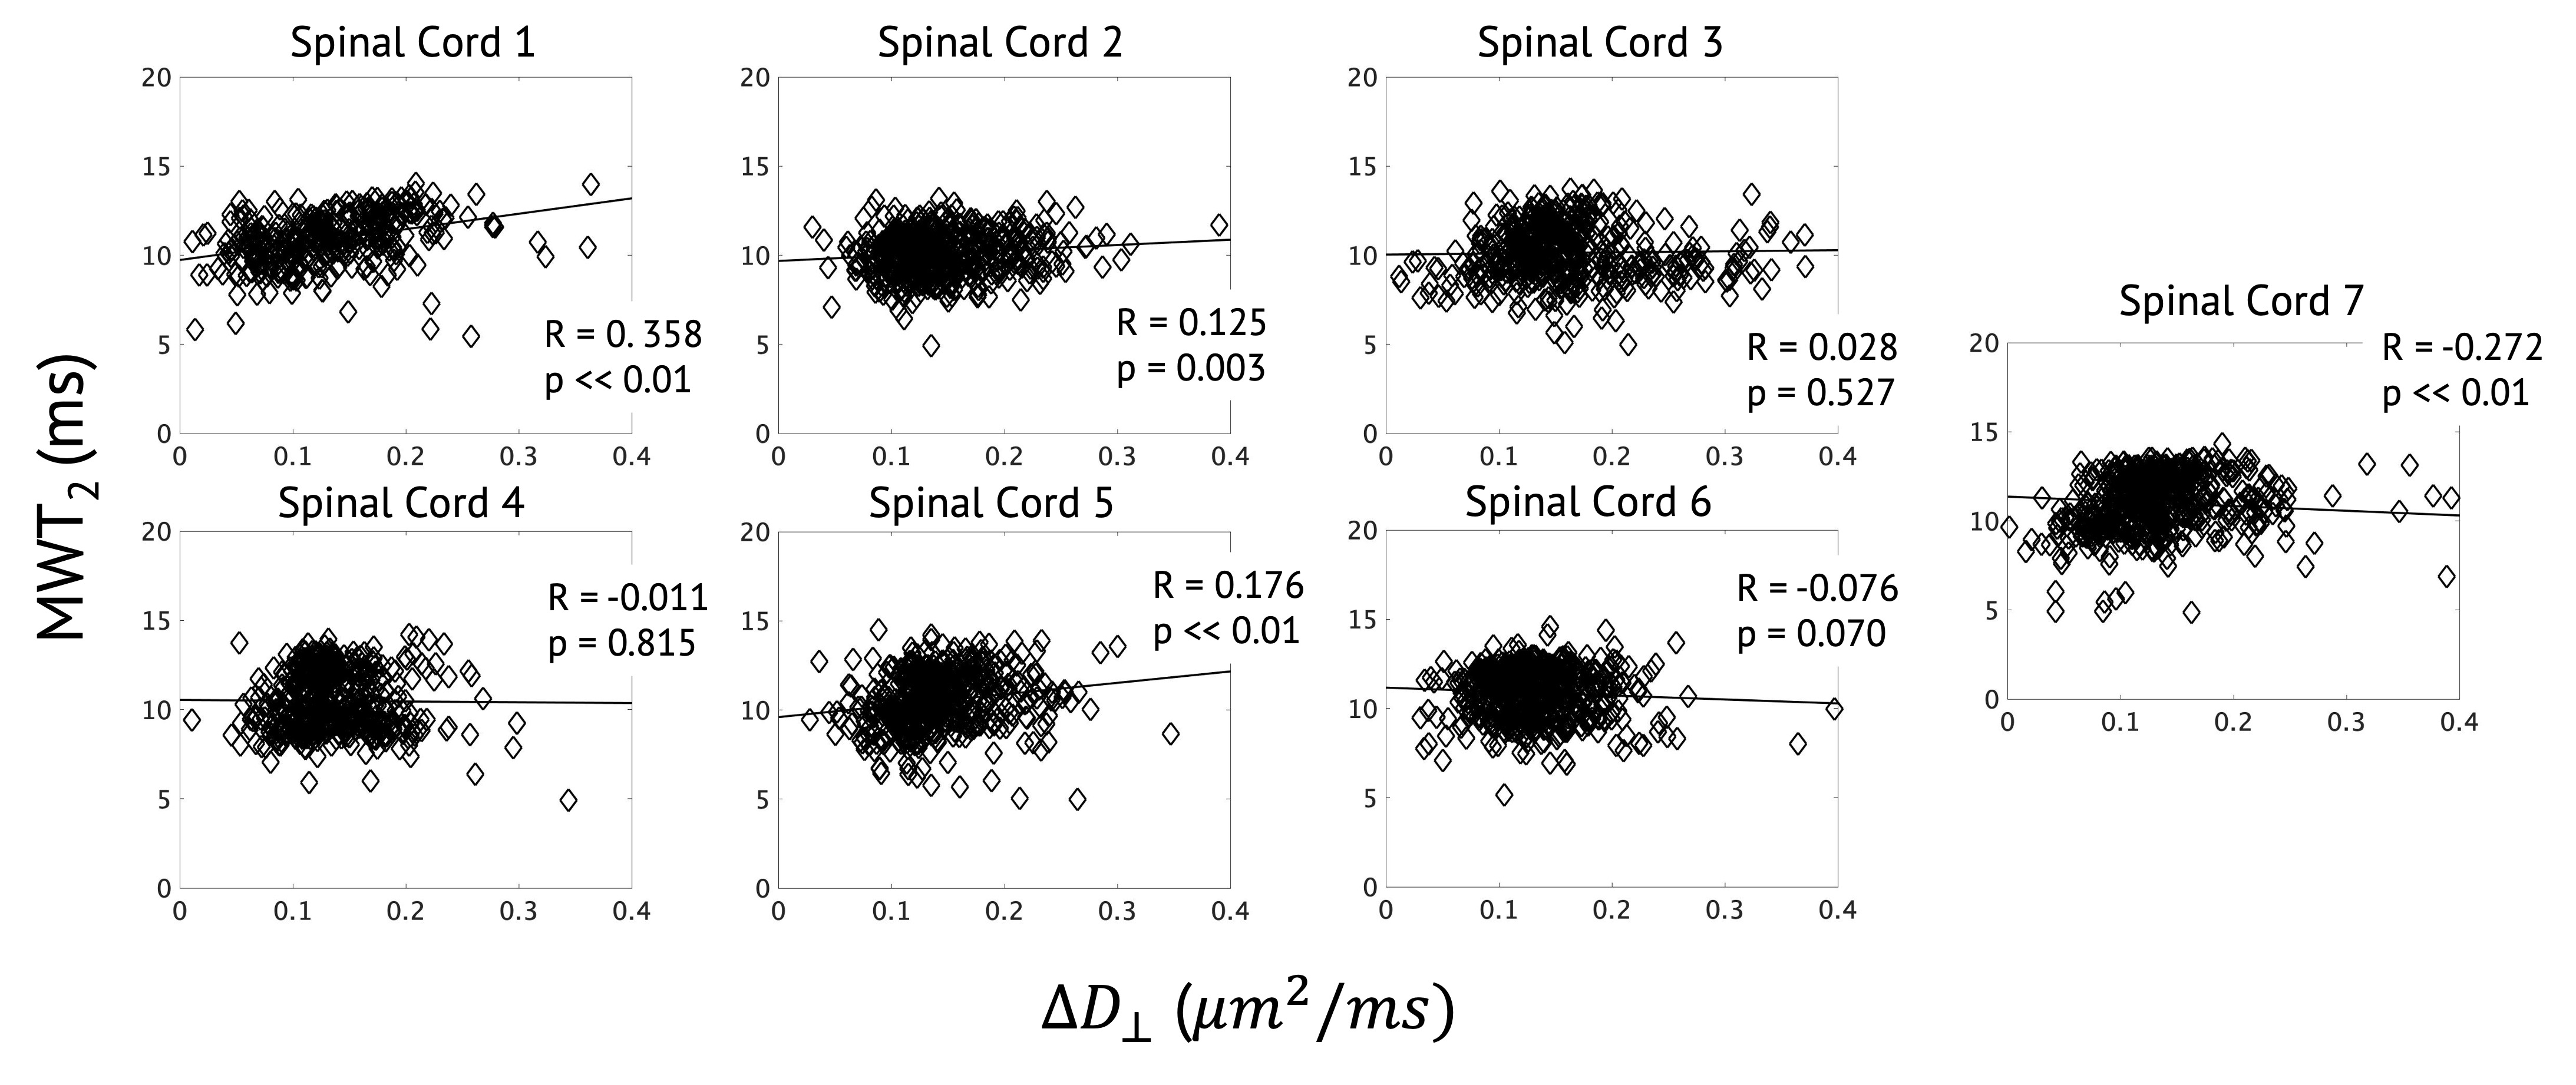
Figure 4: Plots showing the relationship between MWT2 and ΔD⊥ for each SC. Linear correlations are considered significant for p < 0.002, with the applied Bonferroni correction.