2179
Improving in-vivo myelin and iron mapping from relaxation rates maps by incorporating relaxation rate changes from in-vivo to ex-vivo conditions1Institut für Systemischeneurowissenschaften, Universitätsklinikum Hamburg-Eppendorf, Hamburg, Germany, 2Rechtsmedizin, Universitätsklinikum Hamburg-Eppendorf, Hamburg, Germany, 3Department of Neurophysics, Max Planck Institute for Human Cognitive and Brain Sciences, Leipzig, Germany, 4Paul Flechsig Institute – Center for Neuropathology and Brain Research, University of Leipzig, Leipzig, Germany, 5Felix Bloch Institute for Solid State Physics, Faculty of Physics and Earth Sciences, University of Leipzig, Leipzig, Germany, 6Wellcome Centre for Human Neuroimaging, Institute of Neurology, University College London, London, United Kingdom, 7Max Planck Research Group MR Physics, Max Planck Institute for Human Development, Berlin, Germany
Synopsis
Keywords: Relaxometry, Validation, Histology, Myelin, Iron, In vivo vs ex vivo, Fixation
Motivation: Estimating myelin and iron concentration maps from in-vivo MRI yields biased estimates because MR-to-microstructure linear mappings are derived from fixed-postmortem human brain tissue.
Goal(s): We assessed whether taking into account the changes of relaxation rates from in-vivo to hydrated fixed ex-vivo specimens would allow the use of current MR-to-microstructure linear mappings for in-vivo MRI.
Approach: We introduced a pipeline that accounts for the major relaxation-rate changes during fixation and hydration, and compared the estimated MRI-based myelin parameters to their counterparts from light microscopy in the human corpus callosum.
Results: We found that including these changes significantly improved the accuracy of the myelin estimates.
Impact: We proposed a new method that significantly improves the MRI-based myelin and iron maps estimation from in-vivo longitudinal and effective transverse relaxation rates.
Introduction
Linear mapping between ex-vivo MRI and quantitative histology has been used to estimate iron and myelin maps from longitudinal (R1) and effective transverse (R2*) relaxation rates on formalin-fixed human brain tissue samples2,3. However, to apply the linear mapping for in-vivo MRI the change of relaxation rates across tissue states need to be considered. These changes are mainly caused by excision, fixation with paraformaldehyde (PFA) and hydration4,5,6. This study aims to improve in-vivo MR relaxometry-based myelin and iron mapping accuracy using two recently published linear models2,3 and to validate the method by comparison to light-microscopy-(LM)-based myelin estimates in the human corpus callosum. For that, we propose a pipeline that projects in-vivo relaxation rates into their ex-vivo counterparts using a heuristic model determined from a longitudinal ex-vivo MRI study presented here in another ISMRM abstract8.Methods
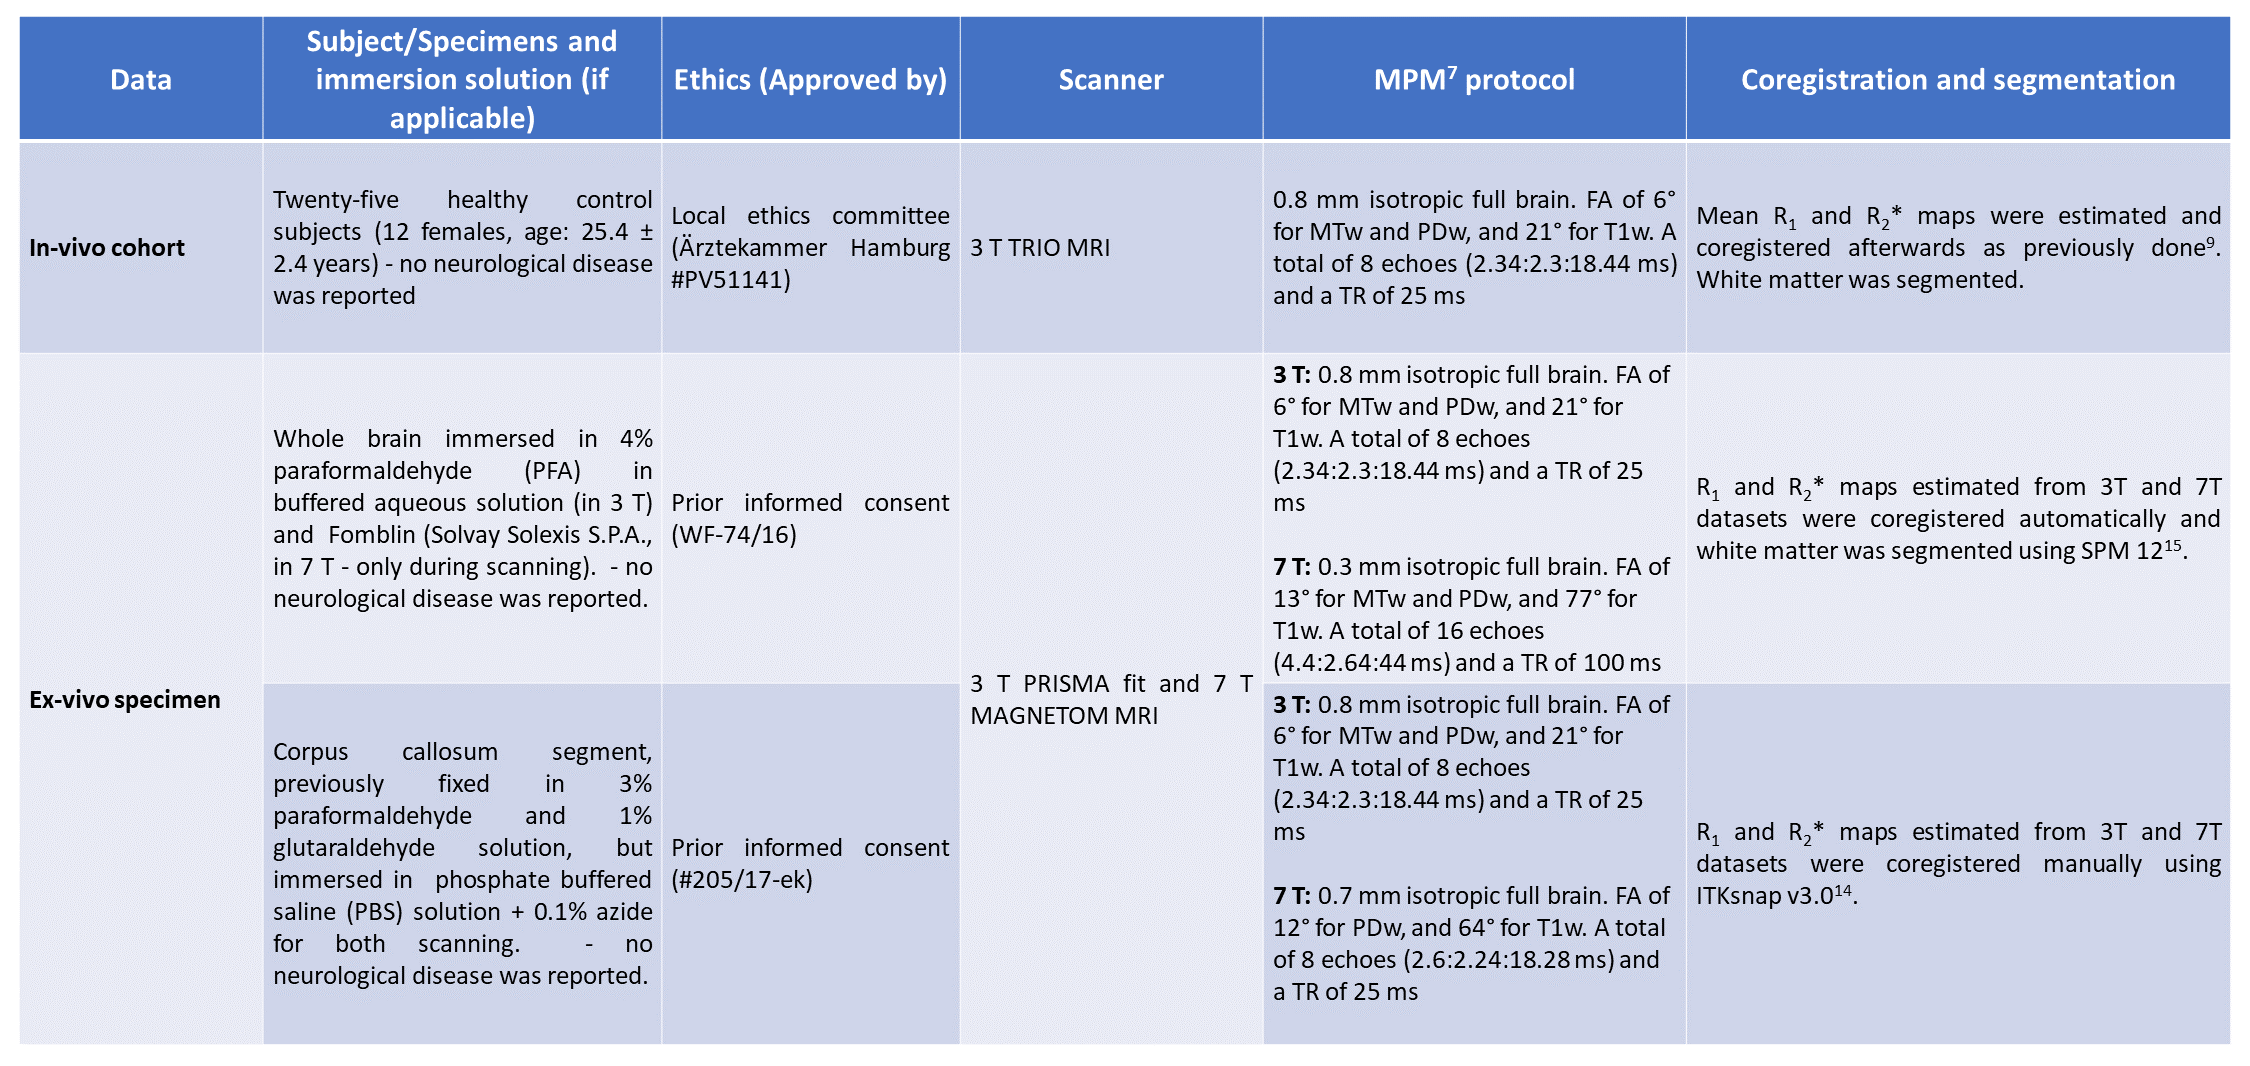
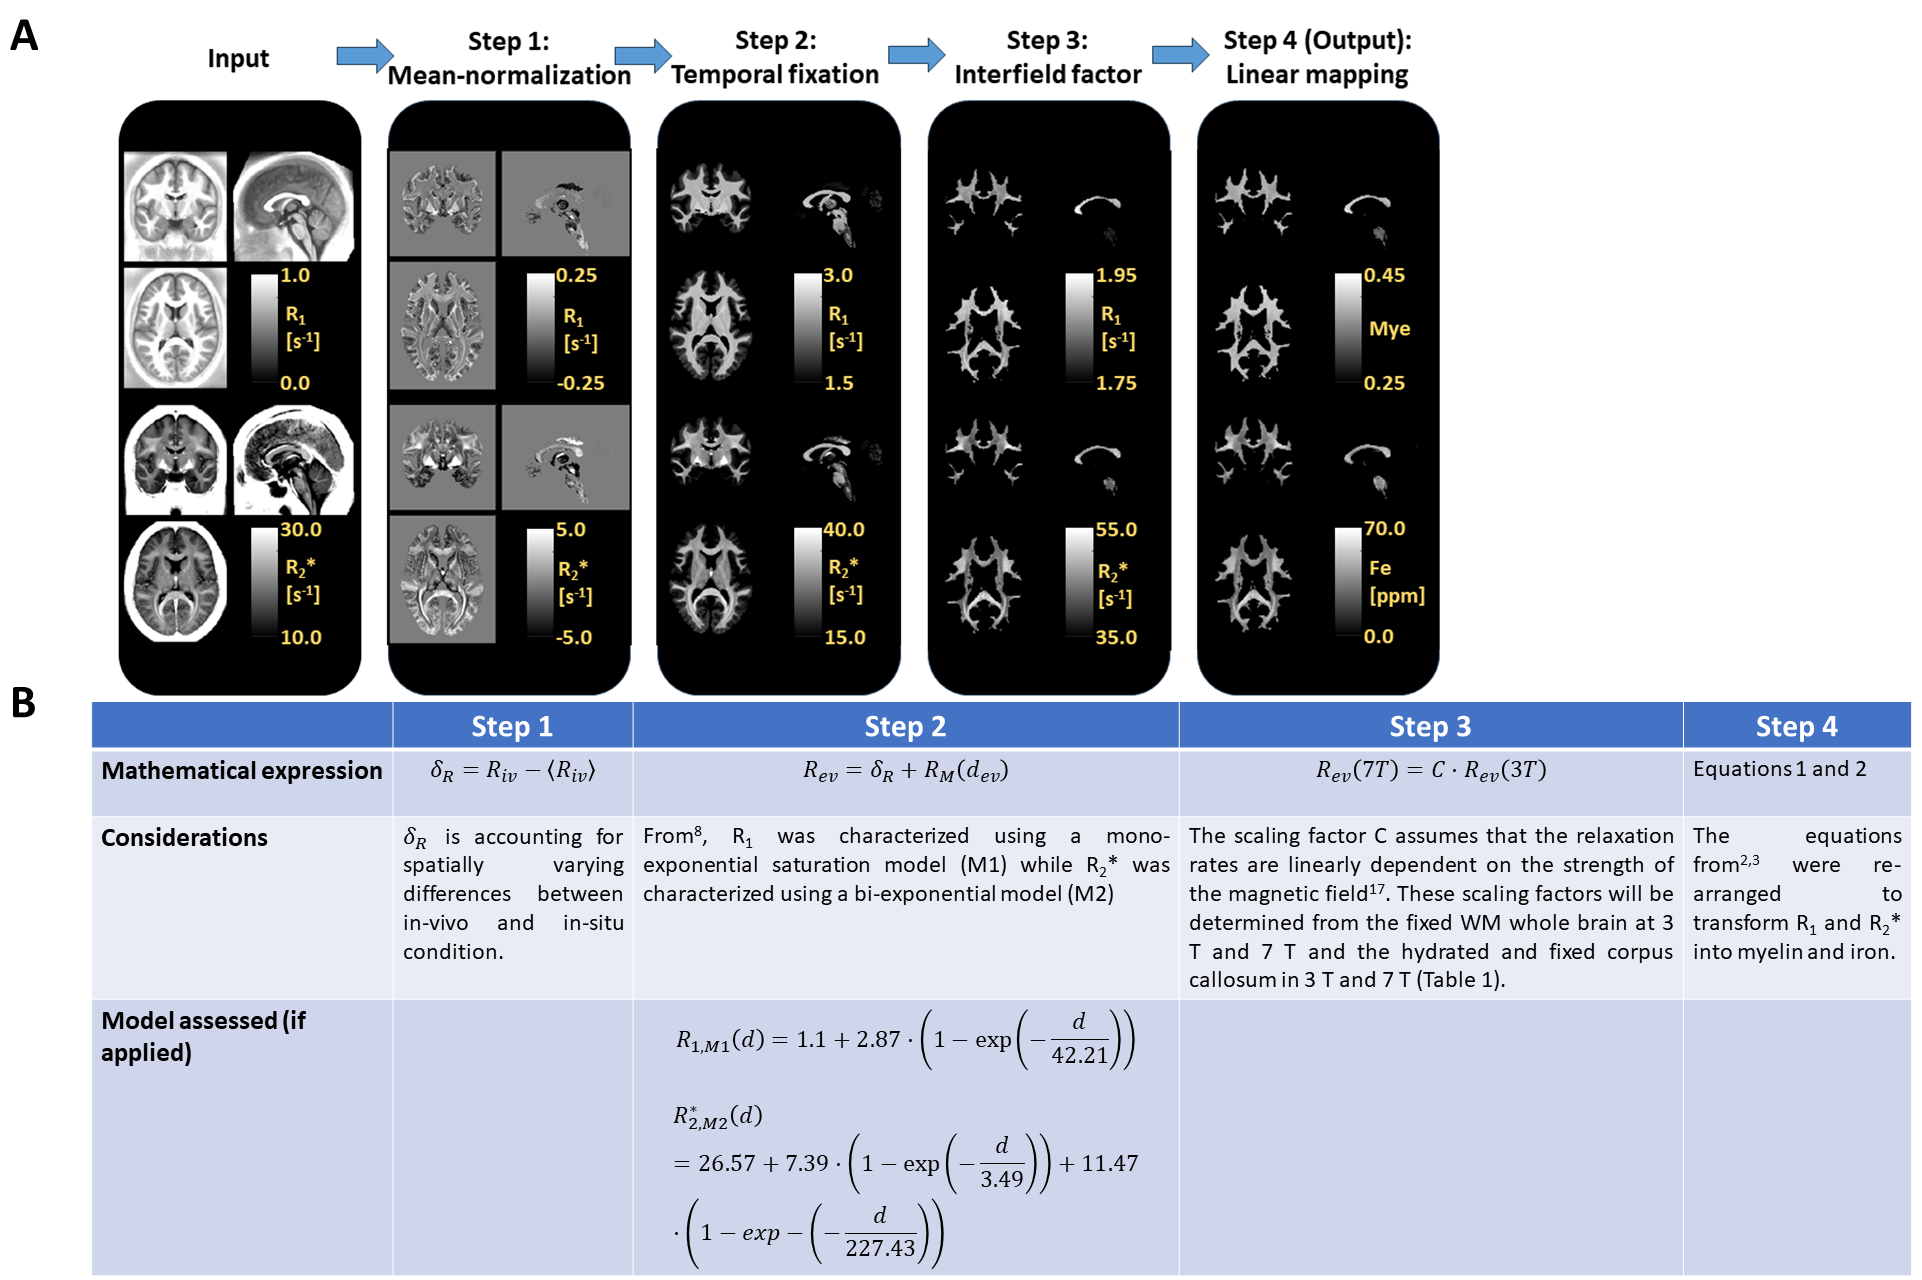
Information about the in-vivo cohort and ex-vivo specimens used in this work are detailed in Table 1. All subjects and specimens were scanned using the multi-parametric mapping (MPM7) protocol. For this protocol, R1 and R2* maps were estimated using the hMRI toolbox10 integrated in SPM1215-Matlab11. Further details regarding acquisition, coregistration and segmentation are given in Table 1.Pipeline: For this purpose, we defined a four-step pipeline defined:
Step 1 (in-vivo to in-situ): The residual relaxation rate difference ($$$\delta_R$$$) is defined as the in-vivo relaxation rate (Riv) subtracted by the WM-mean relaxation rate (<Riv>).
Step 2 (in-situ to fixed tissue): The fixed ex-vivo tissue state at day dev (Rev) is defined by the saturation model (RM(d = dev)) per relaxation rate8 corrected by $$$\delta_R$$$.
Step 3 (fixed tissue from 3T to 7T): Correcting Rev by a scaling factor C for the fact that fixation effects were assessed at 3T MR system (Rev(3T)) whereas MR-to-microstructure linear mapping was determined at 7T MR system (Rev(7T)).
Step 4 (7T fixed tissue to microstructure): Conversion of Rev(7T) to myelin volume fraction (Mye) and iron concentration (Fe) maps using either the linear mappings in Equation 1 defined as the "only-Stüber" model3
$$Mye = 1.108(R_1(7T) - 1.132) - 0.00047(R^*_2(7T) - 45.9) - 0.351 \\
Fe = -813.25(R_1(7T) - 1.132) + 22.46(R^*_2(7T) - 45.9)$$
or Equation 2 defined as Stüber-Kirilina model2:
$$Mye = 0.606(R_1(7T) - 1.132) - 0.0019(R^*_2(7T) - 13.7) - 0.0213 \\
Fe = -81.37(R_1(7T) - 1.132) - 3.116(R^*_2(7T) - 13.7)$$
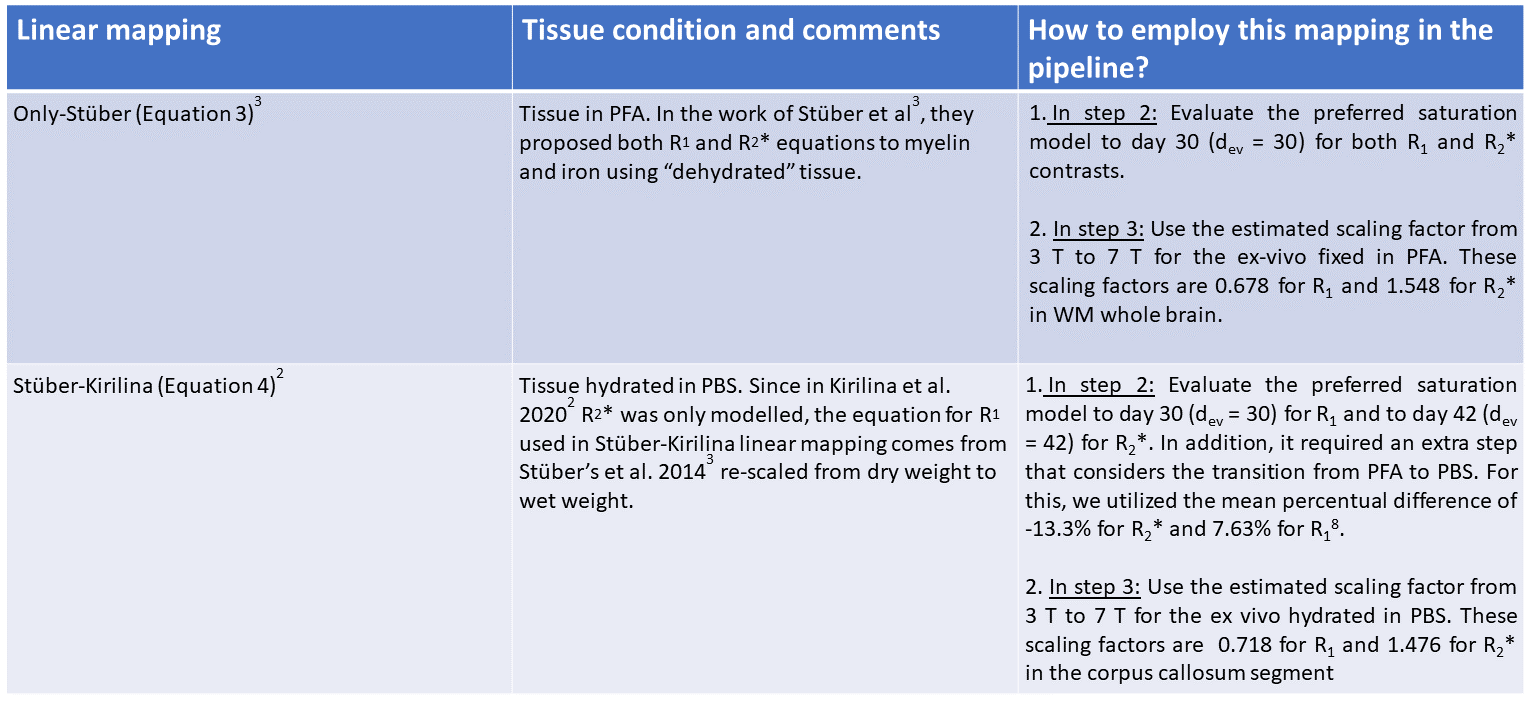
Find more details about these Equations in Table 2.
In this work, we added another offset value solely for myelin estimation to account for two main differences observed in both linear mappings2,3: the myelin white matter used for calibration (Mye=0.5 instead of Mye=0.28 in Table 3A) and variation in MR techniques used to estimate R1 and R2*18.
A detailed description for each step is given in Table of Figure 1. Both models were employed to estimate Mye and Fe in WM as specified in Table 2. For comparison, both linear models were employed directly on the in-vivo MPM maps.
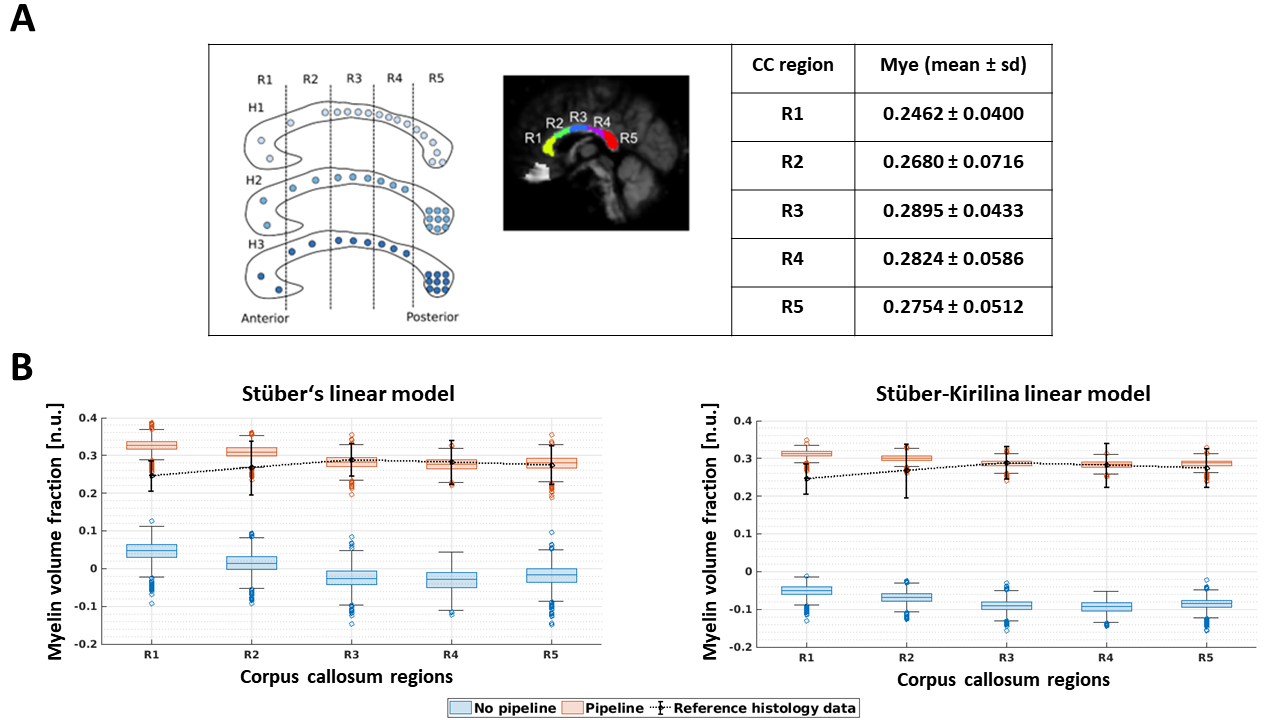
Histological gold standard: For histological validation of myelin, we acquired 56 light microscopy sections across three human corpus callosum specimens (Figure 3A). We estimated myelin as in19.
We compared the mean myelin values for five corpus callosum regions (see Table in Figure 3A) to the estimated Mye values derived from the in-vivo cohort with and without using the proposed pipeline. From this comparison, the normalised-root-mean-square error was estimated, using the histological mean of the Mye as the normalisation factor (= 0.2723).
Results and discussion
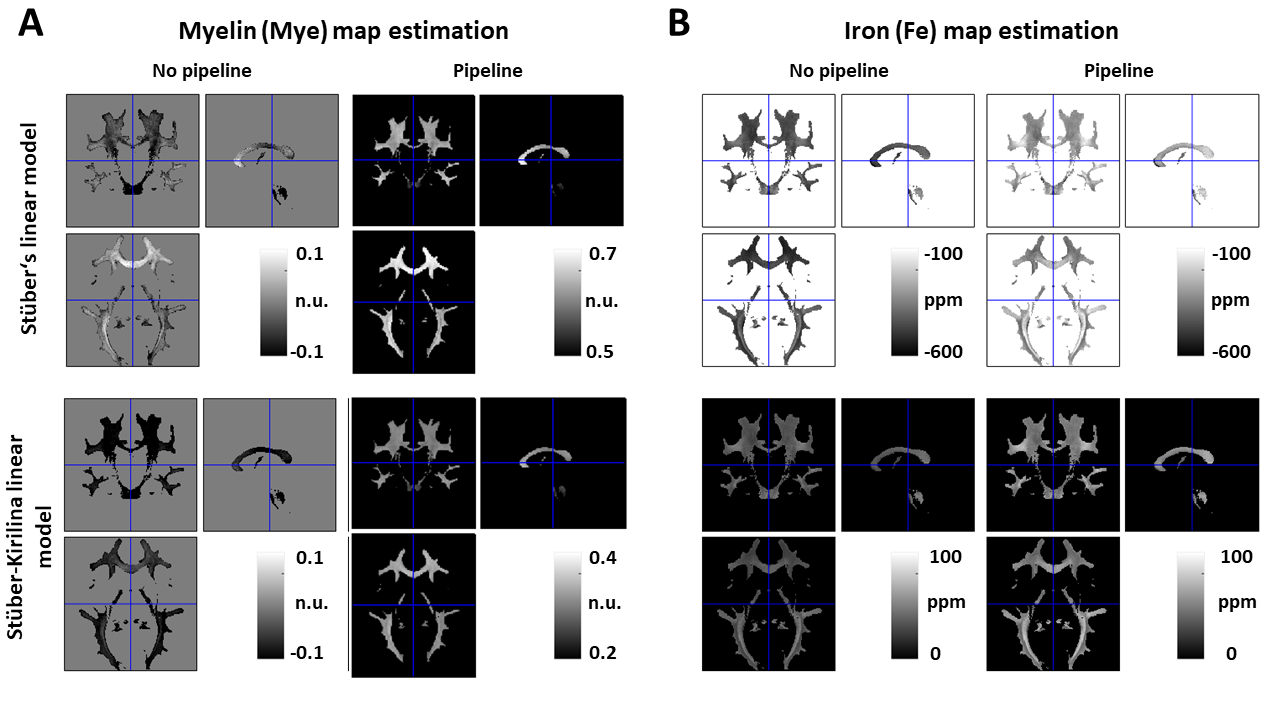
Our results show that modelling the effect of fixation and hydration strongly affects the myelin estimates (Figure 2A), whereas the iron estimates were mostly unaffected by the proposed pipeline (Figure 2B). Interestingly, the iron estimates strongly depended on the linear model that was determined from comparing quantitative histology against the relaxation rates using formalin-fixed postmortem human samples: the Stüber-Kirilina model delivered positive iron concentration parameters whereas the only-Stüber model delivered negative, which is unrealistic20,21.Comparison against gold standard, myelin estimates from LM (Figure 3A) revealed that our proposed pipeline had an accuracy of 19.9% to 30.4%, whereas neglecting the effect of fixation and hydration resulted in a large bias (102.0% to 129.0%). However, a spatial-dependence discrepancy between MR-myelin and LM-myelin across sections was observed (Figure 3B).
Conclusion
In this study, we improved myelin and iron mapping from in-vivo relaxation rates by incorporating the changes of the relaxation rates from in-vivo to ex-vivo prior to iron/myelin estimation. We found that accounting for the effect of fixation was particularly important to estimate the myelin maps accurately, but not for the iron maps. The proposed mapping could also be used to generalize machine learning methods that originally were trained on ex-vivo data for in-vivo applications.Acknowledgements
This work was supported by the German Research Foundation (DFG Priority Program 2041 "Computational Connectomics”, [MO 2397/5-1; MO 2249/3–1; KI 13372-2; WE 5046/4-2; MO 2397/5-2; MO 2249/3], by the Emmy Noether Stipend: MO 2397/4-1 and MO 2397/4-2) and by the BMBF (01EW1711A and B) in the framework of ERA-NET NEURON and the Forschungszentrums Medizintechnik Hamburg (fmthh; grant 01fmthh2017). The research leading to these results has received funding from the European Research Council under the European Union's Seventh Framework Programme (FP7/2007-2013) / ERC grant agreement n° 616905.References
[1] Eriksson, S.H., Free, S.L., Thom, M., Martinian, L., Symms, M.R., Salmenpera, T.M., McEvoy, A.W., Harkness, W., Duncan, J.S., Sisodiya, S.M., 2007. Correlation of quantitative MRI and neuropathology in epilepsy surgical resection specimens—T2 correlates with neuronal tissue in gray matter. NeuroImage 37, 48–55. https://doi.org/10.1016/j.neuroimage.2007.04.051
[2] Kirilina, E., Helbling, S., Morawski, M., Pine, K., Reimann, K., Jankuhn, S., Dinse, J., Deistung, A., Reichenbach, J.R., Trampel, R., Geyer, S., Müller, L., Jakubowski, N., Arendt, T., Bazin, P.-L., Weiskopf, N., 2020. Superficial white matter imaging: Contrast mechanisms and whole-brain in vivo mapping. Science Advances 6, eaaz9281. https://doi.org/10.1126/sciadv.aaz9281
[3] Stüber, C., Morawski, M., Schäfer, A., Labadie, C., Wähnert, M., Leuze, C., Streicher, M., Barapatre, N., Reimann, K., Geyer, S., Spemann, D., Turner, R., 2014. Myelin and iron concentration in the human brain: A quantitative study of MRI contrast. NeuroImage 93, 95–106. https://doi.org/10.1016/j.neuroimage.2014.02.026
[4] Shatil, A.S., Uddin, M.N., Matsuda, K.M., Figley, C.R., 2018. Quantitative Ex Vivo MRI Changes due to Progressive Formalin Fixation in Whole Human Brain Specimens: Longitudinal Characterization of Diffusion, Relaxometry, and Myelin Water Fraction Measurements at 3T. Frontiers in Medicine 5.
[5] Shepherd, Timothy M., Thelwall, P.E., Stanisz, G.J., Blackband, S.J., 2009. Aldehyde fixative solutions alter the water relaxation and diffusion properties of nervous tissue. Magnetic Resonance in Medicine 62.
[6] F. Fritz; J. M. Oeschger; O. Ohana; T. Sauvigny; S. Mohammadi. 2023. Diffusion and relaxometry study of an excised temporal lobe from a drug-resistance epilepsy patient using in vivo and ex vivo MRI. Proc. Intl. Soc. Mag. Reson. Med. 31.
[7] Weiskopf, N., Suckling, J., Williams, G., Correia, M.M., Inkster, B., Tait, R., Ooi, C., Bullmore, E.T., Lutti, A., 2013. Quantitative multi-parameter mapping of R1, PD(*), MT, and R2(*) at 3T: a multi-center validation. Front Neurosci 7, 95.
[8] Streubel, T; Ashtarayeh, M; Mushumba, H.; Papazoglou, S.; Püschel, K.; Mohammadi, S.; 2019. Longitudinal assessment of relaxation and magnetization transfer saturation rates during formalin fixation across fiber pathways of the human brai. Proc. Intl. Soc. Mag. Reson. Med. 27.
[9] Emmenegger, T.M., David, G., Ashtarayeh, M., Fritz, F.J., Ellerbrock, I., Helms, G., Balteau, E., Freund, P., Mohammadi, S., 2021. The Influence of Radio-Frequency Transmit Field Inhomogeneities on the Accuracy of G-ratio Weighted Imaging. Frontiers in Neuroscience 15, 770. https://doi.org/10.3389/fnins.2021.674719
[10] Tabelow, K., Balteau, E., Ashburner, J., Callaghan, M.F., Draganski, B., Helms, G., Kherif, F., Leutritz, T., Lutti, A., Phillips, C., Reimer, E., Ruthotto, L., Seif, M., Weiskopf, N., Ziegler, G., Mohammadi, S., 2019. hMRI – A toolbox for quantitative MRI in neuroscience and clinical research. NeuroImage 194, 191–210. https://doi.org/10.1016/j.neuroimage.2019.01.029
[11] MATLAB. (2021). 9.11.0.1837725 (R2021b) Update 2. Natick, Massachusetts: The MathWorks Inc
[12] Thavarajah, R., Mudimbaimannar, V.K., Elizabeth, J., Rao, U.K., Ranganathan, K., 2012a. Chemical and physical basics of routine formaldehyde fixation. J Oral Maxillofac Pathol 16, 400–405. https://doi.org/10.4103/0973-029X.102496
[13] Ghosh, J.K., Delampady, M., Samanta, T., 2007. An Introduction to Bayesian Analysis: Theory and Methods, Springer Texts in Statistics. Springer New York.
[14] Paul A. Yushkevich, Joseph Piven, Heather Cody Hazlett, Rachel Gimpel Smith, Sean Ho, James C. Gee, and Guido Gerig. User-guided 3D active contour segmentation of anatomical structures: Significantly improved efficiency and reliability. Neuroimage 2006 Jul 1;31(3):1116-28.
[15] Friston, K., 2007. CHAPTER 2 - Statistical parametric mapping, in: FRISTON, K., ASHBURNER, J., KIEBEL, S., NICHOLS, T., PENNY, W. (Eds.), Statistical Parametric Mapping. Academic Press, London, pp. 10–31. doi: 10.1016/B978-012372560-8/50002-4
[16] Fritz, F.; Streubel, T; Mushumba, H.; Püschel, K.; Mohammadi, S.; 2024. A mathematical description of quantitative MRI parameter changes across ex-vivo whole-brain human brains during fixation in formaldehyde and hydration using multi parameter mapping (MPM). Proc. Intl. Soc. Mag. Reson. Med. 32 [SUBMITTED].
[17] Wang Y, van Gelderen P, de Zwart JA, Duyn JH. B0-field dependence of MRI T1 relaxation in human brain. Neuroimage. 2020 Jun;213:116700. doi: 10.1016/j.neuroimage.2020.116700. Epub 2020 Mar 5. PMID: 32145438; PMCID: PMC7165058.
[18] P Tsialios et al 2017 J. Phys.: Conf. Ser. 931 012038
[19] Mordhorst, L.; Morozova, M.; Papazoglou, S.; Fricke, B.; Oeschger, J. M.; Tabarin, T.; Rusch, H.; Jäger, C.; Geyer, S.; Weiskopf, N.; Morawski, M.; Mohammadi, S.; 2022. Towards a representative reference for MRI-based human axon radius assessment using light microscopy. Neuroimage, 249.
[20] HALLGREN B, SOURANDER P. The effect of age on the non-haemin iron in the human brain. J Neurochem. 1958 Oct;3(1):41-51. doi: 10.1111/j.1471-4159.1958.tb12607.x. PMID: 13611557.
[21] MacKay, A.; Laule, C.; Vavasour, I.; Bjarnason, T.; Kolind, S.; Mädler, B.; 2005, Insights into brain microstructure from the T2 distribution, Magn. Res. Med. 24 (4):515-525
[22] S. F. Witelson, “Hand and sex differences in the isthmus and genu of
the human corpus callosum. A postmortem morphological study,” Brain J.
Neurol., vol. 112 ( Pt 3), pp. 799–835, Jun. 1989, doi:
10.1093/brain/112.3.799.
Figures