2178
Discrepancies between Magnetic Resonance Fingerprinting and other T1 and T2 mapping methods are microstructure dependent1Bioengineering, Imperial College London, London, United Kingdom, 2Institute of Cancer Research, London, United Kingdom, 3Department of Imaging, Imperial College Healthcare NHS Trust, London, United Kingdom, 4London Institute of Medical Sciences, Medical Research Council, London, United Kingdom, 5Surgery and Cancer, Imperial College London, London, United Kingdom, 6Precision Imaging Beacon, School of Medicine, University of Nottingham, Nottingham, United Kingdom, 7School of Physics and Astronomy, University of Nottingham, Nottingham, United Kingdom, 8Dept. of Brian Rehabilitation and Repair, UCL Institute of Neurology, London, United Kingdom, 9Research and Collaborations UK, Siemens Healthcare Ltd, Camberley, United Kingdom, 10Computer and Electrical Engineering, Boise State University, Boise, ID, United States, 11Radiotherapy and Imaging, Institute of Cancer Research, London, United Kingdom, 12Centre for Medical Imaging and Computing, UCL, London, United Kingdom, 13University College London Hospitals NHS Foundation Trust, London, United Kingdom
Synopsis
Keywords: Relaxometry, MR Fingerprinting
Motivation: T1 and T2 accuracy in the brain is difficult to assess, since there is no ground truth available.
Goal(s): To investigate how well relaxometry methods agree.
Approach: We compare Magnetic Resonance Fingerprinting (MRF) T1 and T2 mapping with Variable Flip Angle (VFA) T1 mapping and Multi-Echo Spin Echo (T2) mapping in 11 anatomical brain regions for 10 healthy volunteers, and in the relevant spheres of the NIST phantom.
Results: MRF underestimates T1 and T2 in comparison with T1 VFA and T2 MESE in the human brain, especially in myelin-dense areas. Less T1 and no T2 bias is present in the NIST phantom.
Impact: Quantitative T1 and T2 relaxometry techniques are more consistent in the NIST phantom than the human brain. Deviations could be caused by magnetisation transfer, whose impact on T1 and T2 relaxation mechanisms needs further investigation.
Introduction
Magnetic Resonance Fingerprinting (MRF) is a multiparametric quantitative MRI (qMRI) framework with clinically feasible acquisition times. The transient paradigm of MRF sets it apart from other qMRI techniques; the MR signal does not reach a steady state during the acquisition, enabling high efficiency. MRF gives accurate and repeatable T1 and T2 values in the NIST phantom1 whose ground-truth relaxation parameters have been characterised using NMR. In healthy grey and white matter of the brain MRF has been shown to repeatable and in the range of expected values2,3. Standard quantitative T1 inversion recovery or T2 single echo mapping are prohibitively time consuming in vivo. In this work we acquire MRF T1 and T2 maps with reference Variable Flip Angle (VFA) T1 maps and Multi Echo Spin Echo (MESE) T2 maps in the same session for 10 volunteers. We compare differences between MRF and reference mapping techniques in the NIST phantom and in the human brain.Methods
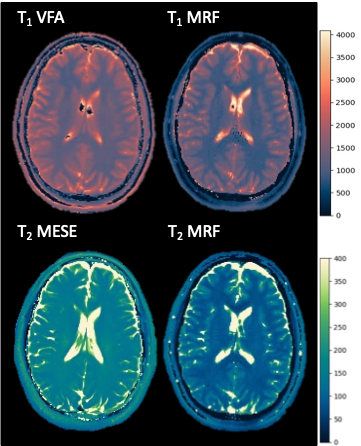
10 healthy volunteers underwent MRI on a 3T MAGNETOM Prisma. The protocol included: 3D MPRAGE (1x1x1mm3), 2D multi-echo spin echo (MESE: TR 3520ms, TE: 24,48,72,96,120,144 and 168ms, 1x1x5mm3 voxels), six 3D VIBE with variable flip angles (TR: 10ms, TE: 1.43ms, FA: 2°,8°,12°,15°,20° and 26°, 1x1x5mm3 voxels), a 2D spiral FISP MRF prototype sequence (1x1x5 mm3 voxels). T1 and T2 maps were produced using MRF and the reference methods1 (Fig.1).Anatomical segmentation was performed on the high resolution MRPAGE in FreeSurfer using the recon-all command4. Segmentation masks were registered to each relaxometry map using a rigid body transformation in FSL5. T1 and T2 relaxation times in 11 brain regions were extracted. MRF data were compared to the reference methods. Results were compared to data from the same protocol in the NIST phantom1.
Results
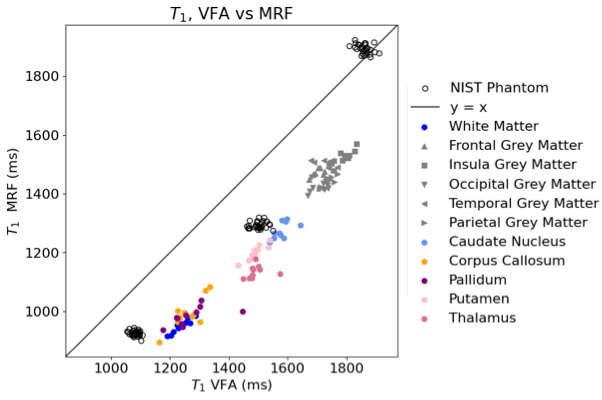
In Fig.1, a difference in contrast is apparent between MRF and reference methods for both T1 and T2, with MRF comparatively underestimating relaxation times.Fig.2 shows the underestimation in T1 by MRF is present in all tissue regions of interest for all volunteers. the bias extent is greater in tissue (~300ms) than in the phantom (0-200ms).Mean T1s for each ROI are consistent across volunteers for either mapping method.
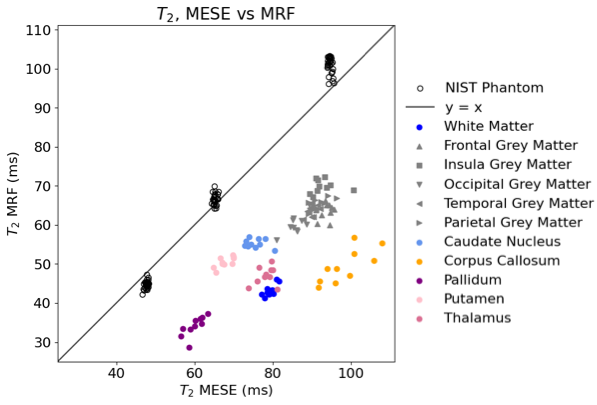
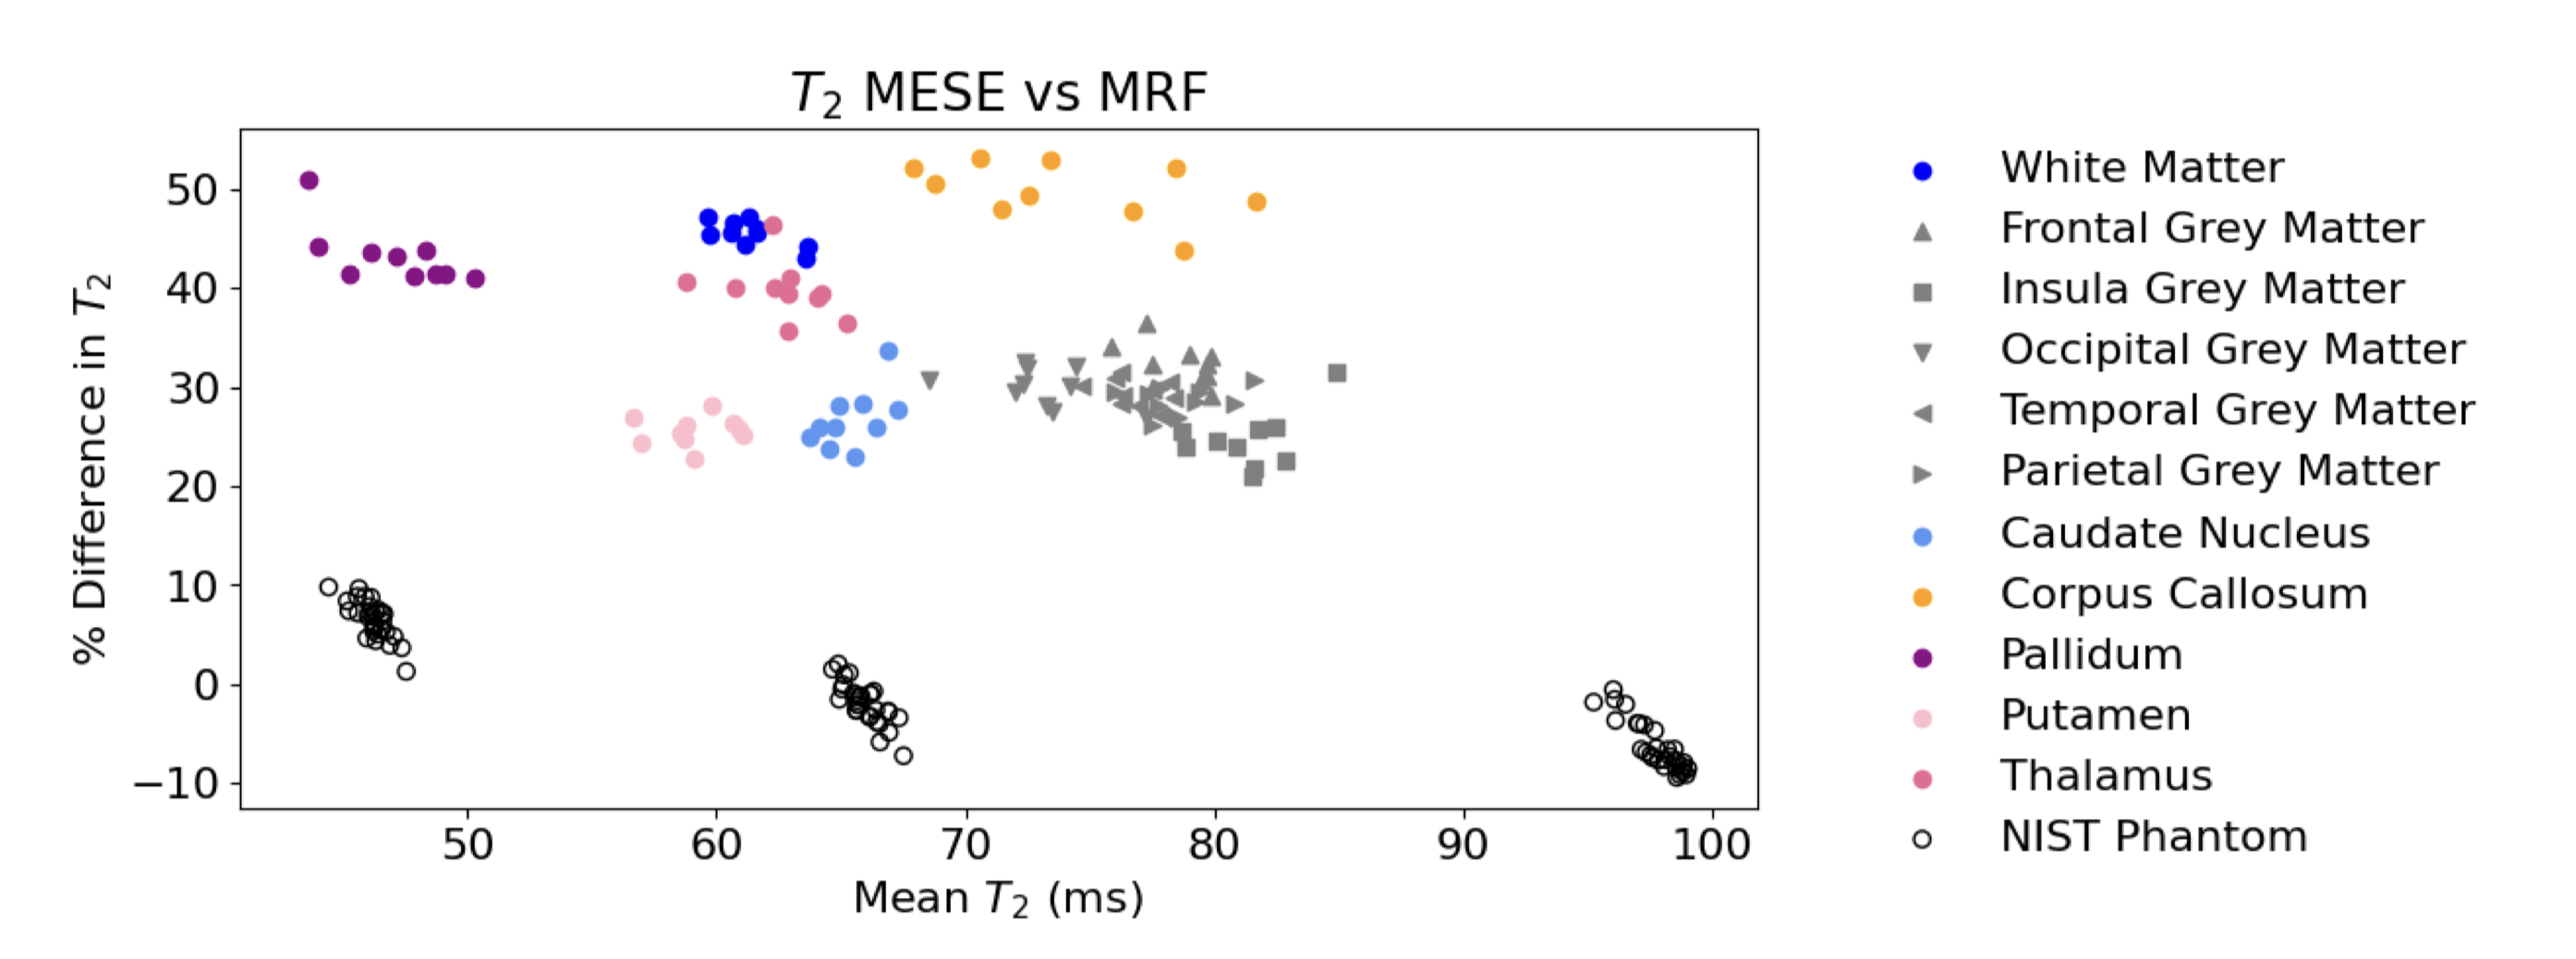
Fig.3 shows a clear clustering behaviour. Almost no bias is shown present between T2 MRF and T2 MESE in 30 repeat investigations of the NIST phantom, whereas MRF underestimates T2 in comparison to MESE in all tissue regions for all volunteers. The T2 relaxation time of each tissue region is consistent between volunteers, but the difference between techniques is up to 50ms in the corpus callosum.
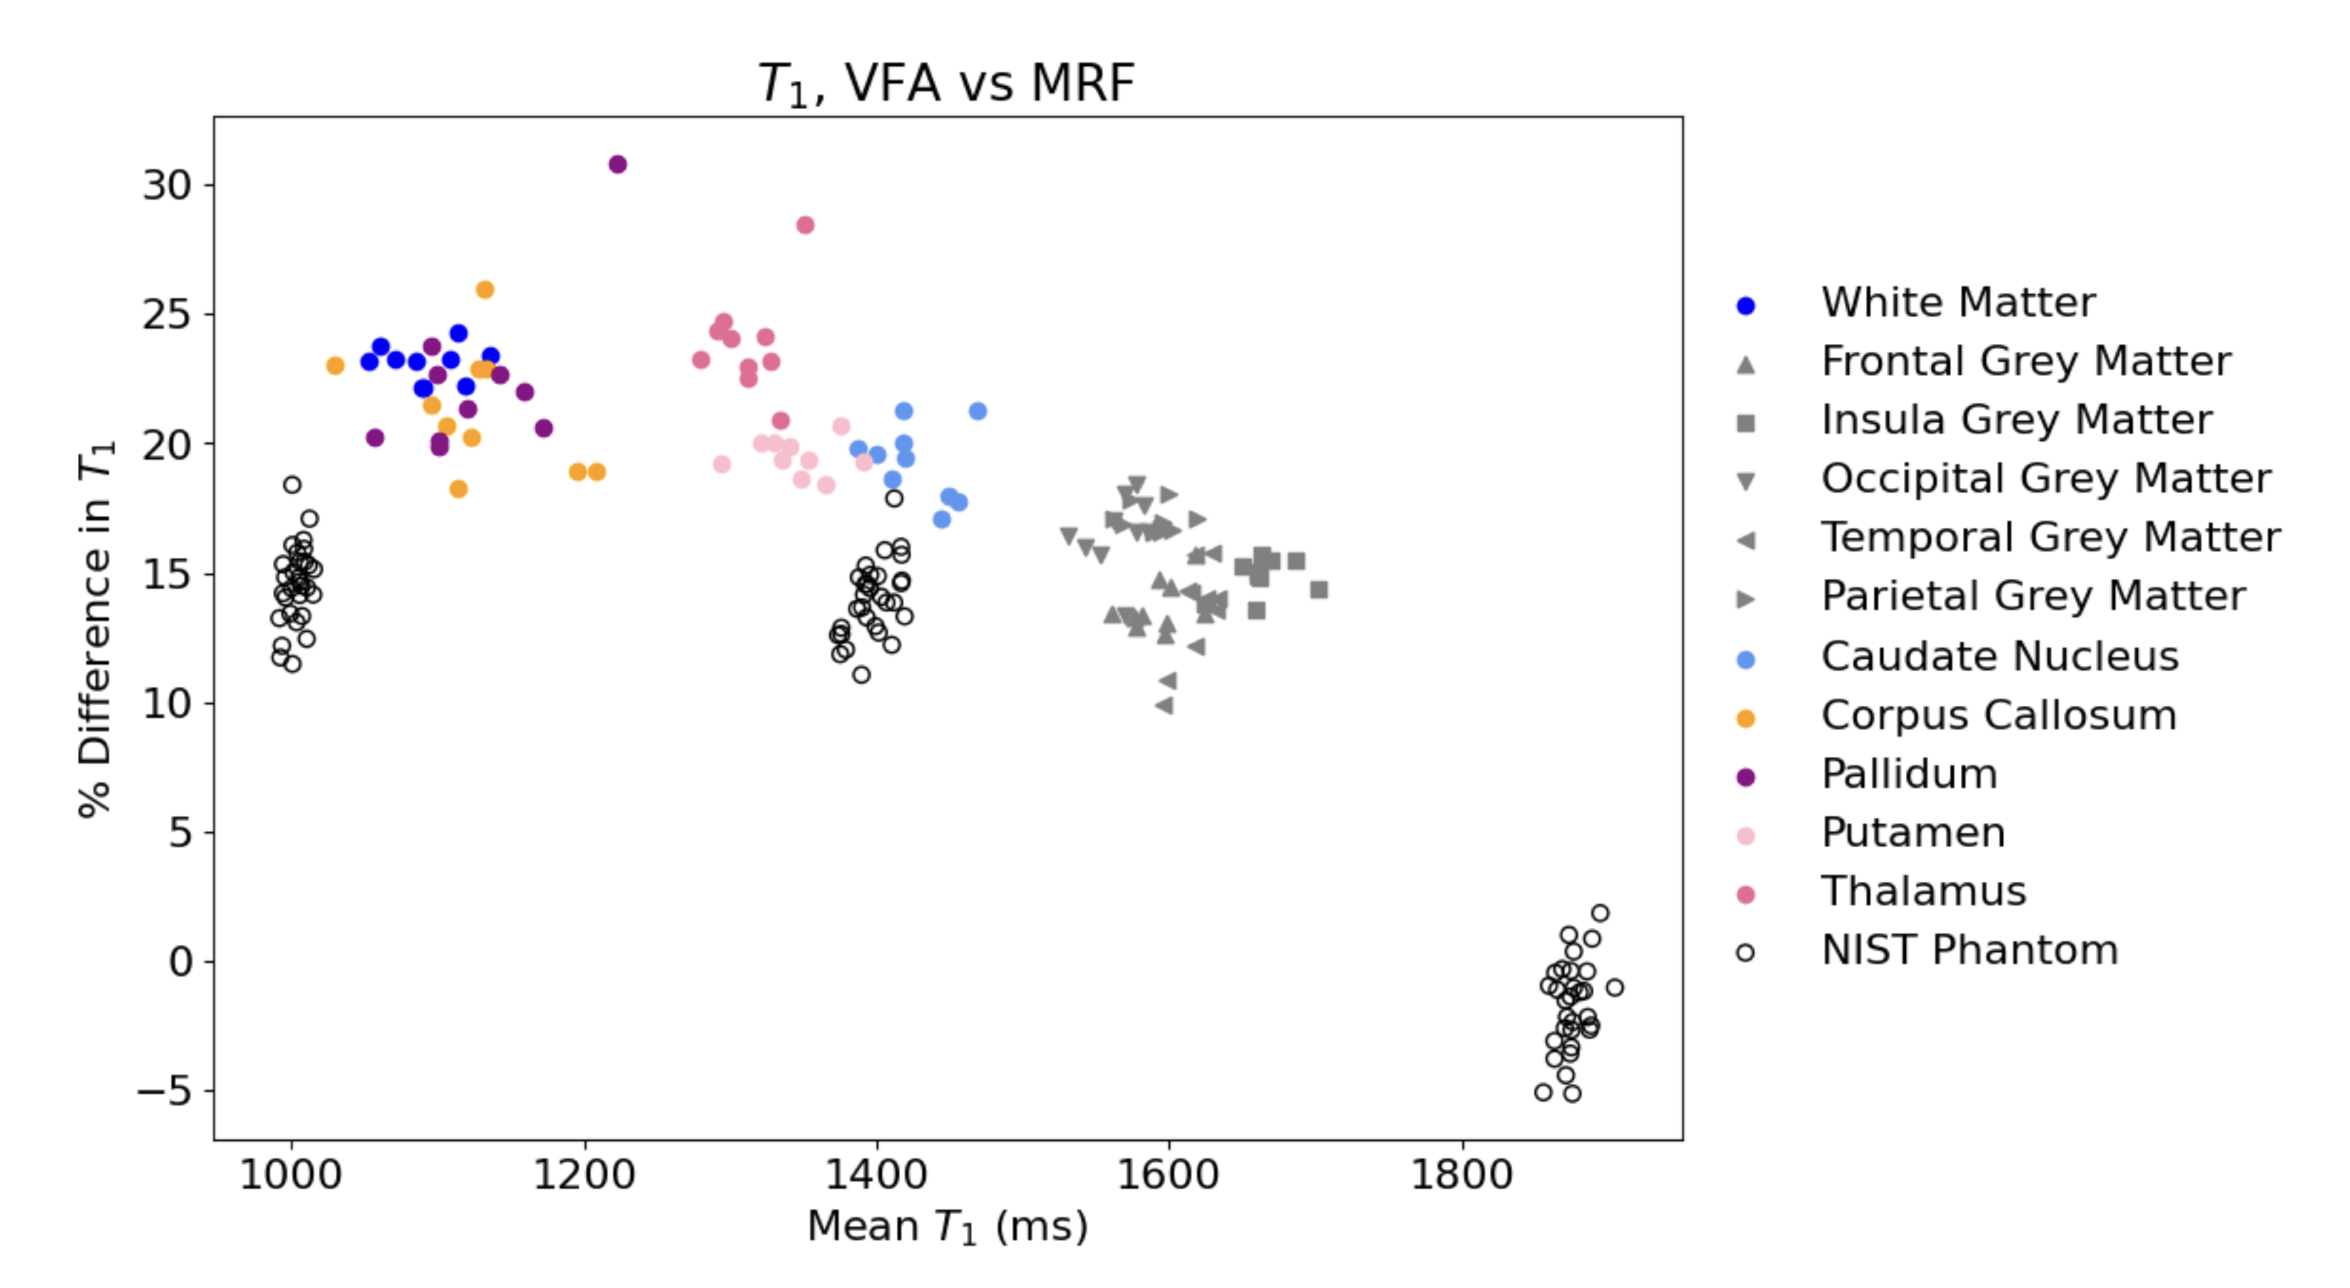
In Fig.4 and Fig.5, Bland-Altman plots show percentage difference between MRF and reference values against the mean between them.
Discussion
MRF and reference methods quantify T1 and T2 more consistently in the NIST phantom of uniform tissue solutions than in the brain, especially for T2. Tissue microstructure impacts T1 and T2 relaxation mechanisms. Magnetisation transfer (MT) occurs during all MR acquisitions where macromolecules (e.g., proteins) are present. Macromolecular protons’ T2s are too short to be imaged directly, but these “bound” protons exchange magnetisation with the ‘free’ protons that generate MR signal6. MT is associated with myelin7, since layers of the myelin sheath are comprised of large macromolecular chains.Biases are greatest in the corpus callosum (T1: 23% and T2: 50%), the most myelin-dense area of the brain8. The pallidum and thalamus are deep grey matter structures that also contain moderate concentrations of myelin8. The areas with the least percentage biases, around 25% (putamen, caudate and other grey matter regions) are the least myelin dense8. Percentage biases between MRF and reference mapping methods for both T1 and T2 correlate with myelin density and therefore MT.
T1 VFA and T2 MESE do not provide ground truth relaxation times; MT also affects T1 VFA quantification9. However, the transient nature of MRF could make it even more sensitive to MT10, since exchange does not reach equilibrium during signal acquisition. Since T1 and T2 are quantified simultaneously in MRF, errors in T1 will propagate to T2 meaning T2 is unusually MT-sensitive. Understanding how MT affects quantification of T1 and T2, and how to model MT in MRF remains a challenge11.
Conclusion
VFA T1 mapping, MESE T2 mapping, MRF T1 and T2 mapping give consistent measurements in the NIST phantom, in agreement with ground truth NMR data. Quantification deviates in brain tissue, with MRF underestimating T1 and T2 in comparison to reference methods. Deviation extent in different tissue ROIs appears to correlate with myelin density and could be caused by magnetisation transfer.Acknowledgements
The authors would like to thank the volunteers who participated in the study and acknowledge funding from the Imperial NHS Imaging Department and the CRUK Convergence Science Centre. The authors would also like to thank the Imperial NHS ImRes Group, the Imperial MRI Physics Collective; Mathias Nittka of Siemens Healthineers. Thanks also to Shaihan Malik for thoughtful discussion about MT, and to Xavier Golay for providing colourmaps.References
1. Statton, B. K. et al. Temperature dependence, accuracy, and repeatability of T1 and T2 relaxation times for the ISMRM/NIST system phantom measured using MR fingerprinting. Magn. Reson. Med. 87, 1446–1460 (2022).
2. Körzdörfer, G. et al. Reproducibility and repeatability of MR fingerprinting relaxometry in the human brain. Radiology 292, 429– 437 (2019).
3. Buonincontri, G. et al. Multi-site repeatability and reproducibility of MR fingerprinting of the healthy brain at 1.5 and 3.0 T. NeuroImage (2019).
4. Fischl, B. FreeSurfer. NeuroImage 62, 774–781 (2012).
5. Jenkinson, M. et al. Improved optimization for the robust and accurate linear registration and motion correction of brain images. NeuroImage 17, 825–841 (2002).
6. Henkelman, R. M. et al. Quantitative Interpretation of Magnetization Transfer. Magn Reson Med. 29(6), 759-66 (1993).
7. Schmierer, K. et al. Magnetization transfer ratio and myelin in postmortem multiple sclerosis brain. Ann. Neurol. 56, 407–415 (2004).
8. Sepehrband, F. et al. Brain tissue compartment density estimated using diffusion-weighted MRI yields tissue parameters consistent with histology. Hum. Brain Mapp. 36, 3687–3702 (2015).
9. Teixeira, R. A. G. et al. Controlled saturation magnetization transfer for reproducible multivendor variable flip angle T 1 and T 2 mapping. Magn. Reson. Med. 84, 221–236 (2020).
10. Blumhagen, J. O. et al. Impact of Magnetization Transfer on Relaxometry using Transient Steady-State Free Precession Imaging. Proc. Intl. Soc. Mag. Reson. Med. 17 (2009).
11. Hilbert, T. et al. Magnetization transfer in magnetic resonance fingerprinting. Magn. Reson. Med. 84, 128–141 (2020).
Figures