2177
Ultrafast simultaneous T2 and T2* mapping in 150 ms using non-Cartesian single-shot SPEN MRI1Department of Electronic Science, Fujian Provincial Key Laboratory of Plasma and Magnetic Resonance, School of Electronic Science and Engineering, National Model Microelectronics College, Xiamen University, Xiamen, China
Synopsis
Keywords: Relaxometry, Relaxometry, T2 Mapping, T2* Mapping
Motivation: T2 and T2* mapping can quantitatively characterize tissue pathologies, improving diagnosis and treatment, but their clinical applications are hindered by relatively long scan times.
Goal(s): To develop an ultrafast method for simultaneously obtaining T2 and T2* mapping.
Approach: A biaxial spatiotemporally encoded (SPEN) sequence with multi-spin-echo trains and spiral out-in-out-in trajectory was developed to obtain multiple images with different echo times within a single shot. The acquired signal was fitted to yield simultaneous T2 and T2* mapping.
Results: Numerical simulations and in vivo rat brain and kidney experiments were conducted to validate the proposed method.
Impact: We developed an ultrafast technique to simultaneously obtain T2 and T2* mapping in 150 ms, potentially facilitating the use of T2 and T2* mapping in scenarios requiring high time resolution.
Introduction
Quantitative magnetic resonance imaging is a valuable diagnostic tool that has gained significant importance in various research and clinical applications.1 In general, traditional T2 and T2* mapping involve the acquisition of several images at various echo times, resulting in relatively long scan times and increased susceptibility to subject motion. Single-shot spatiotemporally encoded (SPEN)2 is an ultrafast MRI technique that provides comparable imaging speed to traditional echo-planar imaging (EPI), along with distinctive advantages such as increased resilience to B0 inhomogeneity, a fully refocused mechanism, and flexible field-of-view (FOV) imaging. Previous studies have demonstrated that SPEN MRI can provide ultrafast real-time T2 mapping.3 Here, a biaxial SPEN sequence with multi-spin-echo trains and spiral out-in-out-in trajectory was developed to simultaneously obtain T2 and T2* mapping with flexible FOV and further reduced scan time.Methods
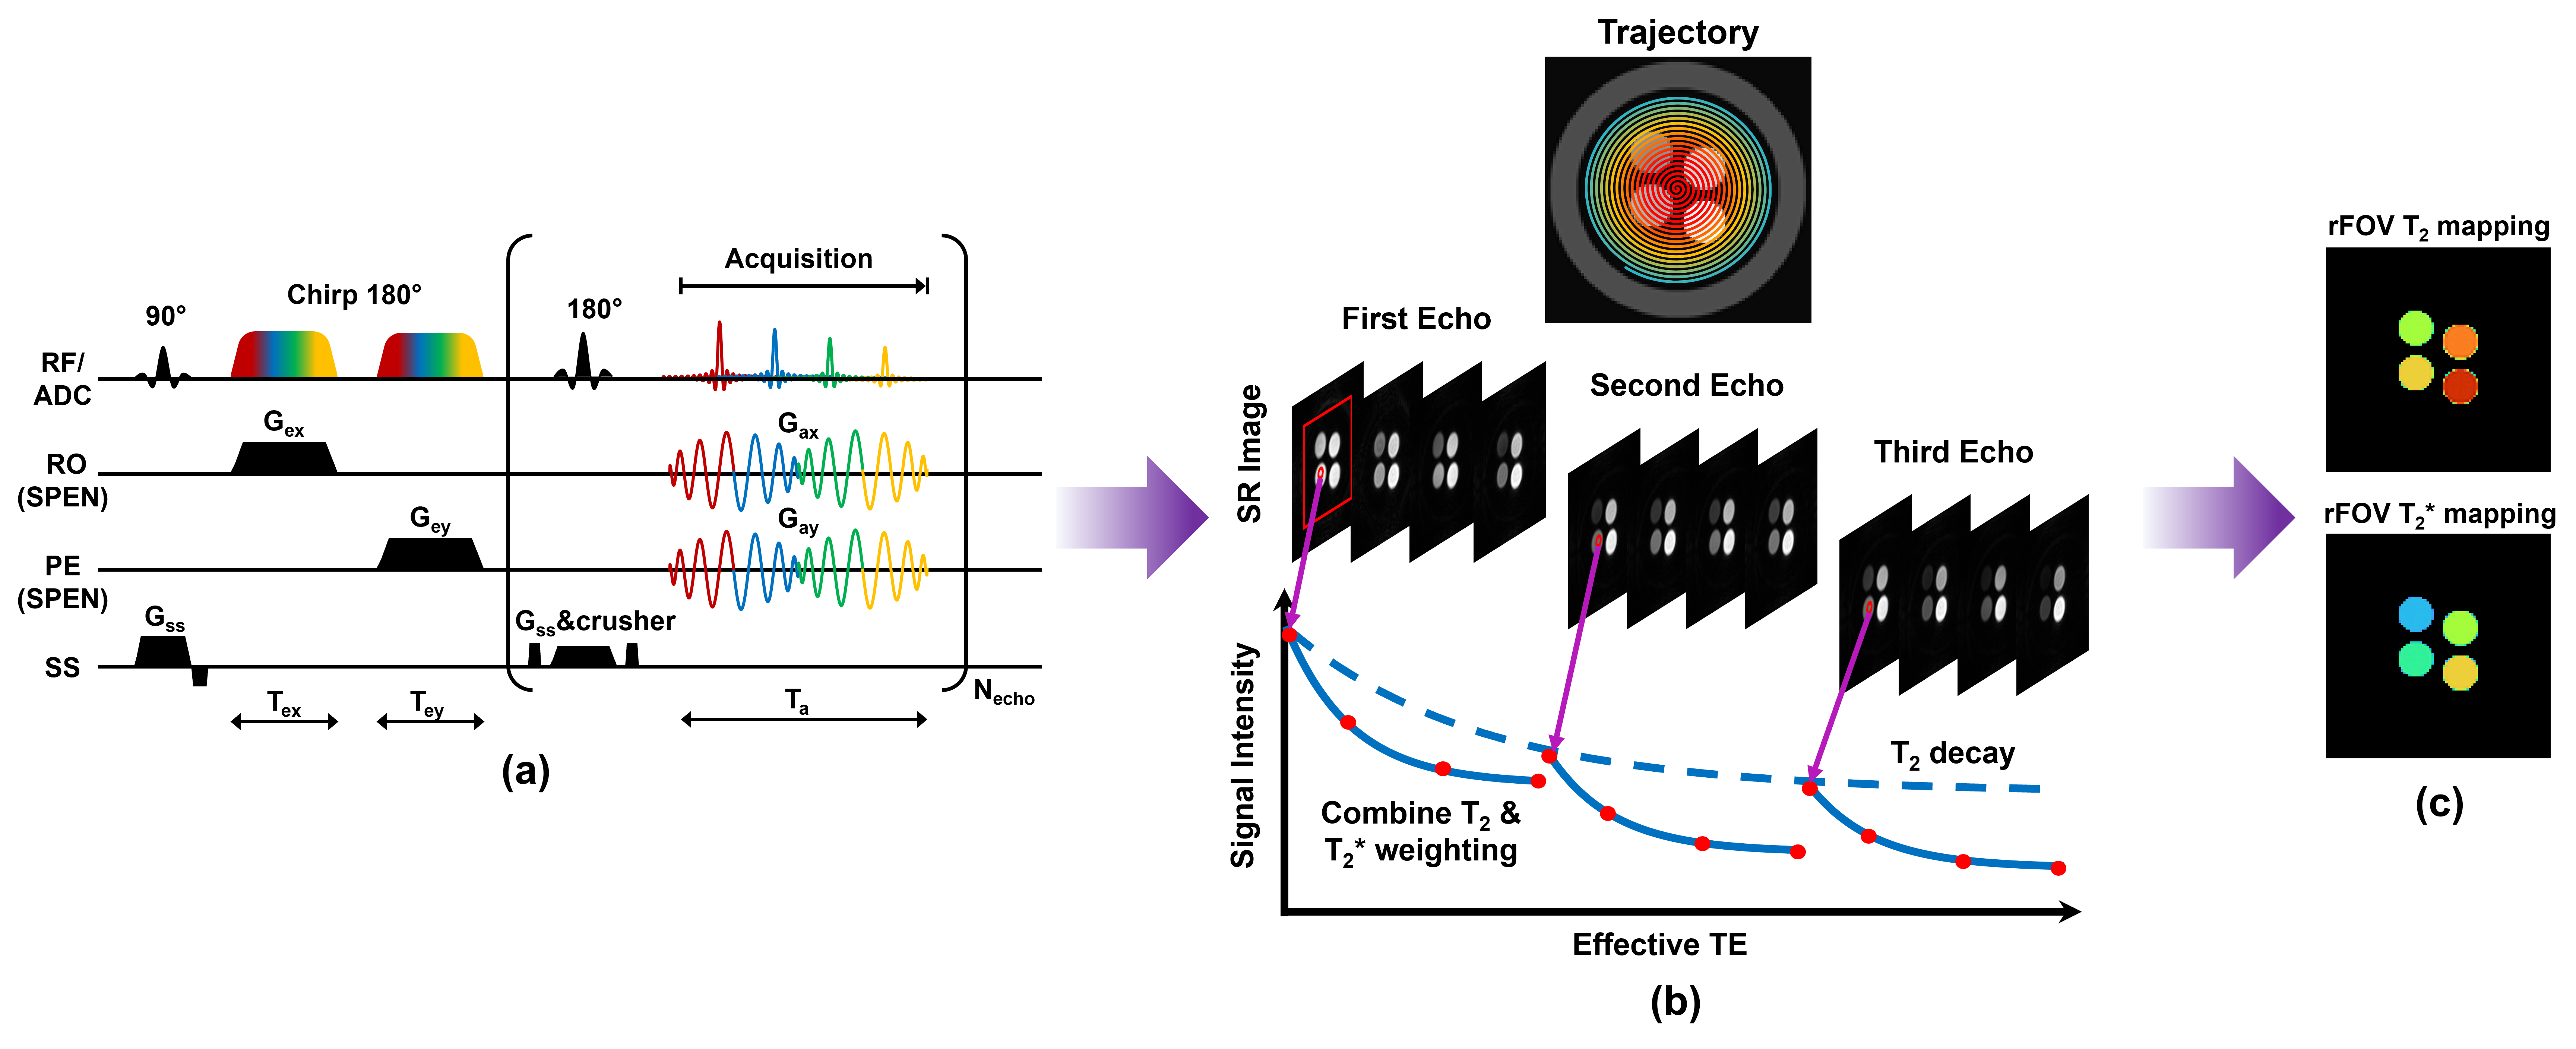
The proposed SPEN sequence with multi-spin-echo trains and spiral out-in-out-in trajectory is shown in Fig 1(a). Due to the biaxial frequency-swept excitation strategy with Chirp pulses, the acquired signal $$$S(t)$$$ can be modeled as:$$S(t)=\iint\rho(x,y)exp(i\phi_a(x,y,t)dxdy\cdot exp(-\frac{t}{T_{2}})\cdot exp(-\frac{\triangle}{T_2^\prime})$$ $$\phi_a(x,y,t)=\phi_e(x,y,t)+\gamma\int_{0}^{t} G_x(t)dt\cdot x+\gamma\int_{0}^{t} G_y(t)dt\cdot y$$ $$\triangle=|t-\tau|$$ $$\frac{1}{T_2^*}=\frac{1}{T_2}+\frac{1}{T_2^\prime}$$
where $$$\rho(x,y)$$$ denotes the spatial profile of spin density, $$$\tau$$$ refers to the nominal echo time of multi-spin-echo trains, and $$$T_2^\prime$$$ accounts for contributions from magnetic susceptibility. $$$G_x(t)$$$ and $$$G_y(t)$$$ epresent the decoding gradients, which are used to decode a flexible FOV with a pre-defined trajectory. In this study, a spiral out-in-out-in trajectory was adopted. As shown in Fig 1(b), single-shot acquisition yields a series of flexible FOV images with varying echo times due to their variable contrast. Fitting multiple contrast images with different effective echo times yields T2 and T2*. The flowchat of the proposed method is shown in Fig 1. The numerical simulations were carried out with the MRiLab software.4 The in vivo rat experiments were performed on a 7T Varian MRI scanner.
Results and Discussion
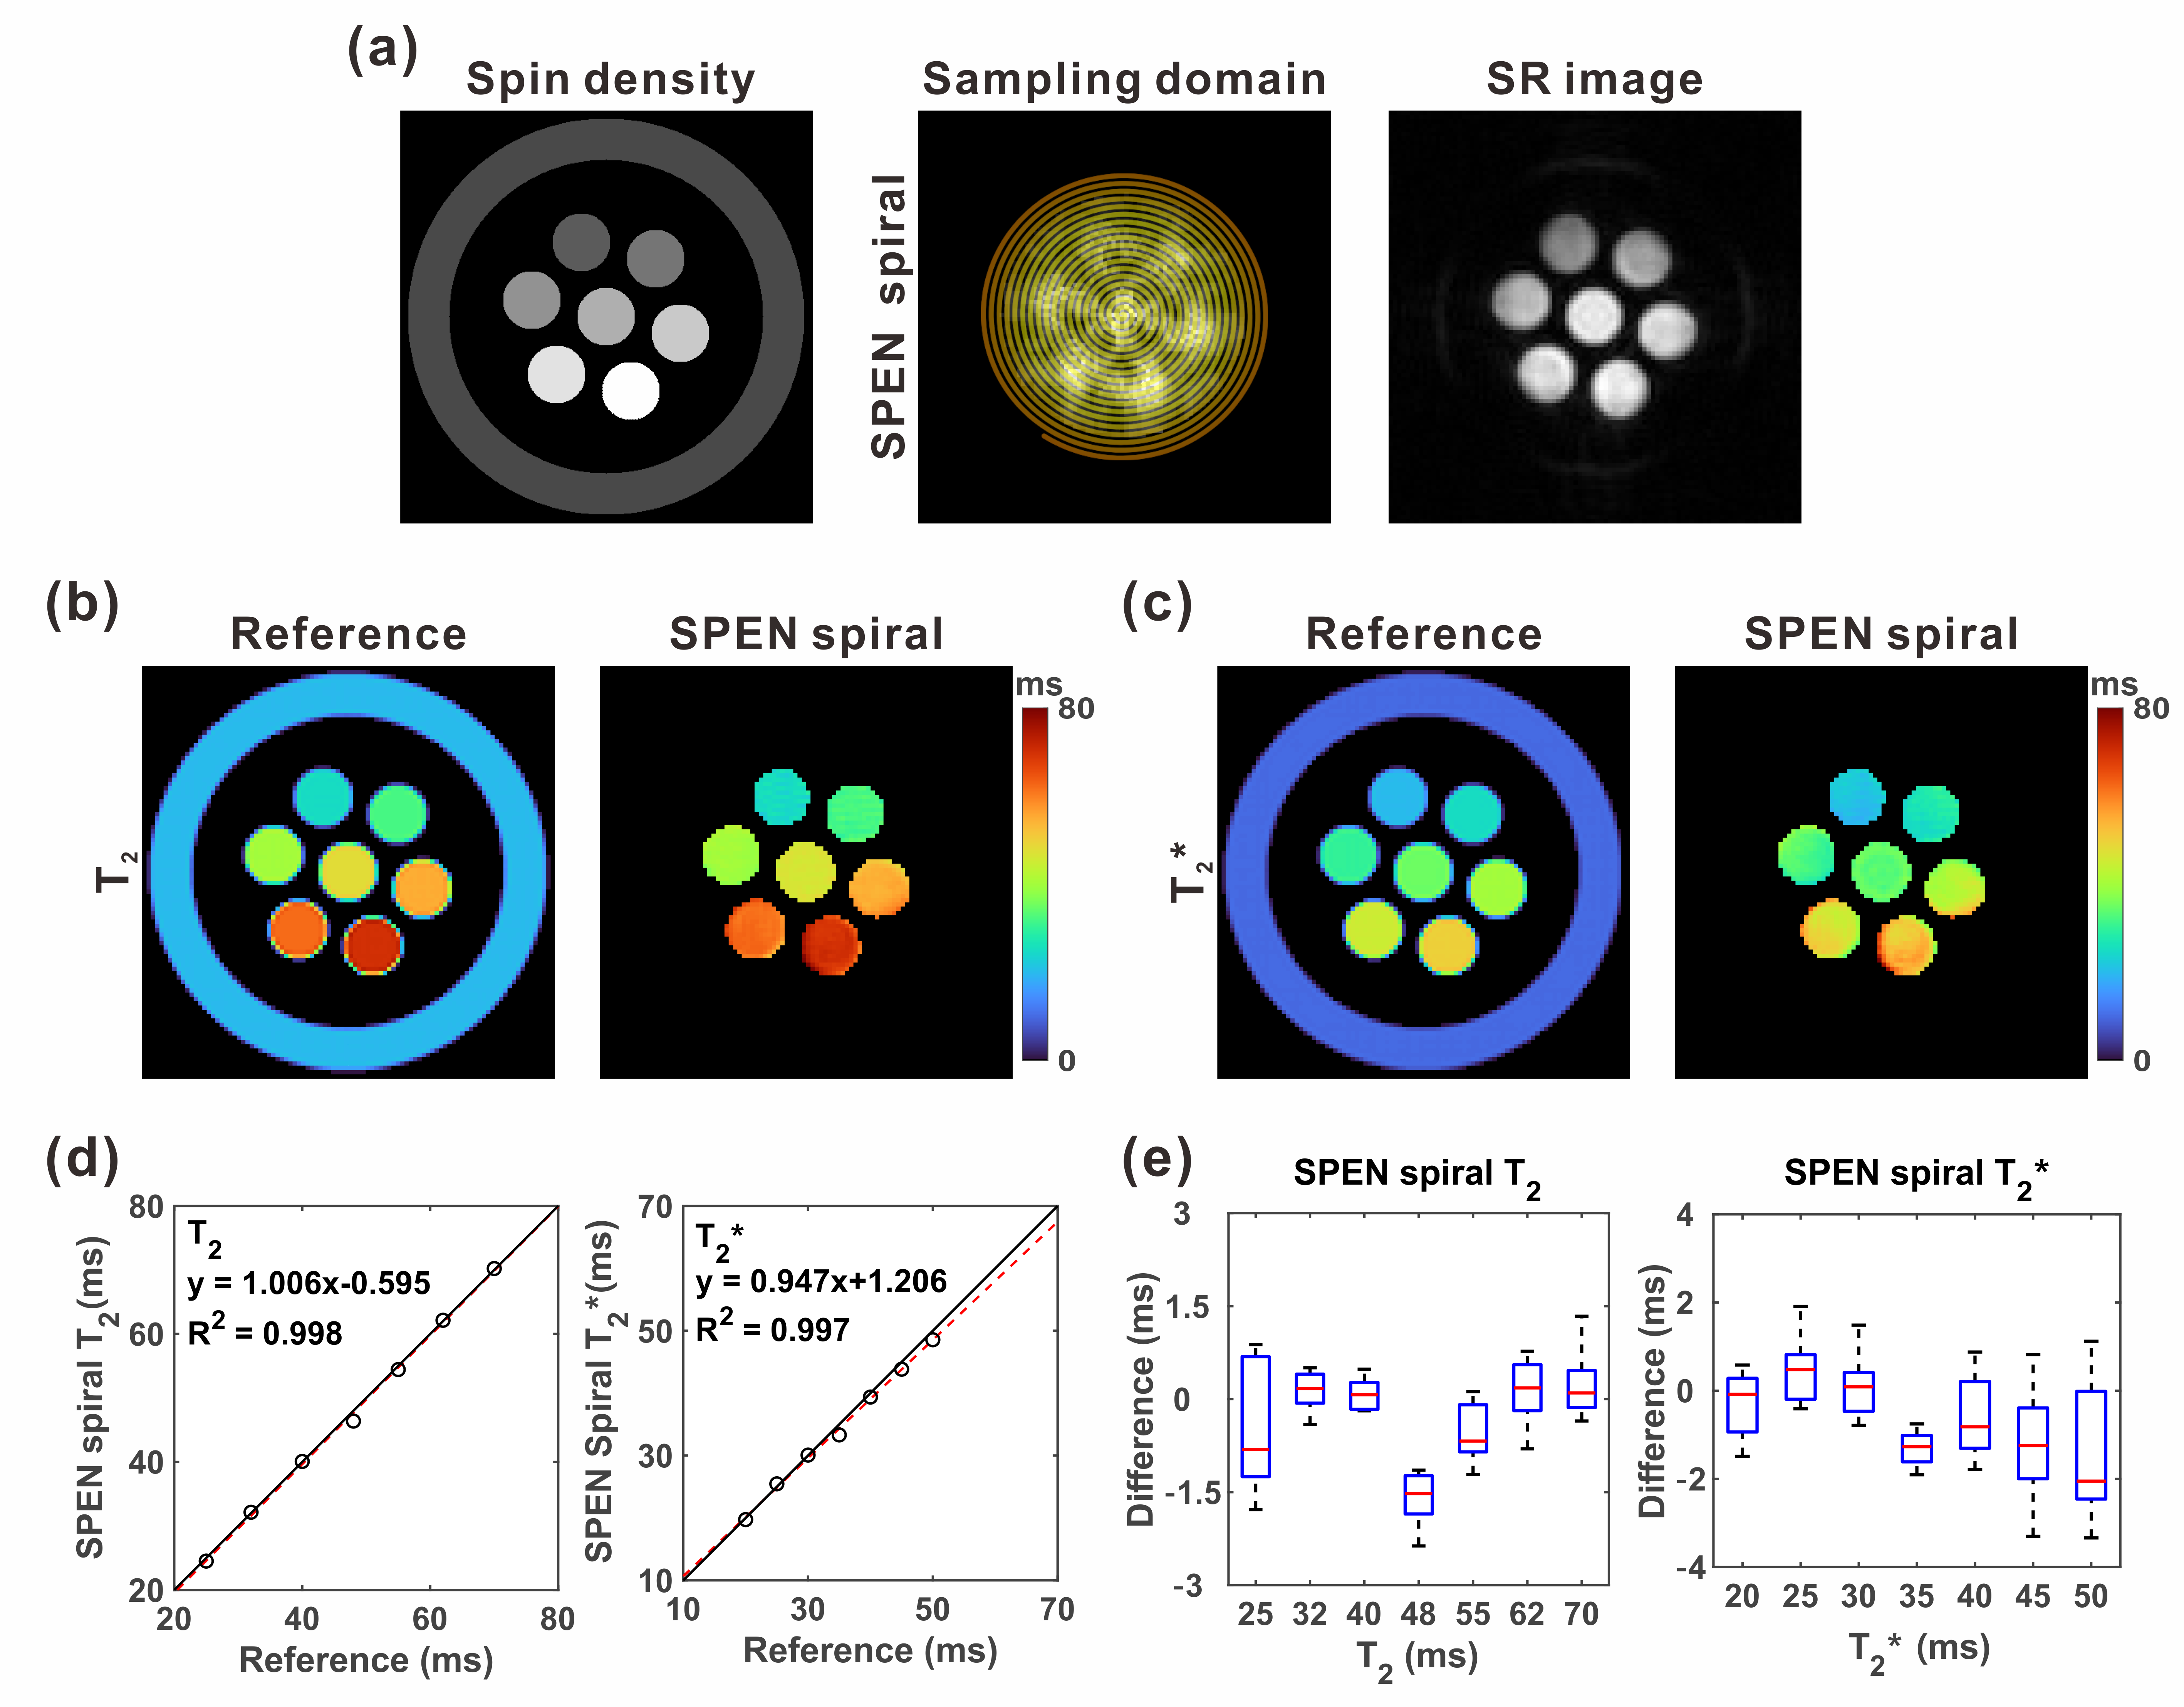
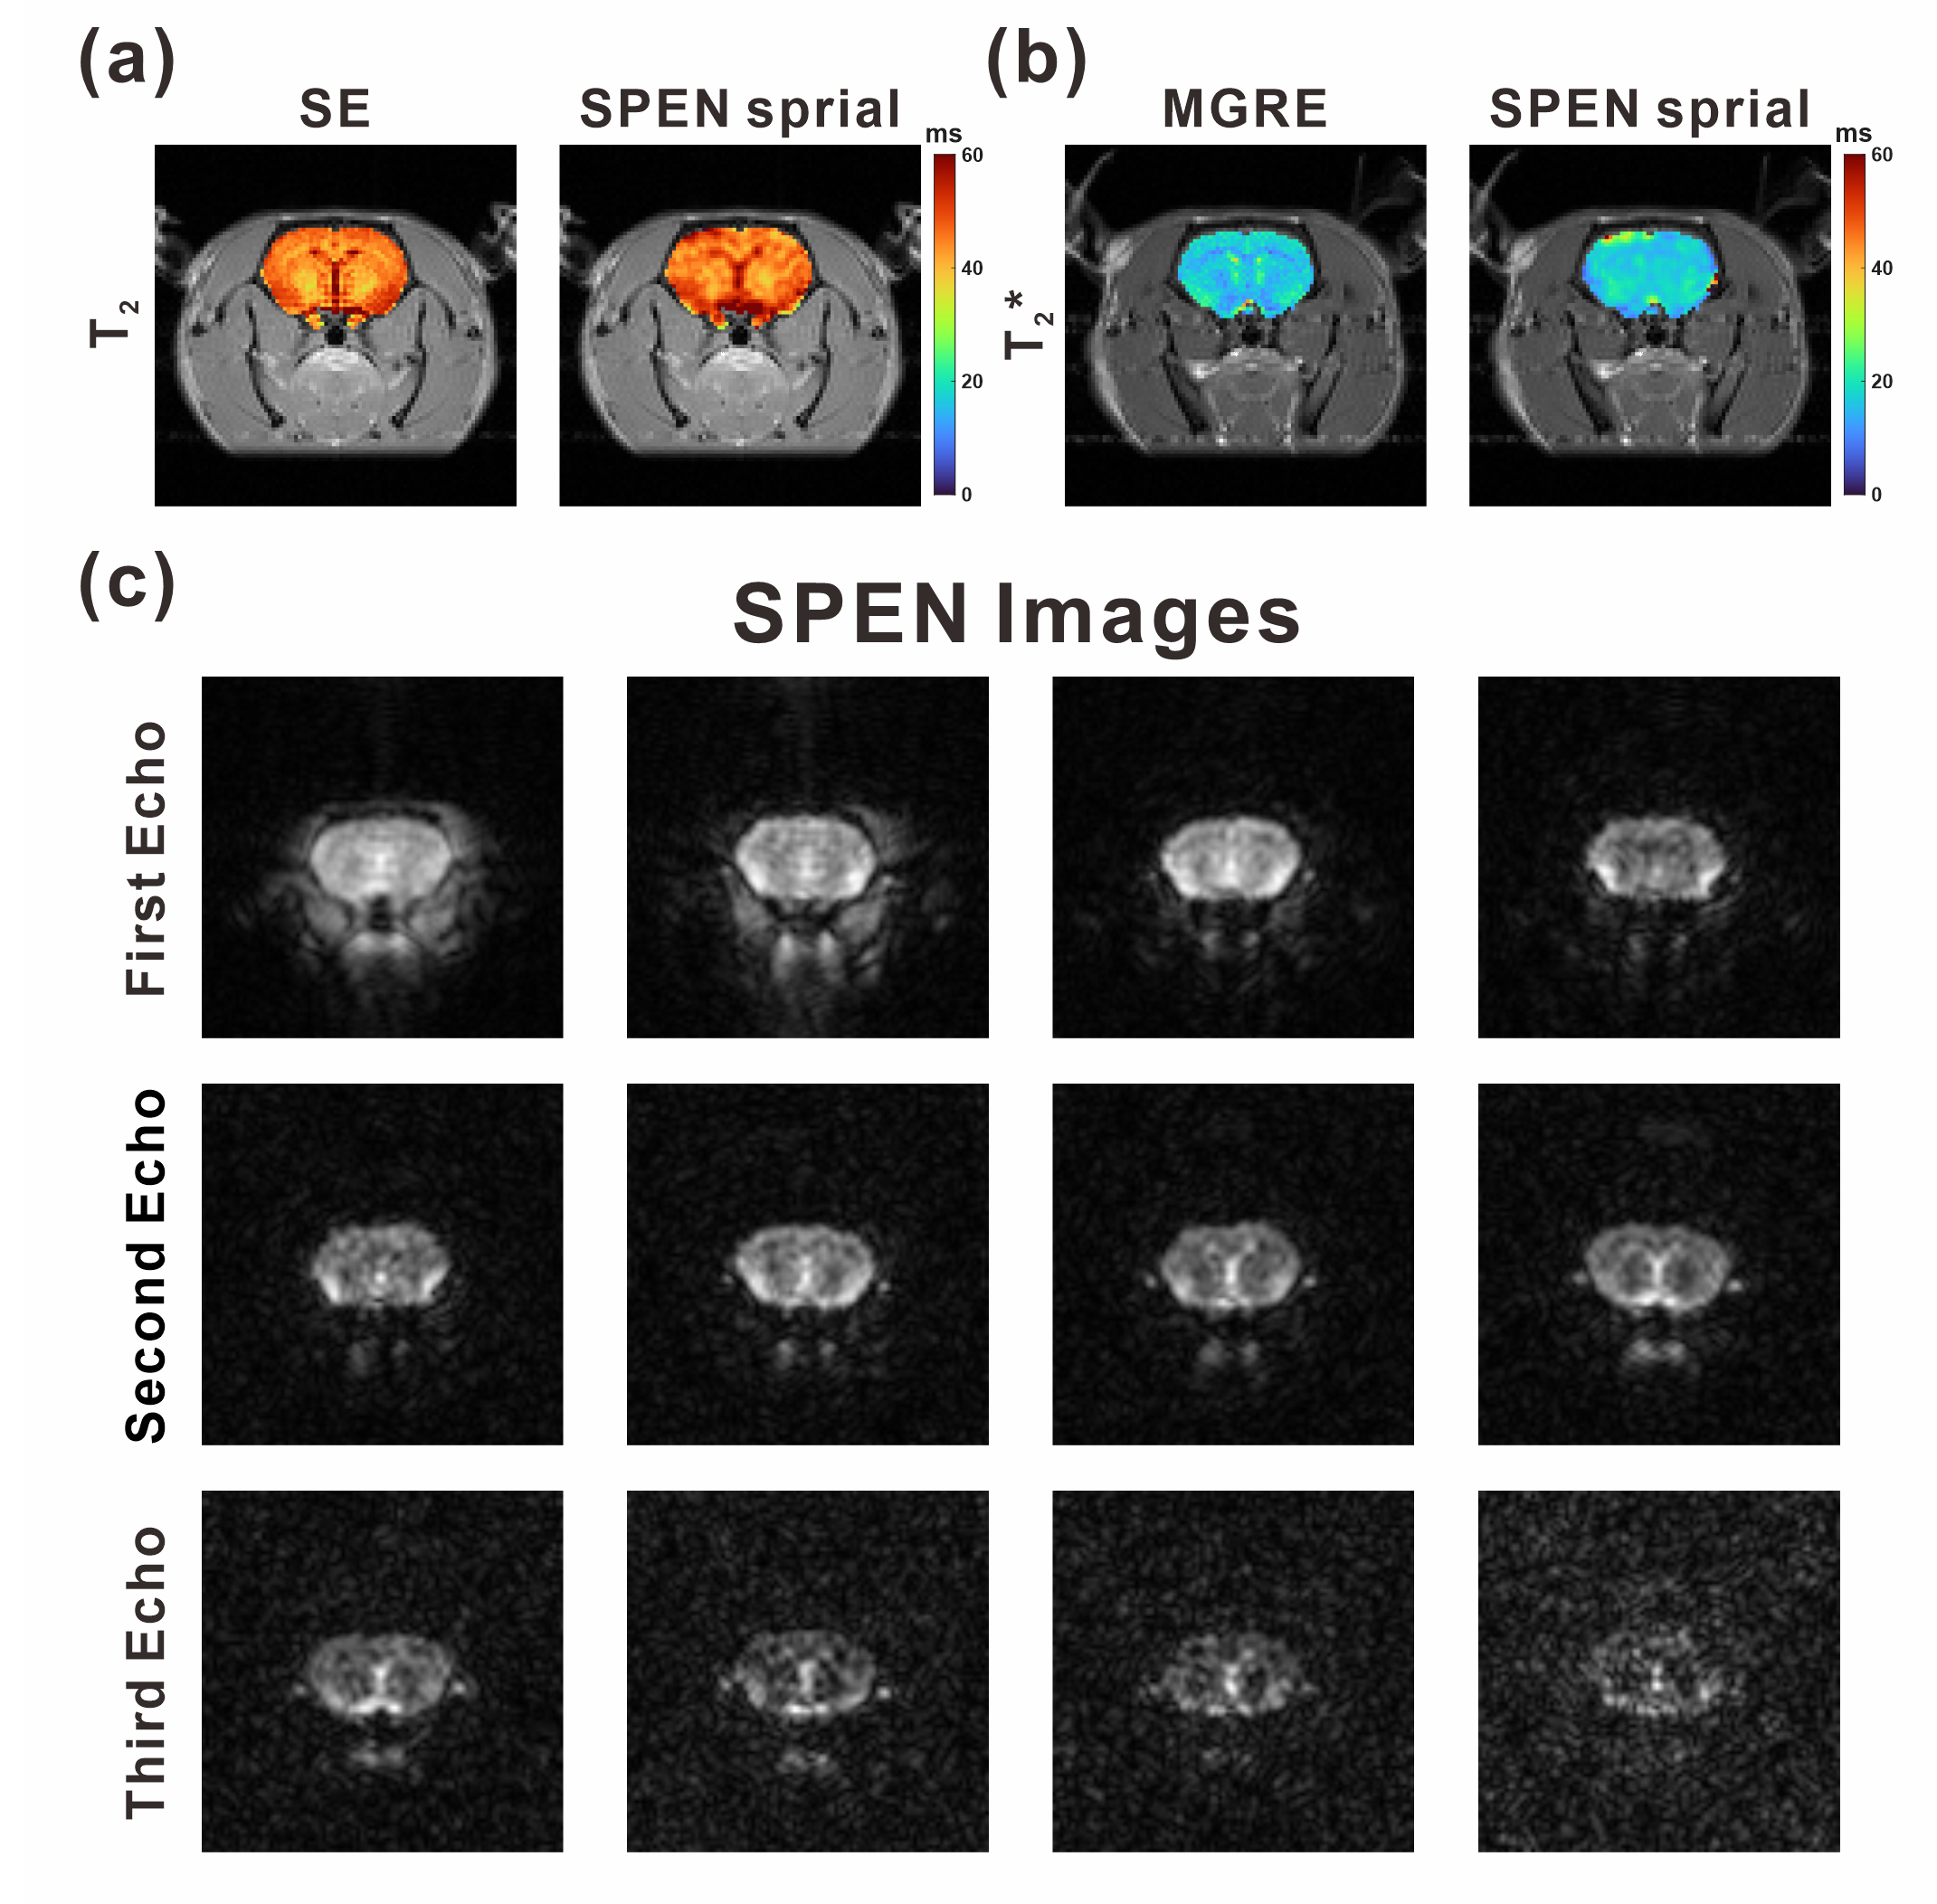
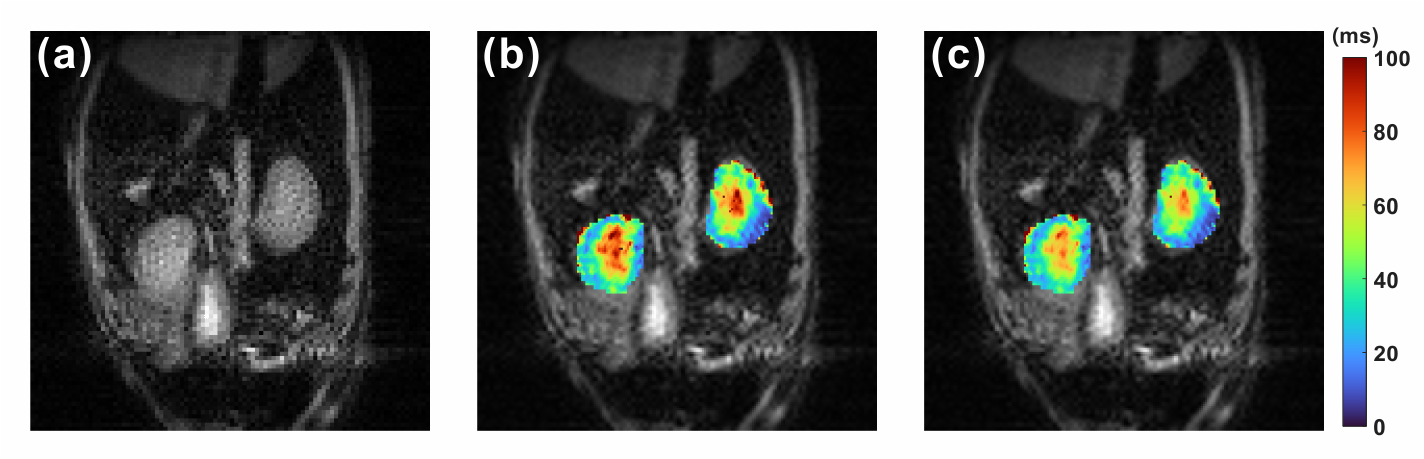
Fig 2 shows T2 and T2* mapping for the numerical simulation, with a flexible FOV targeting the centered seven tubes while discarding the peripheral circle. Despite exciting the peripheral circle with a biaxial chirp pulse, the reconstructed images were unaffected by interference from the peripheral circle due to the special selective properties of SPEN MRI. As shown in Fig 3(e), the error in T2 is within ± 1.5 ms, and the error in T2* is within ± 2.5 ms. Fig 3 demonstrates in vivo rat experiments targeting brain T2 and T2* mapping, along with reconstructed images at different echo times. The results show that satisfactory reconstructed images were obtained with a reduced FOV, free of aliasing artifacts. The T2 and T2* mapping obtained by SPEN MRI is consistent with that obtained by the SE method and MGRE (multi-echo gradient-echo) method. Fig 4 shows T2 and T2* mapping for the in vivo rat kidney, which is more challenging compared to brain experiments due to severe B0 inhomogeneity and respiratory motion. The results indicate that satisfactory T2 and T2* mapping can be obtained using SPEN MRI. T2 values is 62.5 ± 4.1 ms in medulla, and 47.6 ± 7.4 ms in cortex. T2* values is 47.2 ± 8.4 ms in medulla, and 29.4 ± 8.2 ms in cortex.The values are consistent with previous studies.3, 5, 6 Compared to the previous study,7 the proposed method can obtain additional T2* mapping and further reduce the scan time by utilizing flexible FOV scheme and spiral trajectory with high sampling efficiency.Conclusions
Ultrafast T2 and T2* mapping can be simultaneously obtained using non-Cartesian single-shot SPEN MRI with flexible FOV and satisfactory resilience to B0 inhomogeneity. The proposed method can facilitate the applications of T2 and T2* mapping in experiments with high time requirements.Acknowledgements
This work is supported by the National Natural Science Foundation of China, Grant/Award Number: 82302151, 12175189, 22161142024; Shenzhen Science and Technology Program, Grant/Award Number: JCYJ20220818101213029; Fujian Province Science and Technology Project, Grant/Award Number: 2022J05013; Xiamen University Nanqiang Outstanding Talents Program.References
1. Thomas KE, Fotaki A, Botnar RM, Ferreira VM. Imaging Methods: Magnetic Resonance Imaging. Circulation Cardiovascular imaging 2023;16:e014068-e014068.
2. Tal A, Frydman L. Spectroscopic imaging from spatially-encoded single-scan multidimensional MRI data. JOURNAL OF MAGNETIC RESONANCE 2007;189:46-58.
3. Bao Q, Ma L, Liberman G, Solomon E, Martinho RP, Frydman L. Dynamic T-2 mapping by multi-spin-echo spatiotemporal encoding. MAGNETIC RESONANCE IN MEDICINE 2020;84:895-907.
4. Liu F, Velikina JV, Block WF, Kijowski R, Samsonov AA. Fast Realistic MRI Simulations Based on Generalized Multi-Pool Exchange Tissue Model. IEEE TRANSACTIONS ON MEDICAL IMAGING 2017;36:527-537.
5. Li LP, Lu J, Zhou Y, et al. Evaluation of Intrarenal Oxygenation in Iodinated Contrast-Induced Acute Kidney Injury-Susceptible Rats by Blood Oxygen Level-Dependent Magnetic Resonance Imaging. INVESTIGATIVE RADIOLOGY 2014;49:403-410.
6. Tao Q, Zhang Q, An Z, Chen Z, Feng Y. Multi-Parametric MRI for Evaluating Variations in Renal Structure, Function, and Endogenous Metabolites in an Animal Model With Acute Kidney Injury Induced by Ischemia Reperfusion. Journal of magnetic resonance imaging : JMRI 2023.
7. Shrot Y, Frydman L. Spatially encoded NMR and the acquisition of 2D magnetic resonance images within a single scan. JOURNAL OF MAGNETIC RESONANCE 2005;172:179-190.
Figures