2176
Improved chemical exchange detection using magnetization transfer (MT) effect independent composite metric (R2-R1rho): a preliminary study1Imaging and Interventional Radiology, The Chinese University of Hong Kong, Hong Kong, Hong Kong, 2MR Collaboration, Siemens Healthineers Ltd, Hong Kong, Hong Kong, 3Illuminatio Medical Technology Limited, Hong Kong, Hong Kong
Synopsis
Keywords: Relaxometry, Contrast Mechanisms, Spin Lock
Motivation: Composite metric R2-R1rho (1/T2–1/T1rho) could be utilized for probing chemical exchange.. However, a persistent challenge lies in the confounding influences of magnetization transfer (MT) effects on R2, which was not fully discussed in literatures.
Goal(s): In this study, we reported our investigation on this effect and proposed an acquisition strategy to improve the specificity of the composite metric (R2-R1rho) to thethe chemical exchange effect.
Approach: We demonstrated our findings and the proposed method using simulation, phantom, and in vivo experiments.
Results: From our preliminary results, composite metric (R2-R1rho) to detect chemical exchange without the influence from magnetization transfer effect.
Impact: Using improved composite metric (R2-R1rho) to detect chemical exchange without the influence from magnetization transfer effect.
Introduction
The composite metric R2-R1rho has been proposed to assess cartilage degeneration1,2, where the CPMG R2 could be used as a replacement of R1rho at the low frequency of spin-lock (FSL)3. To reduce the error brought by the refocusing pulse during the CPMG R2 preparation, previous studies applied a correction method with an assumption of a fixed T1/T2 ratio4. However, the ratio might vary among subjects, resulting in insufficient correction and quantification errors4,5. The influence of MT effect on the composite metric was not well considered. In this study, we explored the influence of the MT effect on CPMG R2 and the resulting composite metric R2−R1rho.Method
Quantification of T2 using CPMG trains can be confounded by the relaxation effect during the refocusing RF pulses. Typically, composite refocusing RF pulses are used, which has a 180-degree RF pulse sandwiched by two 90-degree RF pulse to mitigate the influence from B1 inhomogeneity. The prolonged refocusing RF pulse can further exacerbate the quantification errors due to the relaxation effect during the refocusing RF pulses. To address this effect, Sled et al.5 introduced a signal attenuation factor to the signal decay model, expressed as:$$S(t) = S_0 \cdot exp(-R_2 \cdot t)\cdot f^n$$
Here, the f represents the attenuation factor after each refocusing pulse, and the n represents the number of refocusing pulses. The attenuation factor f may be affected by the T1 relaxation and MT effect from the refocusing pulse. To minimize this influence, we proposed a method to vary echo spacing but maintain an equal number of refocusing pulses (n1=n2). Consequently, the the R2 from two T2-prepared images S1 and S2 can be calculated as follows:
$$R_2 = \frac{log(S_1/S_2)-(n_1-n_2)\cdot log(f)}{TE_1-TE_2}$$
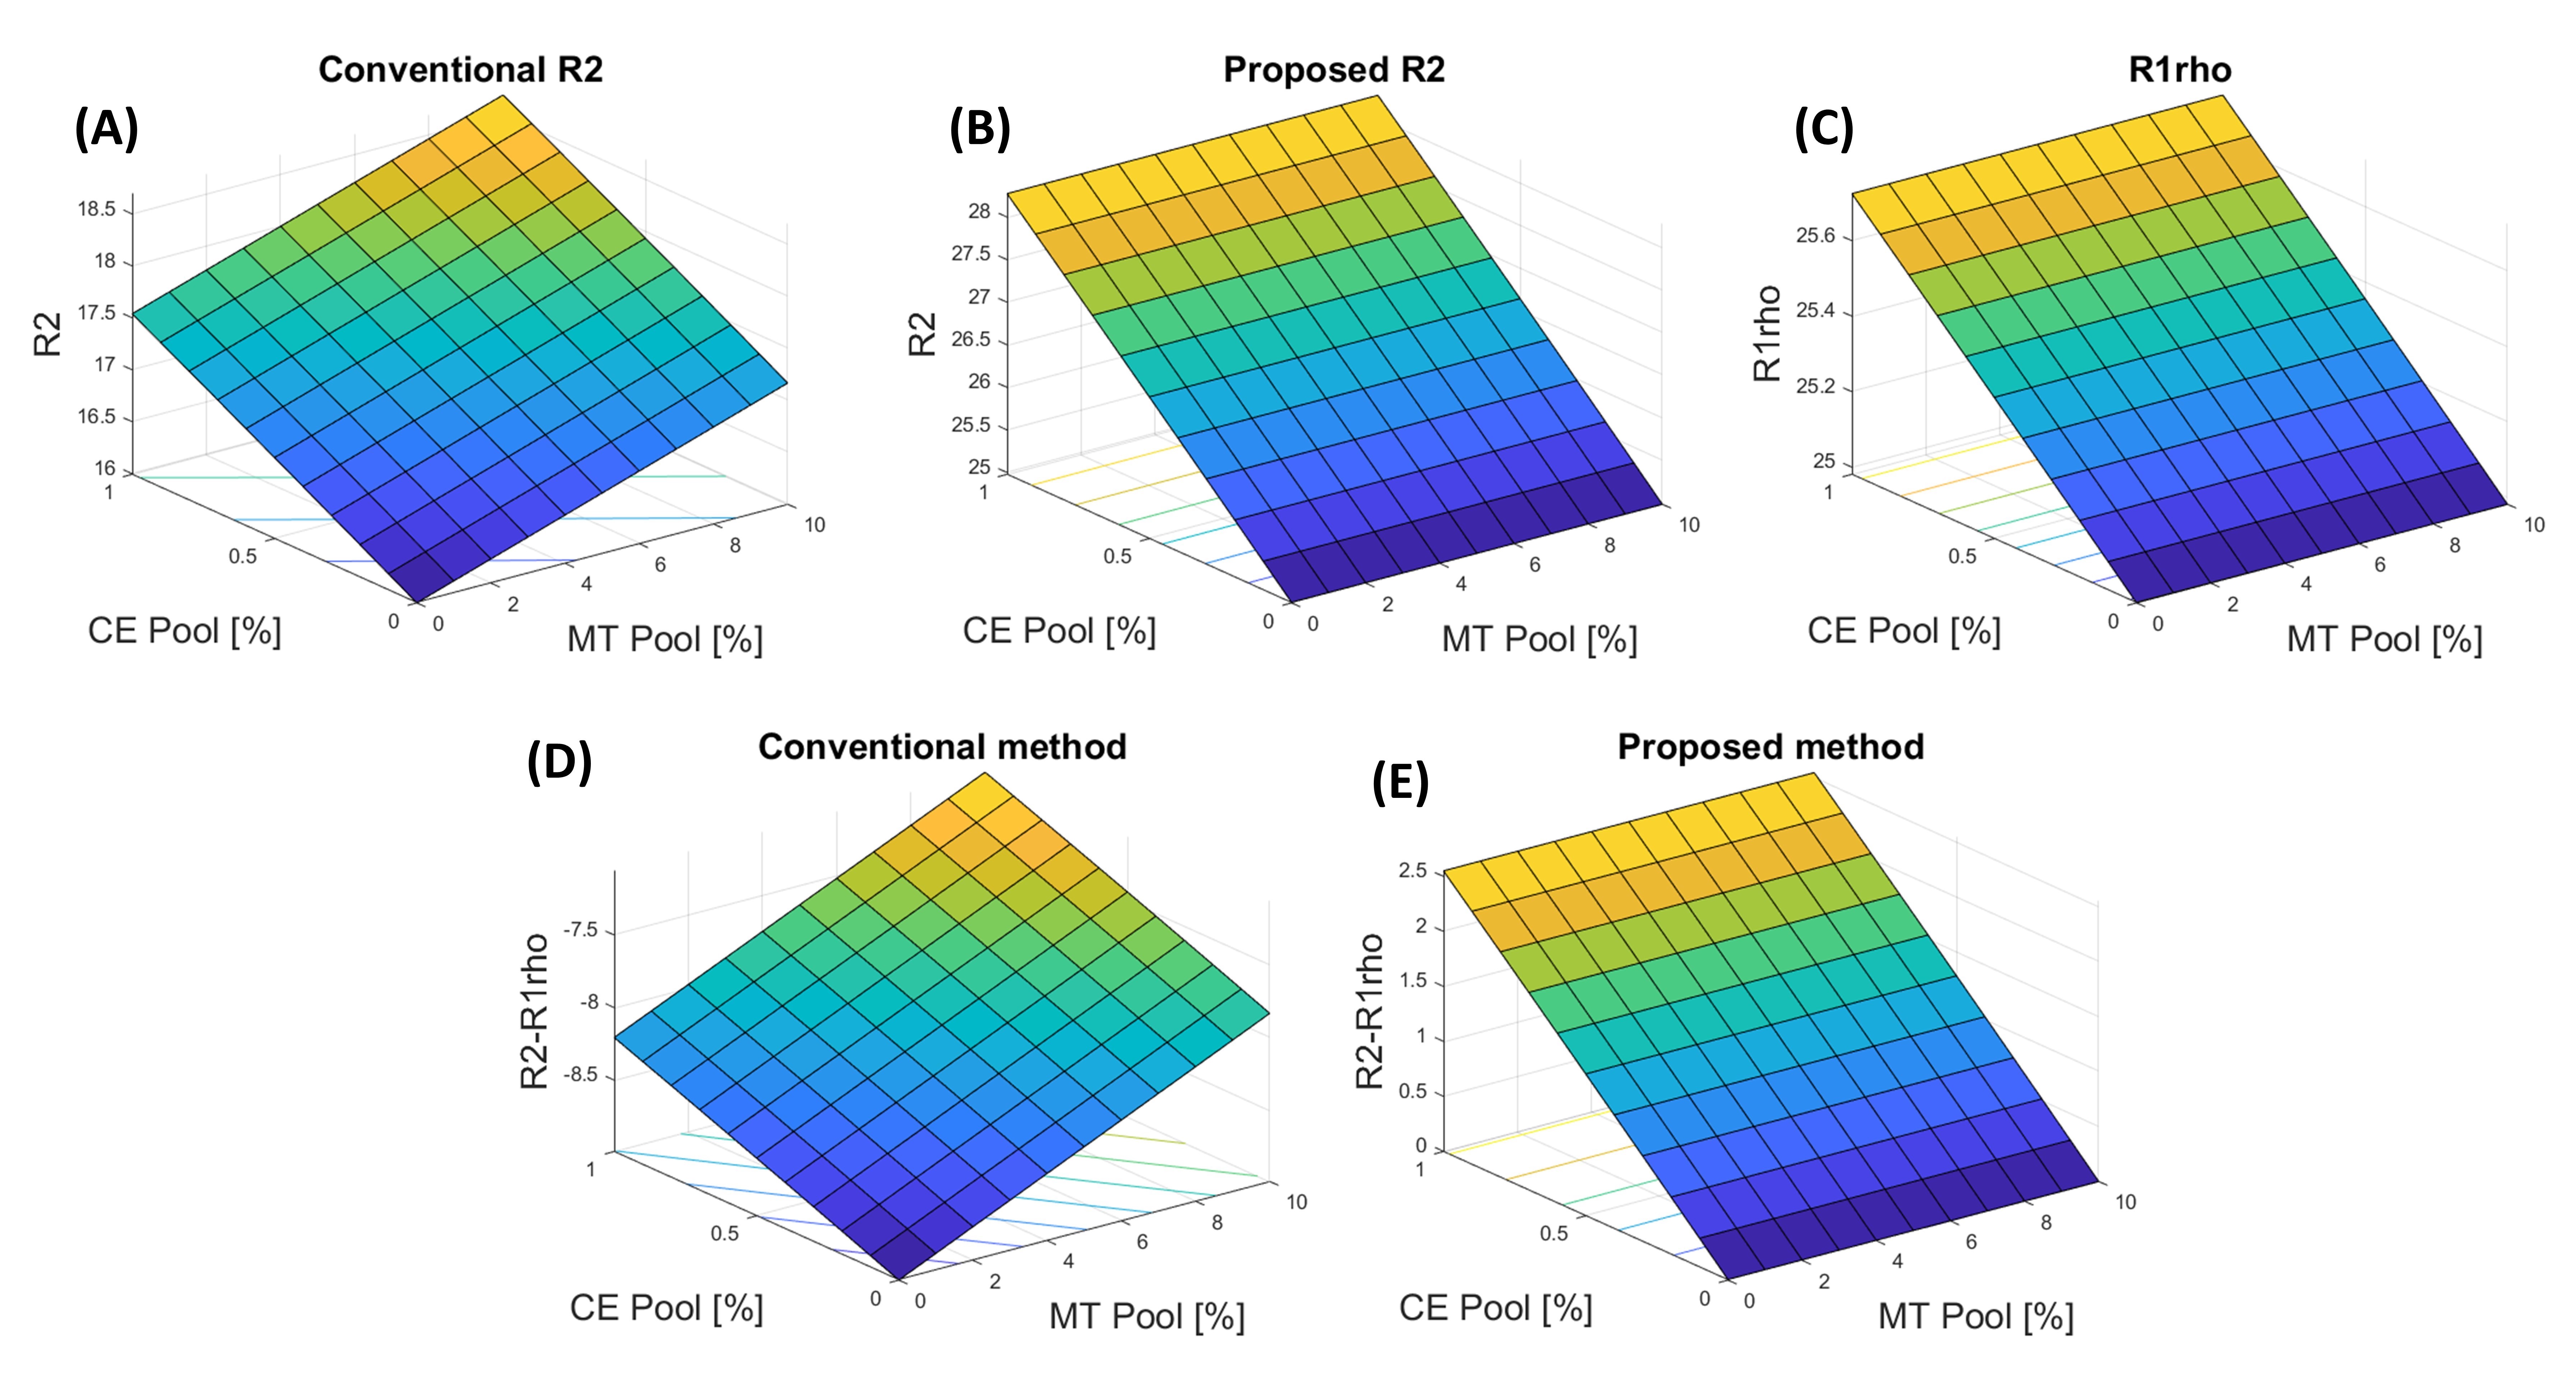
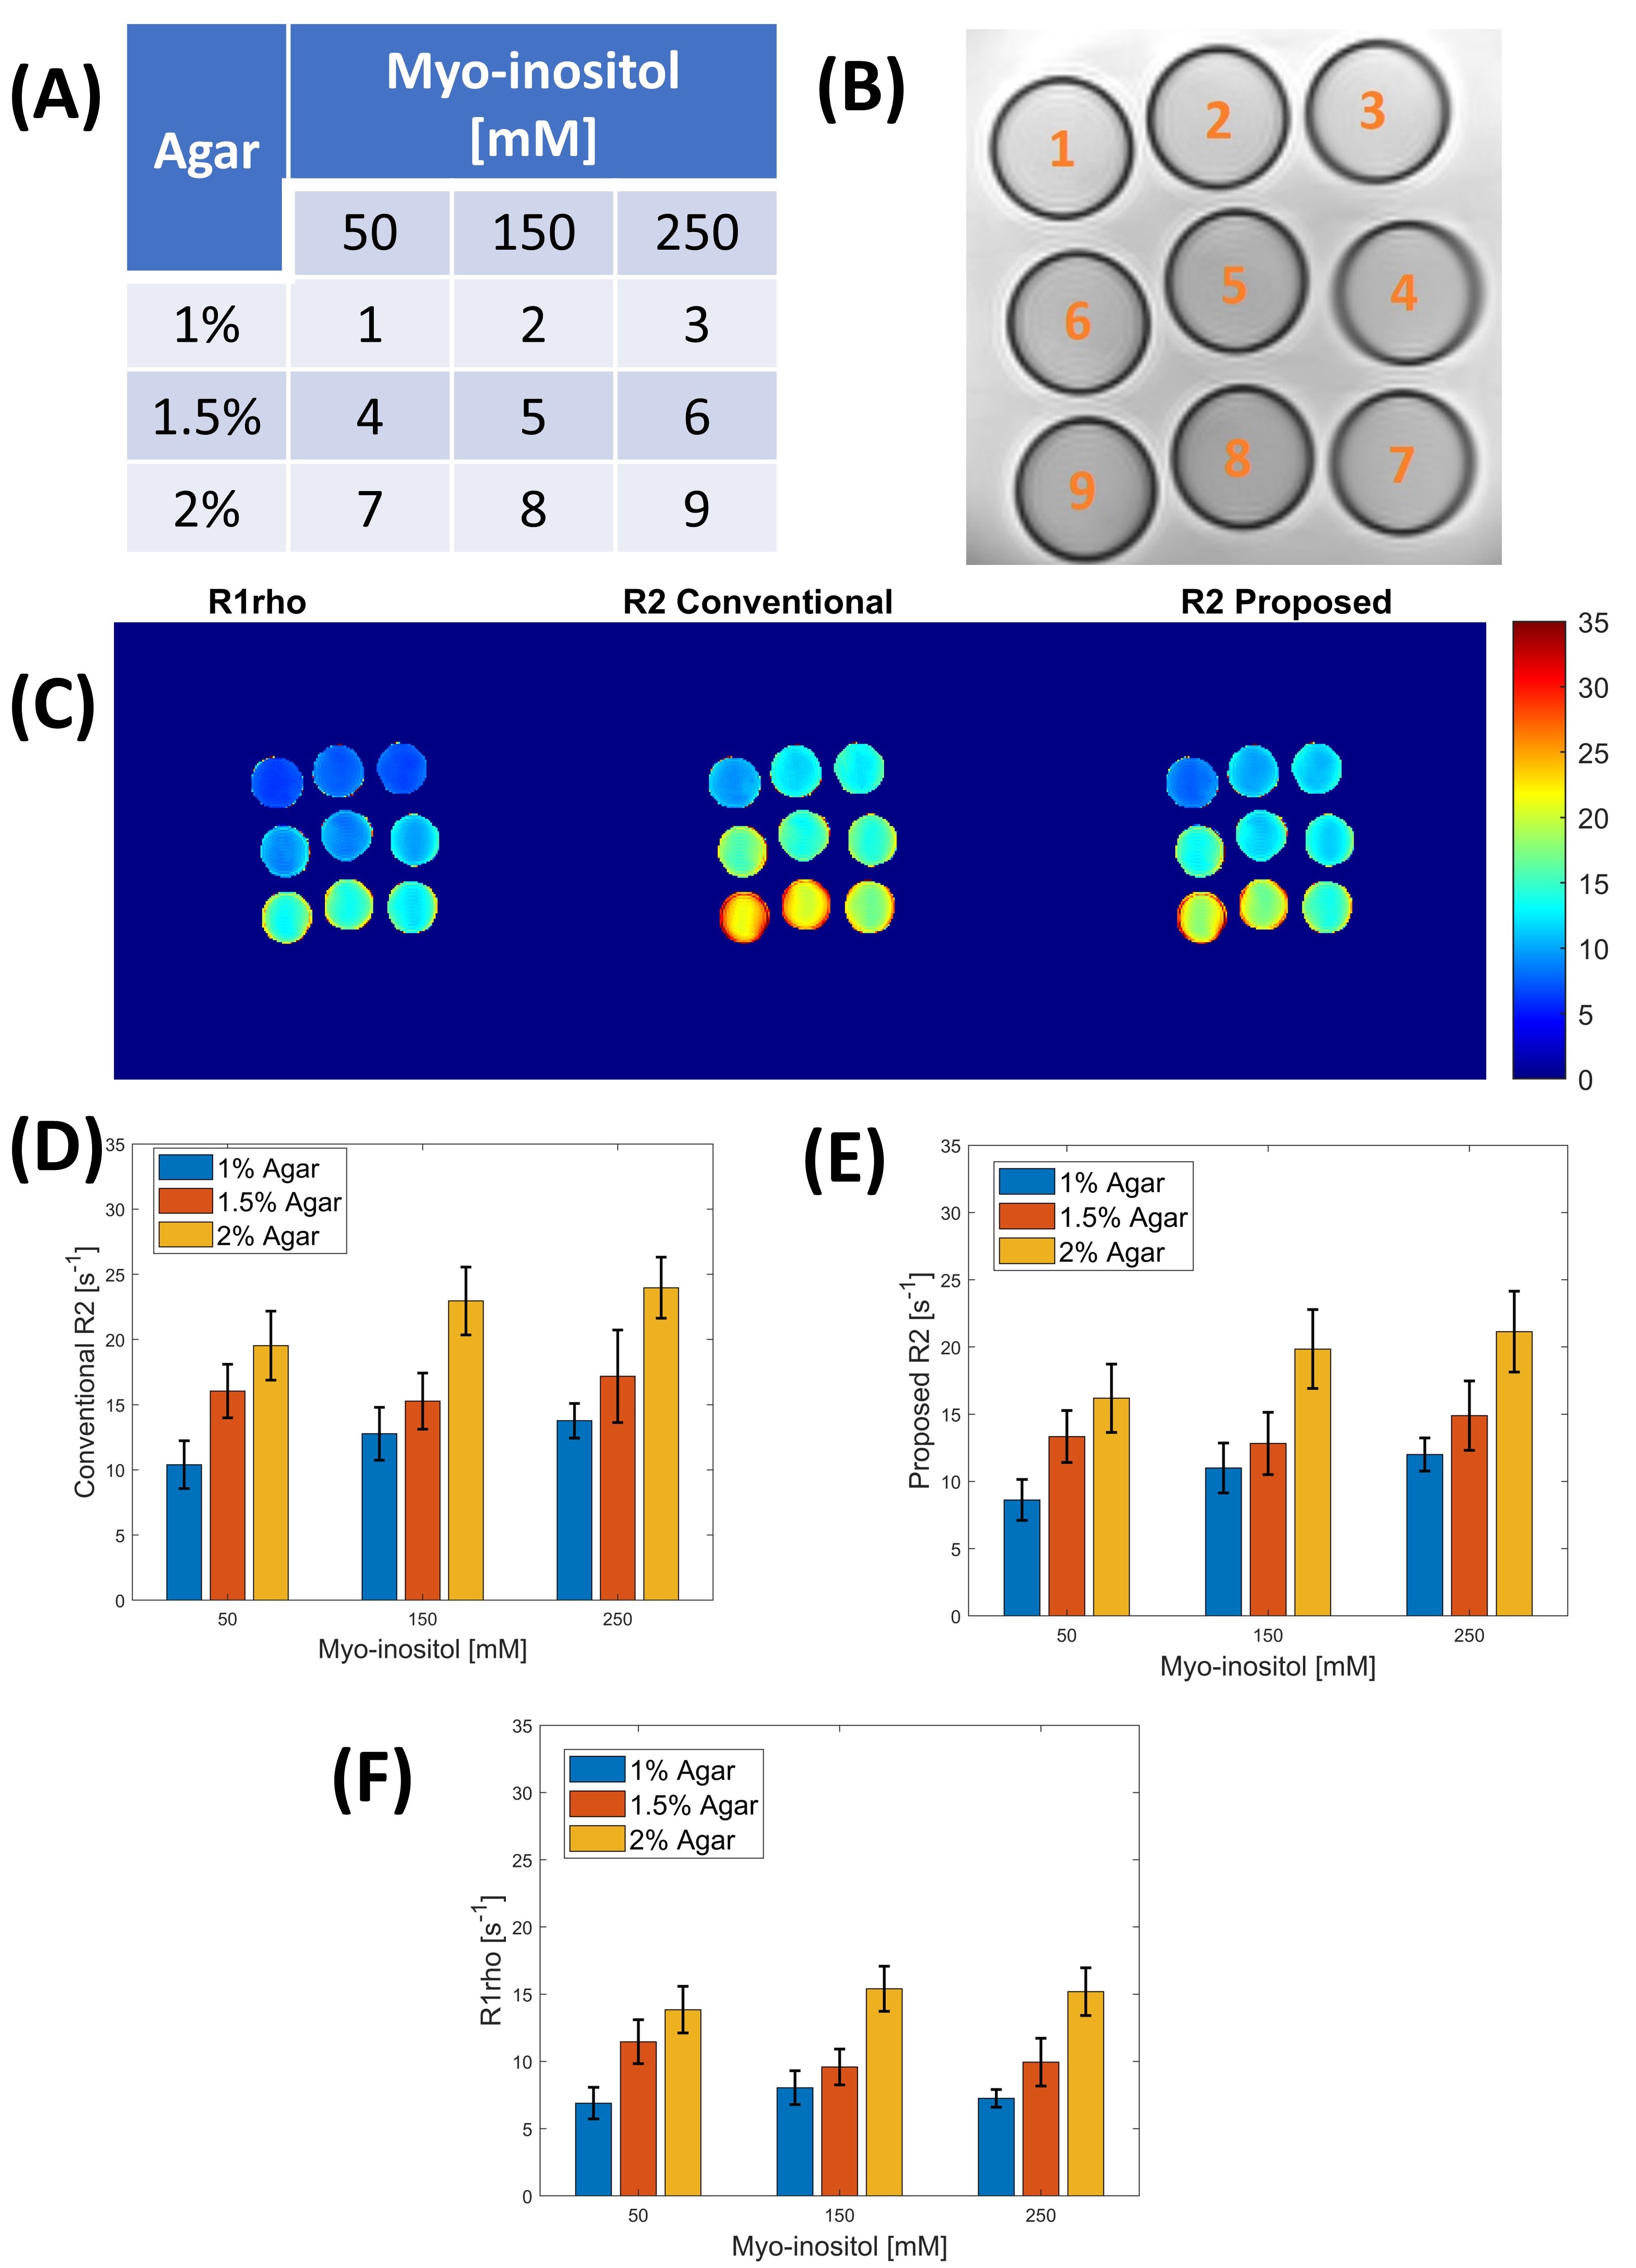
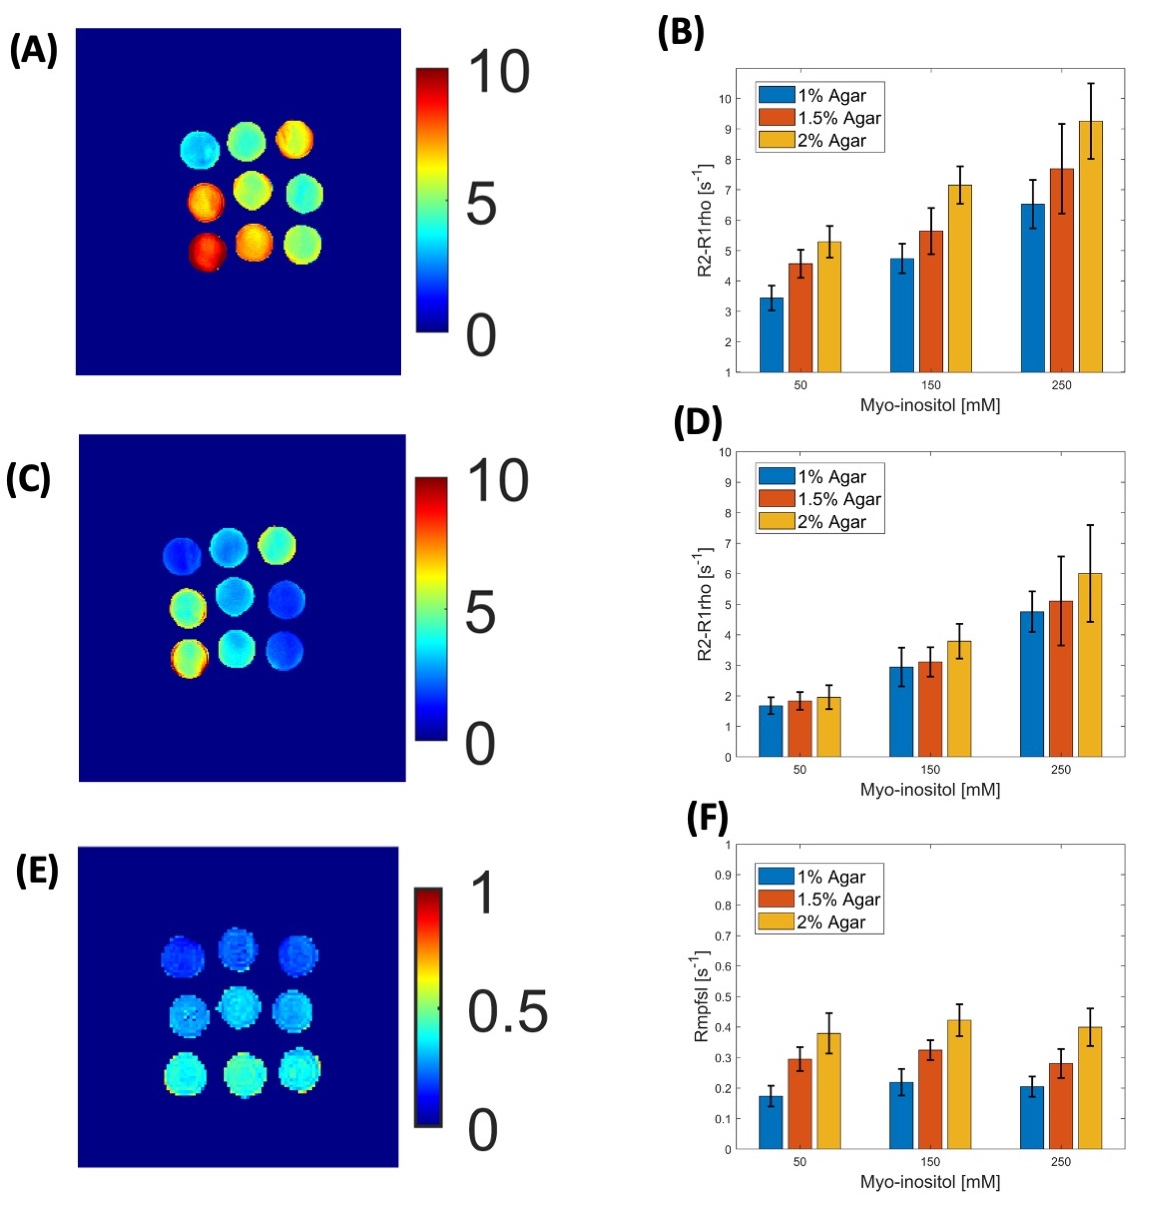
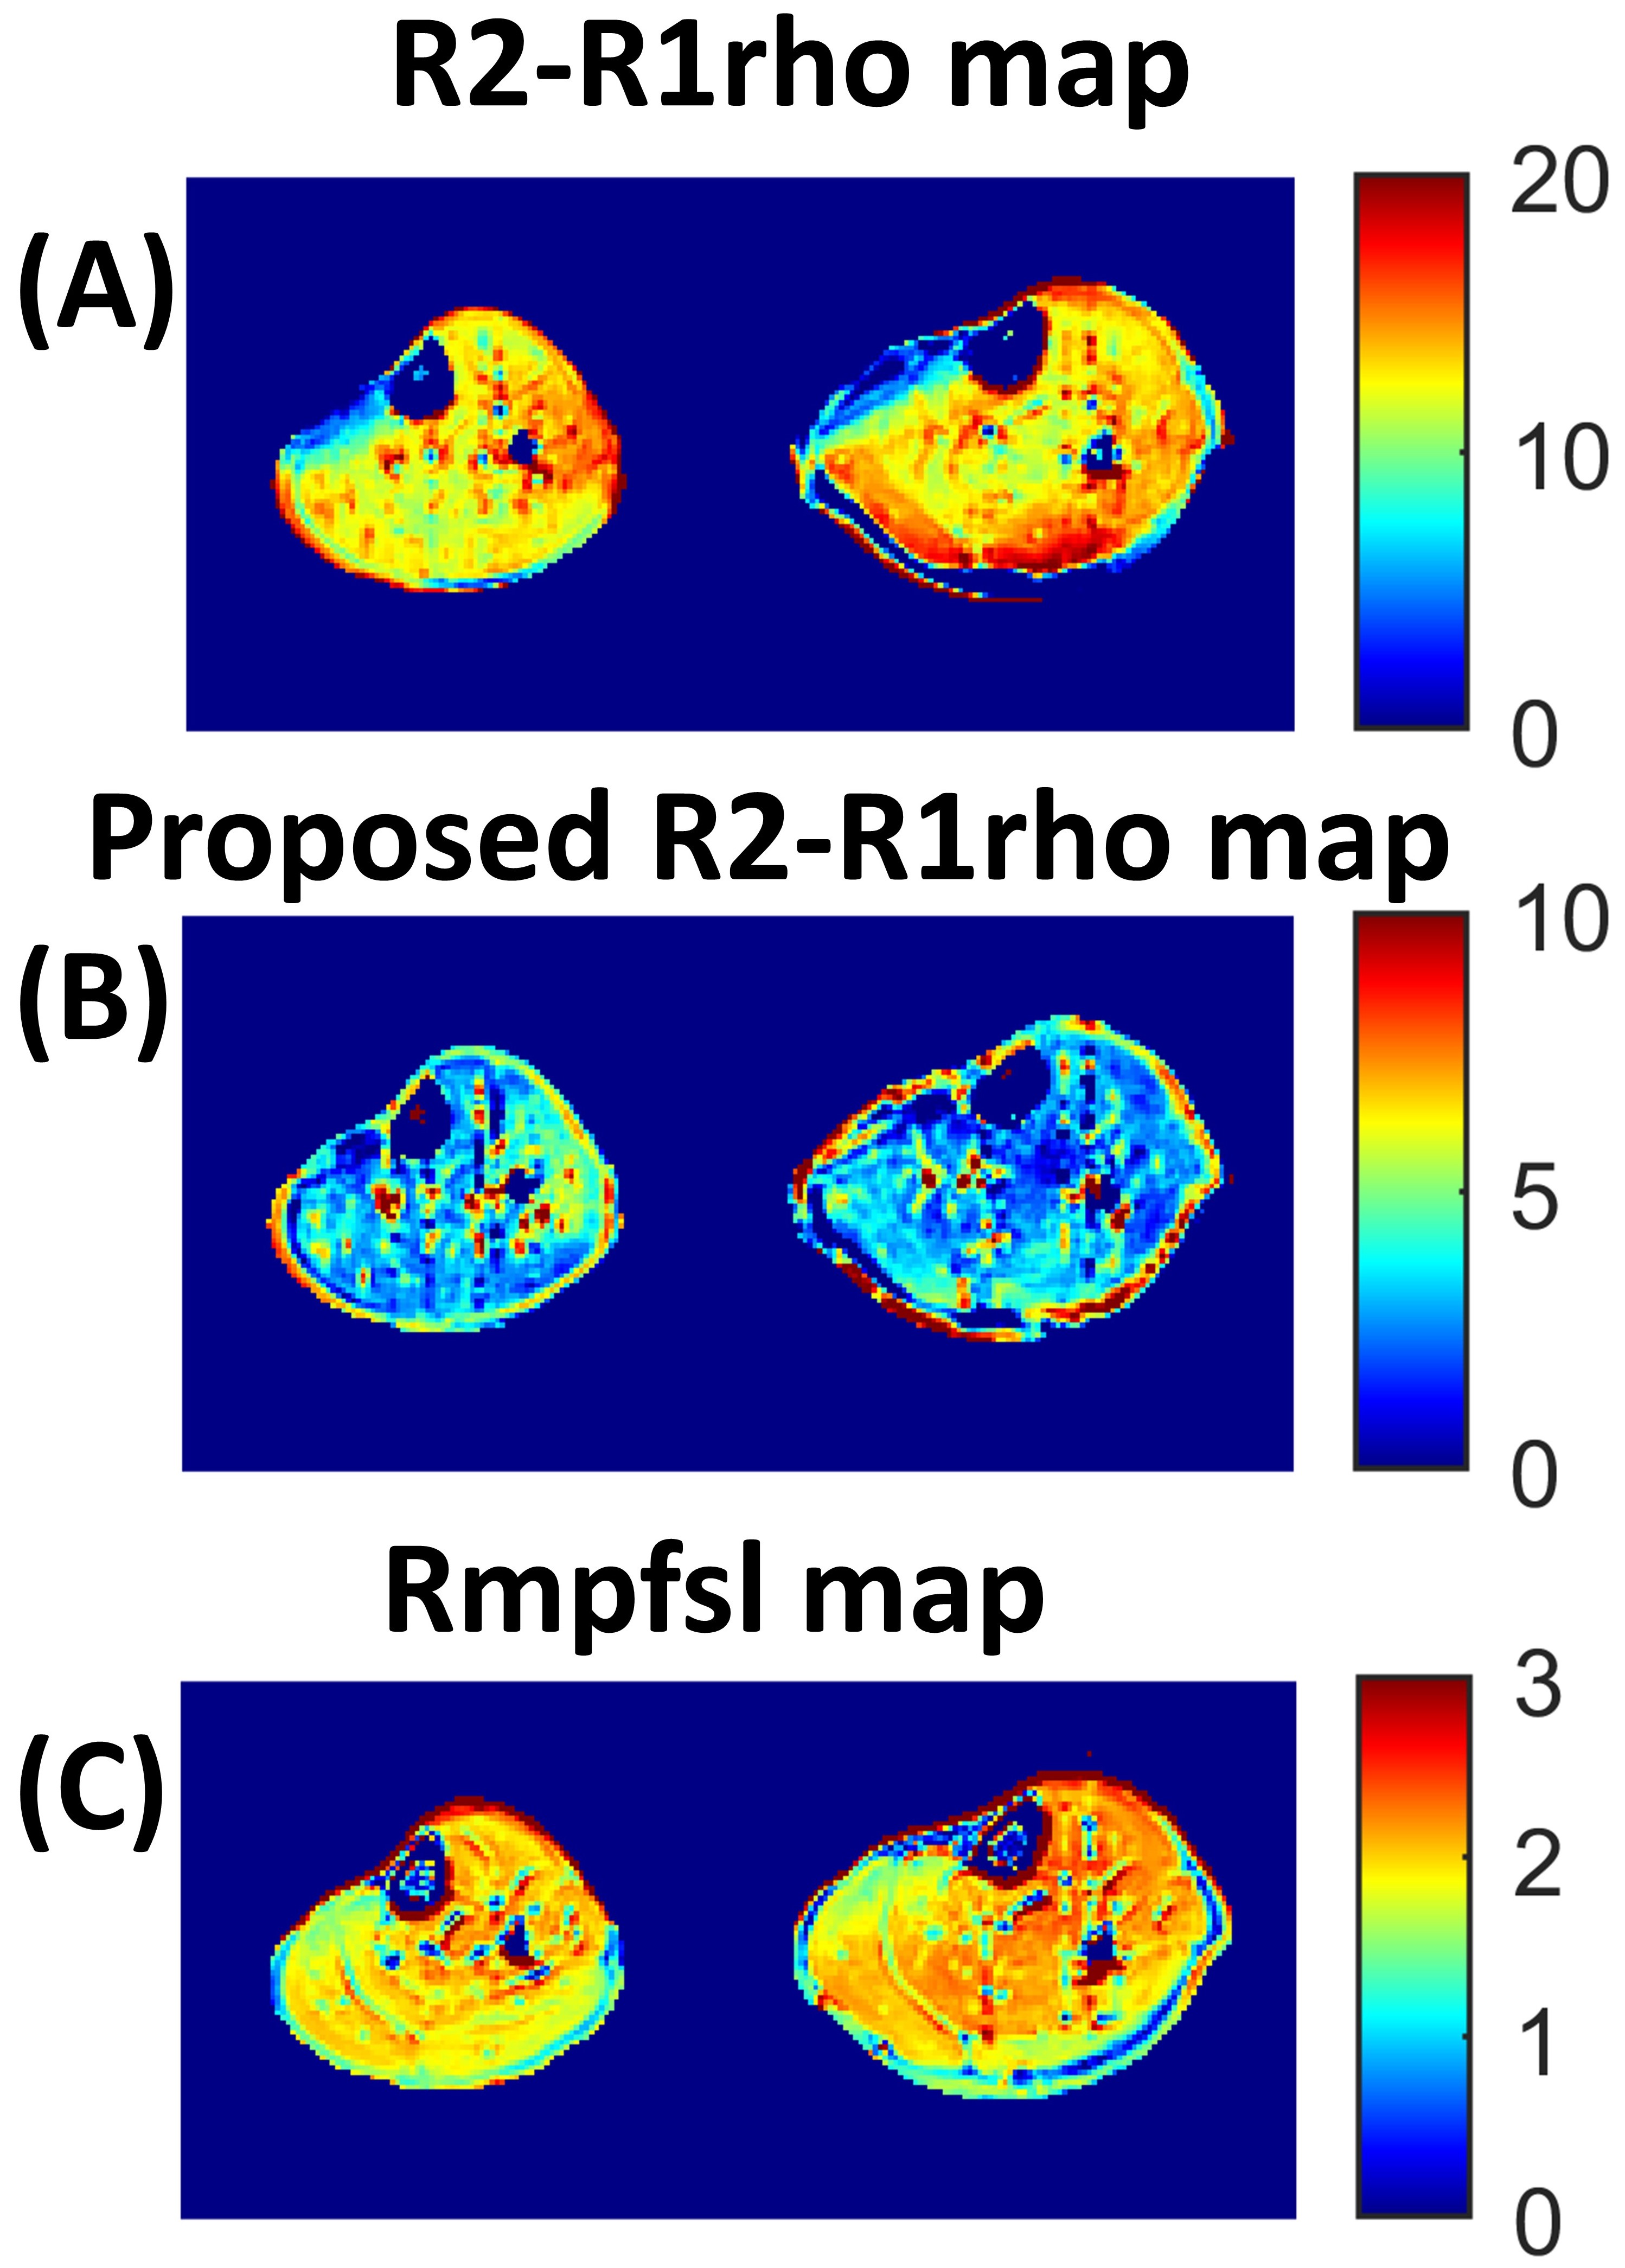
Three-pool (water, chemical exchange, and MT pool) simulation were performed. Various concentration of myo-inositol and agar-mixed phantoms were used to represent the different chemical exchange and MT pool size. Two healthy young volunteers (males, age: 26 and 29 years old, BMI: 21.9 and 23.2 kg/m2) were recruited to scan calf muscle as a preliminary in-vivo validation. All MRI scans in this study were conducted using a 3.0T MRI scanner (Siemens Prisma; Siemens Healthcare, Erlangen, Germany). A 64-channel head coil (Siemens Healthcare, Erlangen, Germany) was used as the receiver for phantom experiments. The in-vivo studies were conducted with the approval of the institutional review board. In-vivo data was collected through a 15-channel knee coil (Tx/Rx Knee 15 Flare Coil, QED, LLC). The in-vivo scans were performed three times to validate the repeatability of the proposed method. The imaging parameters for R2 and R1rho include: resolution = 1.7´1.7 mm2; slice thickness = 6 mm; TR/TE = 4000/10 ms; Echo spacing time is 4 and 12 ms, and the number of refocusing pulses kept at 4; Time of Spin-Lock (TSL) = 0 and 60 ms; FSL = 500 Hz, 2D TSE acquisition with echo train length 9. The relaxation rate Rmpfsl6 was acquired to quantify the influence of MT pool. The imaging parameters to obtain Rmpfsl include: resolution = 2 × 2mm2; slice thickness = 7 mm; TR/TE =The imaging parameters to obtain Rmpfsl include: resolution = 2 × 2mm2; slice thickness = 7 mm; TR/TE =4000/10 ms; TSL = 50 ms; FSL = 100 and 400 Hz, frequency offset = 1000 and 4000 Hz. Vendor-provided B0 shimming tool and volume-selective B1 shimming were used to reduce field inhomogeneity.
Results
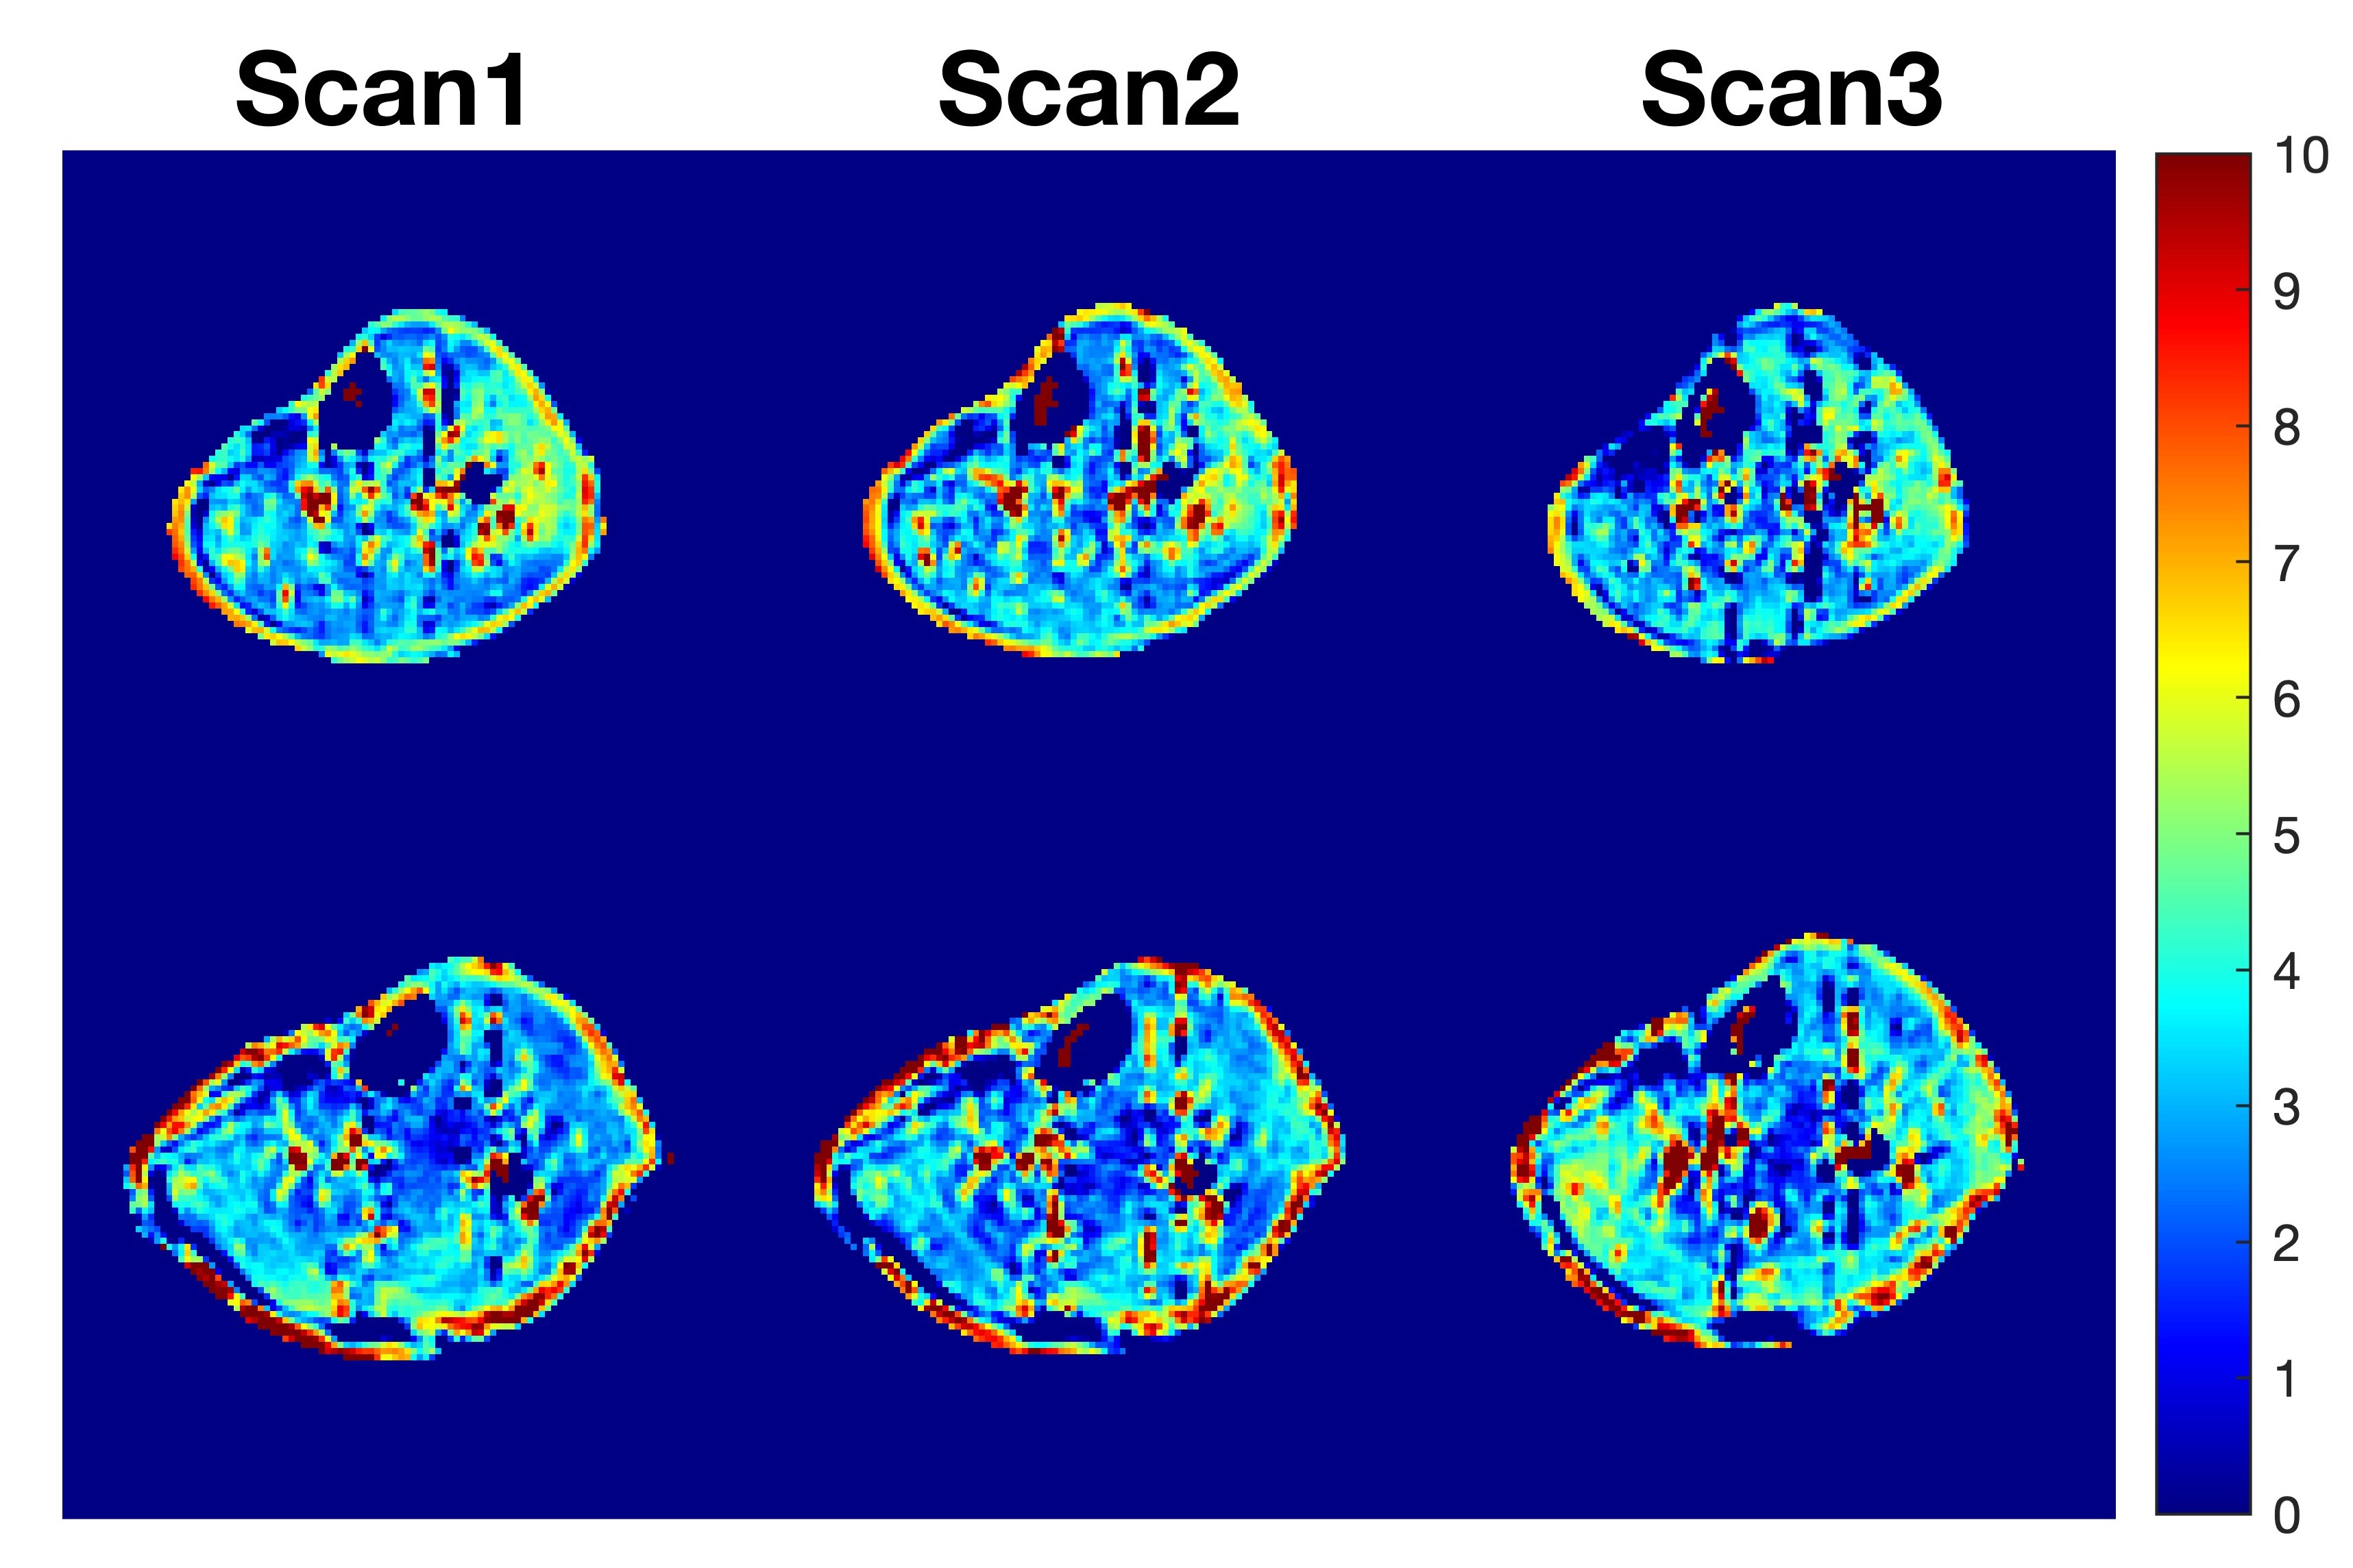
Figure 1 to Figure 3 show the results of the simulation and phantom experiments. Compared with the conventional method, the results from the proposed R2−R1rho were mainly influenced by the CE pool and myo-inositol concentration change. Proposed R2-R1rho results were merely affected by the MT pool and agar concentration change.In-vivo left leg calf muscle from two healthy volunteers study results were shown in Figure 4. The Theproposed R2−R1rho and Rmpfsl maps did not show regional correlations, likely due to the elimination of MT effect in the proposed R2-R1rho approach. The in-vivo repeatability scan results of the proposed method were demonstrated in Figure 5. No significant difference was observed between each scan.Discussion and Conclusion
In this work, we investigated the influence of MT effect on composite metric R2-R1rho and proposed a method to remove this influence. The results demonstrated the proposed R2-R1rho has improved specificity to the chemical exchange effect and less influenced by the MT effect, compared to the conventional method. Note that the echo spacing time variation can lead to a difference in the measured R2. Thus, care needs to be used to optimize imaging parameters for the proposed method.Acknowledgements
This study was supported by a grant from the Innovation and Technology Commission of the Hong Kong SAR (Project MRP/046/20X).References
- Russell C, Pedoia V, Majumdar S, Consortium A-A. Composite metric R2–R1rho (1/T2–1/T1rho) as a potential MR imaging biomarker associated with changes in pain after ACL reconstruction: A six-month follow-up. J Orthop Res. 2016;35:718-729.
- Pedoia V, Haefeli J, Morioka K, et al. MRI and biomechanics multidimensional data analysis reveals R2–R1ρ as an early predictor of cartilage lesion progression in knee osteoarthritis. J Magn Reson Imaging. 2018;47:78-90.
- Santyr, G. E., Henkelman, R. M., Bronskill, M. J. Variation in measured transverse relaxation in tissue resulting from spin locking with the CPMG sequence. Journal of Magnetic Resonance. 1988;79(1), 28–44.
- Foltz WD, Stainsby JA, Wright GA. T2 accuracy on a whole-body imager. Magn Reson Med. 1997;38:759-768.
- Sled JG, Pike GB. Correction for B(1) and B(0) variations in quantitative T(2) measurements using MRI. Magn Reson Med. 2000;43(4):589-93.
- Hou, J., Wong, V. W., Jiang, B., et al. Macromolecular proton fraction mapping based on spin‐lock magnetic resonance imaging. Magnetic Resonance in Medicine, 2020; 84(6), 3157–3171.
Figures