2175
Myelin water fraction mapping of in-vivo and ex-vivo human brains at 3T and 7T1Key Laboratory for Biomedical Engineering of Ministry of Education, Department of Biomedical Engineering, College of Biomedical Engineering & Instrument Science, Zhejiang University, Hangzhou, China, 2China Brain Bank and Department of Neurology in Second Affiliated Hospital, Key Laboratory of Medical Neurobiology of Zhejiang Province, and Department of Neurobiology, Zhejiang University School of Medicine, Hangzhou, China, 3Department of Pathology, The First Affiliated Hospital and School of Medicine, Zhejiang University, Hangzhou, China
Synopsis
Keywords: Relaxometry, Multi-Contrast, Myelin Water Imaging
Motivation: Multi-echo gradient-echo (mGRE) MRI enabled non-invasive quantification of myelin water fraction (MWF) of the human brain.
Goal(s): The MWF may depend on field strength that changes the T2* decay and the results need to be verified by histological staining.
Approach: We performed mGRE-based MWF on in-vivo and ex-vivo human brain at high resolution and revealed the accuracy of the measurements using histological staining at both 3T and 7T.
Results: The MWF-derived from 7T was systematically higher than those from 3T and the in-vivo and ex-vivo measurements showed good agreement. The MWF at 3T and 7T both demonstrated good correlations with myelin basic protein.
Impact: These findings indicated the MWF mapping could reliably depict the myelin content in the human brain, although the measurement were field-strength dependent.
Introduction
Multi-echo gradient-echo (mGRE) imaging has been used to investigate myelin water fraction (MWF)1. However, the measurement may depend on field strength as the T2* relaxation time of myelin and other tissue components changed at different fields and its accuracy has not been directly validated in the human brain to date2. For validation, typically approach is to compare the in-vivo MWF measurements and histology on ex-vivo samples. Yet the death and fixation of ex-vivo samples may introduce a bias3. In this work, we collected high-resolution 3D mGRE data of five ex-vivo and five in-vivo human brains at 3T and 7T to characterized the differences in MWF under different field strengths and used histological staining to validate the accuracy of 3T versus 7T measurements.Methods
Data AcquisitionFive ex-vivo brain samples (right hemisphere) and five in-vivo healthy volunteers underwent 3T and 7T scans using a 3D bipolar readout mGRE sequence. The 3T data was acquired on a Siemens Prisma scanner with following parameters at spatial resolution = 1×1×1 mm3, TR = 65 ms, TE1 = 2.41 ms, ΔTE = 1.4 ms, number of echoes = 32, and flip angle (FA) = 20°. The 7T data was acquired on a Magnetom 7T scanner with the same resolution, TR = 52 ms, TE1 = 2.56 ms, ΔTE = 1.46 ms, number of echoes = 32, and FA = 20°.
Myelin water fraction estimation
The MWF estimation pipeline was demonstrated in Fig.1. The mGRE magnitude were denoised using a non-local means filter4 and corrected for B0 inhomogeneity using voxel spread function5, 6, and the mGRE phase were eliminated bipolar using a linear regression7. The signal was synthesized with the corrected magnitude M(t) and magnetic susceptibility χ(t) as follows8-10:
$$S(t) =M(t)\exp(-i\frac{2}{3}\chi(t)B_{0}t)$$
where γ is the gyromagnetic ratio of hydrogen and 𝐵0 is the static field strength.
Compartments of the complex signal were modelled using the complex three-pool model for the mGRE T2* data (3CCT2*) 9:
$$S(t) =[A_{my}\exp(-(1/T_{2,my}^*+j2\pi f_{my})t)+A_{ax}\exp(-(1/T_{2,ax}^*+j2\pi f_{ax})t)+A_{ex}\exp(-(1/T_{2,ex}^*+j2\pi f_{ex})t)]exp(j\phi_{0})$$
where Amy, Aax and Aex are the amplitudes of the myelin, intra- and extra-axon components, T2,*my, T2,*ax and T2,*ex are T2* values of the three water components, and fmy, fax and fex are the frequency offsets of the three water components. The MWF calculated as Amy/(Amy + Aax + Aex).
MWFs derived from 3T and 7T were compared in 19 white matter regions of interest (ROI) by atlas-based segmentation11, 12.
Histological Validation
After ex-vivo MRI, two micron-thick sections of selected tissue blocks of a brain sample were immunohistochemically stained for myelin basic protein (MBP). The MBP images were quantified and co-registered to the MWF image for pixel-wise correlation, using the Advanced Normalization Tools13.
Results
Most brain regions showed higher MWF values on 7T than 3T in both in-vivo and ex-vivo experiments (Fig.2). ROI-based quantitative analysis showed 3T and 7T MWF measurements had strong correlation in both in-vivo (r = 0.88) and ex-vivo brains (r = 0.83), though the 7T measurement was overall higher (Fig. 3A-B). Bland-Altman plots in Fig. 3C-D indicated the regional patterns of MWF measurements were consistent between 3T and 7T. Comparing the in-vivo and ex-vivo data, MWF of PCT, BCC, SFO were significantly higher in-vivo than ex-vivo at 7T (Mann-Whitney test, p < 0.05, FDR corrected) (Fig.4A&C). Correlation between in-vivo and ex-vivo measurements showed moderate at both 3T (r = 0.61) and 7T (r = 0.54) (Fig.4B&D).Pixel-based correlation analysis showed that MWFs from the ex-vivo brains correlated well with the MBP optical density (OD) images at both 3T (r = 0.68 and 0.78 for the two samples) and 7T (r = 0.64 and 0.82 for the two samples) (Fig.5).
Discussion and Conclusion
We demonstrated the differences of MWF between 3T and 7T in-vivo and ex-vivo. The MWF measured at 7T trended to be higher than 3T but the spatial patterns of MWF across different ROIs were consistent regardless of the field strength, which agreed with the previous study14, 15. In addition, we validated the MWF-based myelin content in the ex vivo human brain for the first time, using spatially coregistered MBP OD staining. The results provided a direct biological support of the mGRE-based MWF study at 3T and 7T.Acknowledgements
This work is supported by the National Natural Science Foundation of China (81971606, 82122032), and Science and Technology Department of Zhejiang Province (2022C03057, 202006140)
References
1. Du, Y.P., et al., Fast multislice mapping of the myelin water fraction using multicompartment analysis of T decay at 3T: A preliminary postmortem study. 2007. 58(5): p. 865-870.
2. Alonso‐Ortiz, E., I.R. Levesque, and G.B. Pike, Multi‐gradient‐echo myelin water fraction imaging: Comparison to the multi‐echo‐spin‐echo technique. Magnetic resonance in medicine, 2018. 79(3): p. 1439-1446.
3. Laule, C., et al., Myelin water imaging of multiple sclerosis at 7 T: Correlations with histopathology. Neuroimage, 2008. 40(4): p. 1575-1580.
4. Alonso-Ortiz, E., I.R. Levesque, and G.B. Pike, Impact of magnetic susceptibility anisotropy at 3 T and 7 T on T2*-based myelin water fraction imaging. Neuroimage, 2018. 182: p. 370-378.
5. Jung, S., et al., Improved multi‐echo gradient echo myelin water fraction mapping using complex‐valued neural network analysis. 2022. 88(1): p. 492-500.
6. Yablonskiy, D.A., et al., Voxel Spread Function Method for Correction of Magnetic Field Inhomogeneity Effects in Quantitative Gradient-Echo-Based MRI. Magnetic Resonance in Medicine, 2013. 70(5): p. 1283-1292.
7. Lee, H., et al., Improved three-dimensional multi-echo gradient echo based myelin water fraction mapping with phase related artifact correction. Neuroimage, 2018. 169: p. 1-10.
8. Chen, J.J., et al., Decompose quantitative susceptibility mapping (QSM) to sub-voxel diamagnetic and paramagnetic components based on gradient-echo MRI data. Neuroimage, 2021. 242: p. 118477.
9. Wu, Z., et al., High resolution myelin water imaging incorporating local tissue susceptibility analysis. Magnetic Resonance Imaging, 2017. 42: p. 107-113.
10. Xu, G., et al., Improved magnetic resonance myelin water imaging using multi-channel denoising convolutional neural networks (MCDnCNN). Quantitative Imaging in Medicine and Surgery, 2022. 12(3): p. 1716.
11. Hua, K., et al., Tract probability maps in stereotaxic spaces: Analyses of white matter anatomy and tract-specific quantification. Neuroimage, 2008. 39(1): p. 336-347.
12. Wakana, S., et al., Reproducibility of quantitative tractography methods applied to cerebral white matter. Neuroimage, 2007. 36(3): p. 630-644.
13. Avants, B.B., N. Tustison, and G.J.I.j. Song, Advanced normalization tools (ANTS). 2009. 2(365): p. 1-35.
14. Shin, H.G., et al., Advances in gradient echo myelin water imaging at 3T and 7T. Neuroimage, 2019. 188: p. 835-844.
15. Wright, P., et al., Water proton T 1 measurements in brain tissue at 7, 3, and 1.5 T using IR-EPI, IR-TSE, and MPRAGE: results and optimization. Magnetic Resonance Materials in Physics, Biology and Medicine, 2008. 21: p. 121-130.
Figures
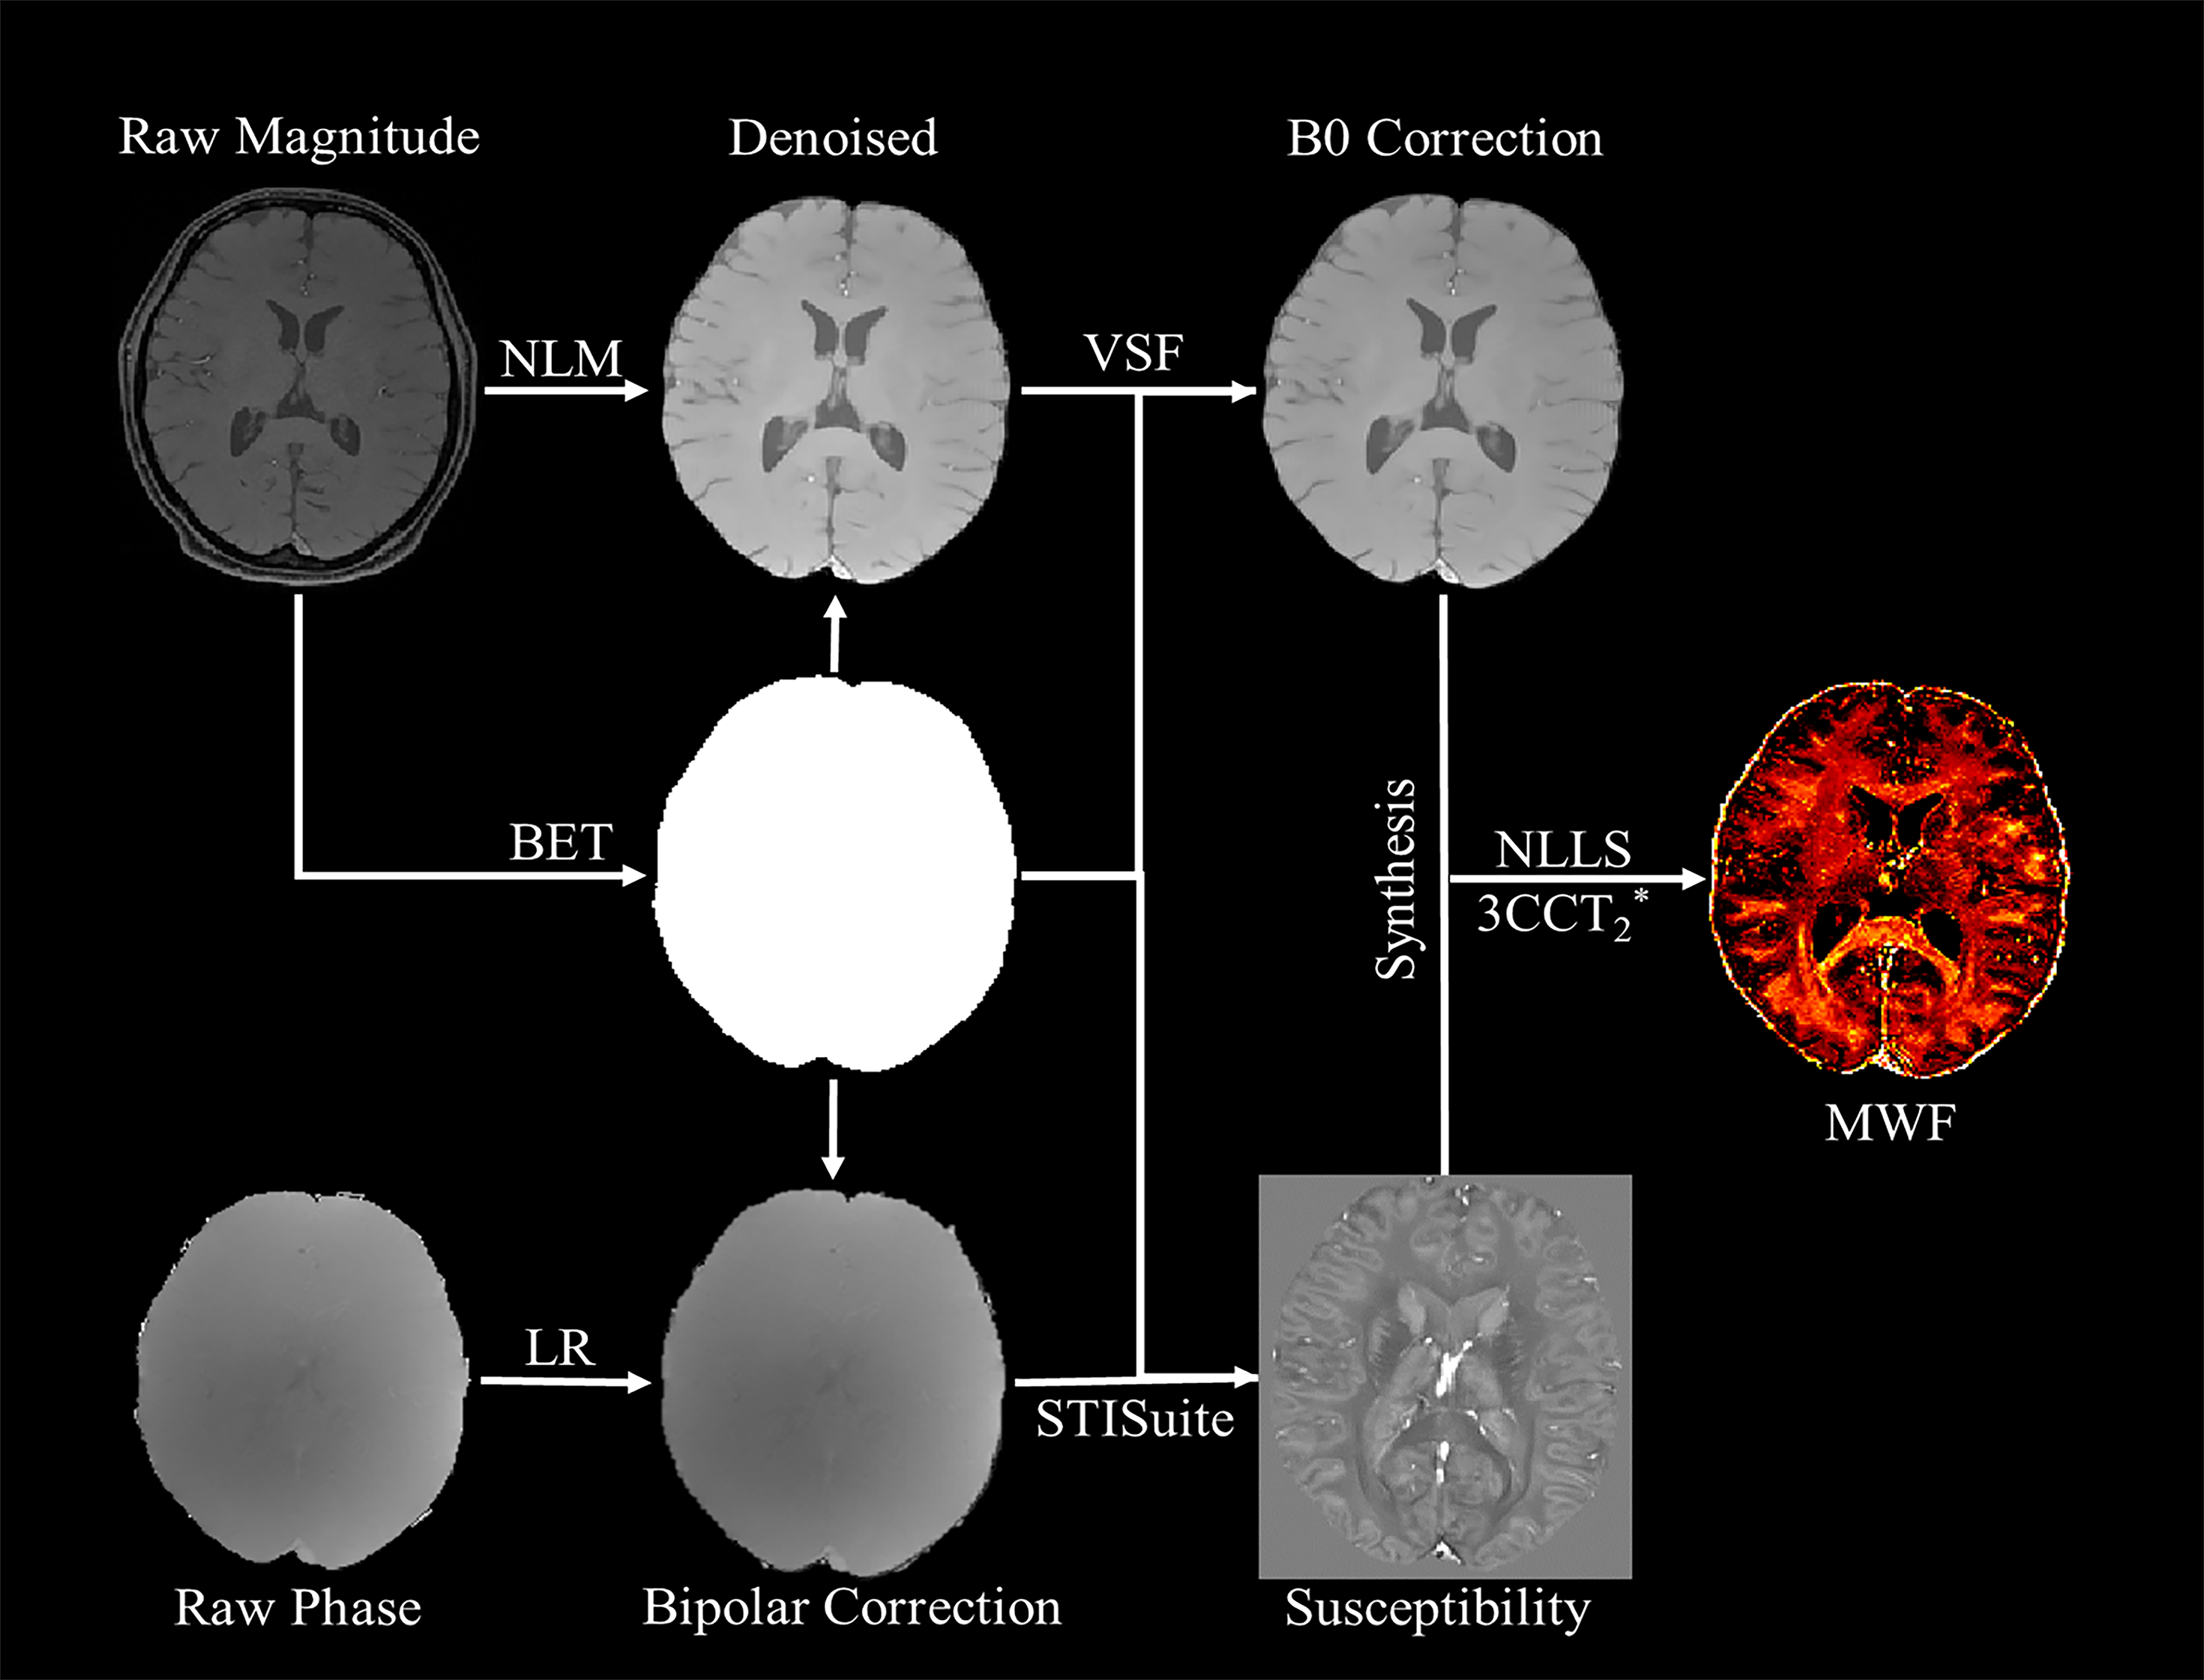
Fig.1.The pipeline of estimating mGRE-based myelin water fraction. NLM: non-local mean; VSF: voxel speared function; LR: linear regression; NLLS: non-linear least square; 3CCT2*: T2* based three compartment complex-valued model.
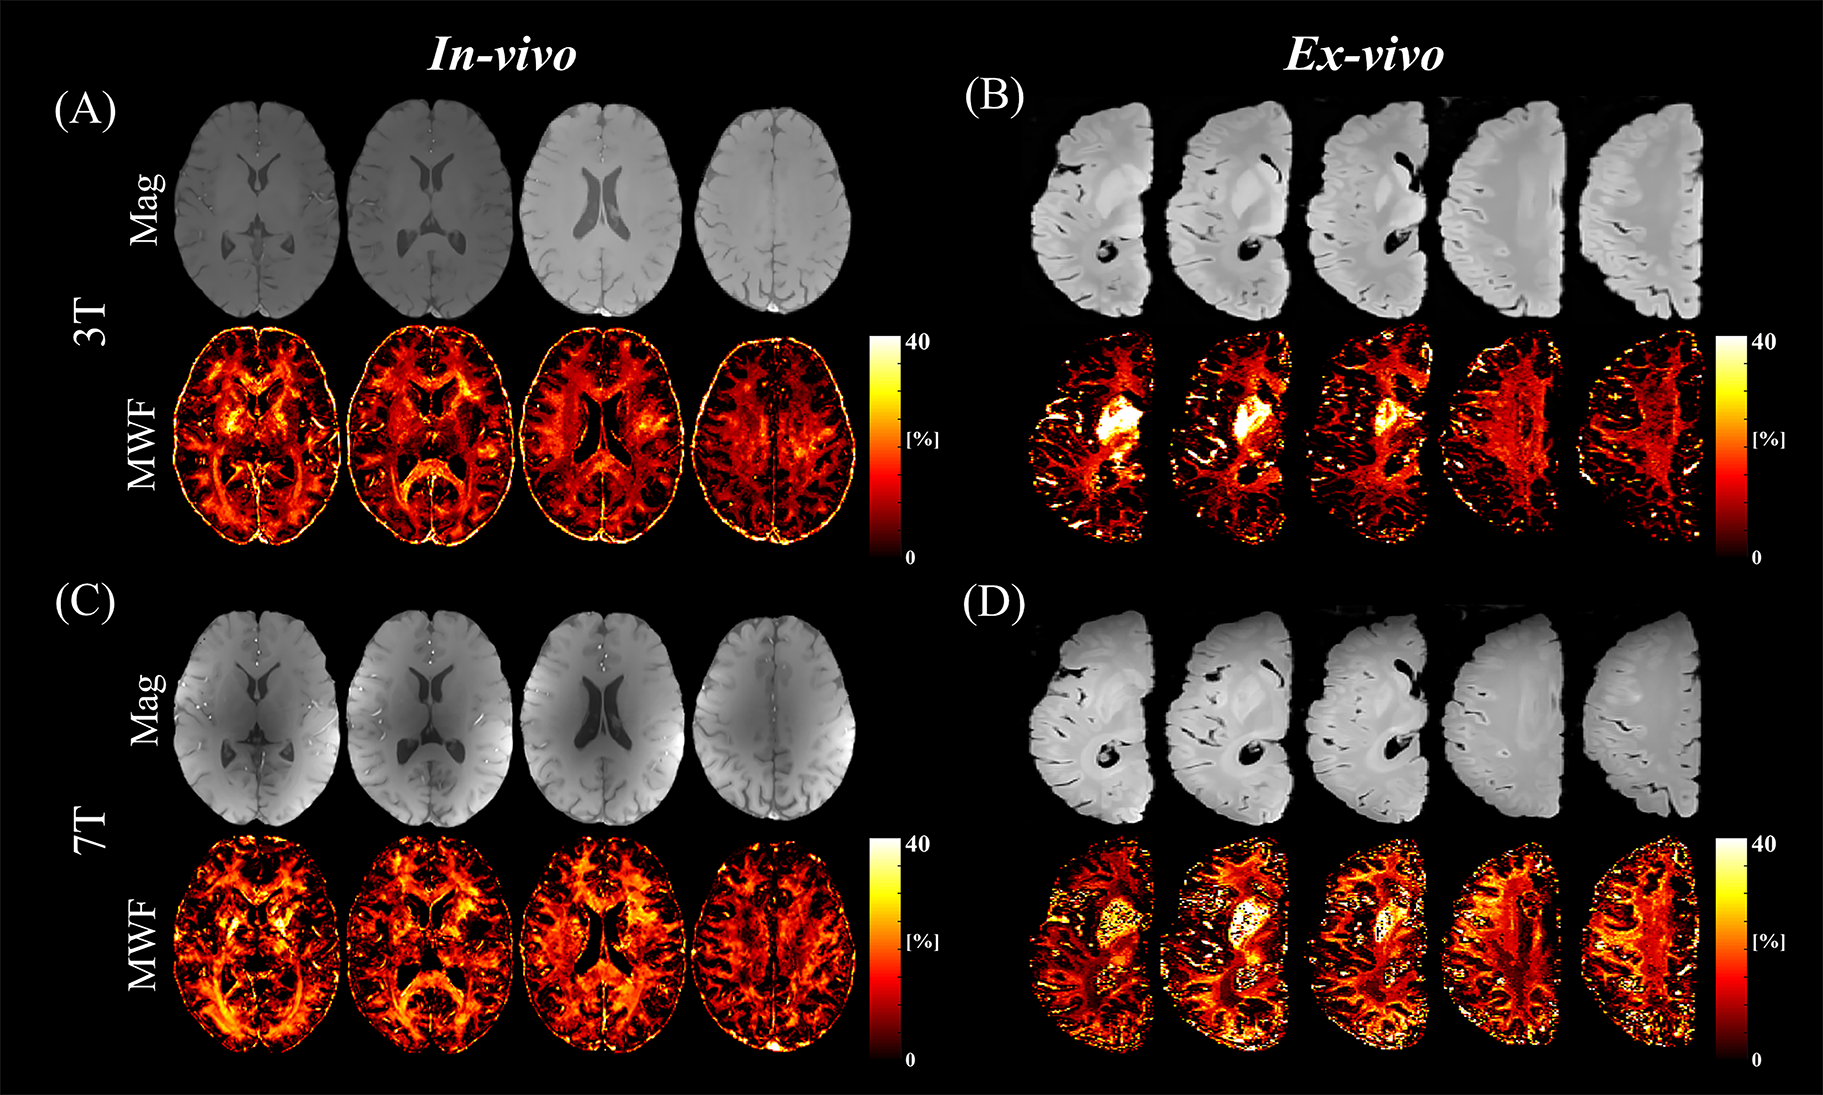
Fig. 2. mGRE images and the fitted MWF maps from in-vivo (A, C) and ex-vivo (B, D) mGRE scans at 3T and 7T. Mag: magnitude images, MWF: myelin water fraction.
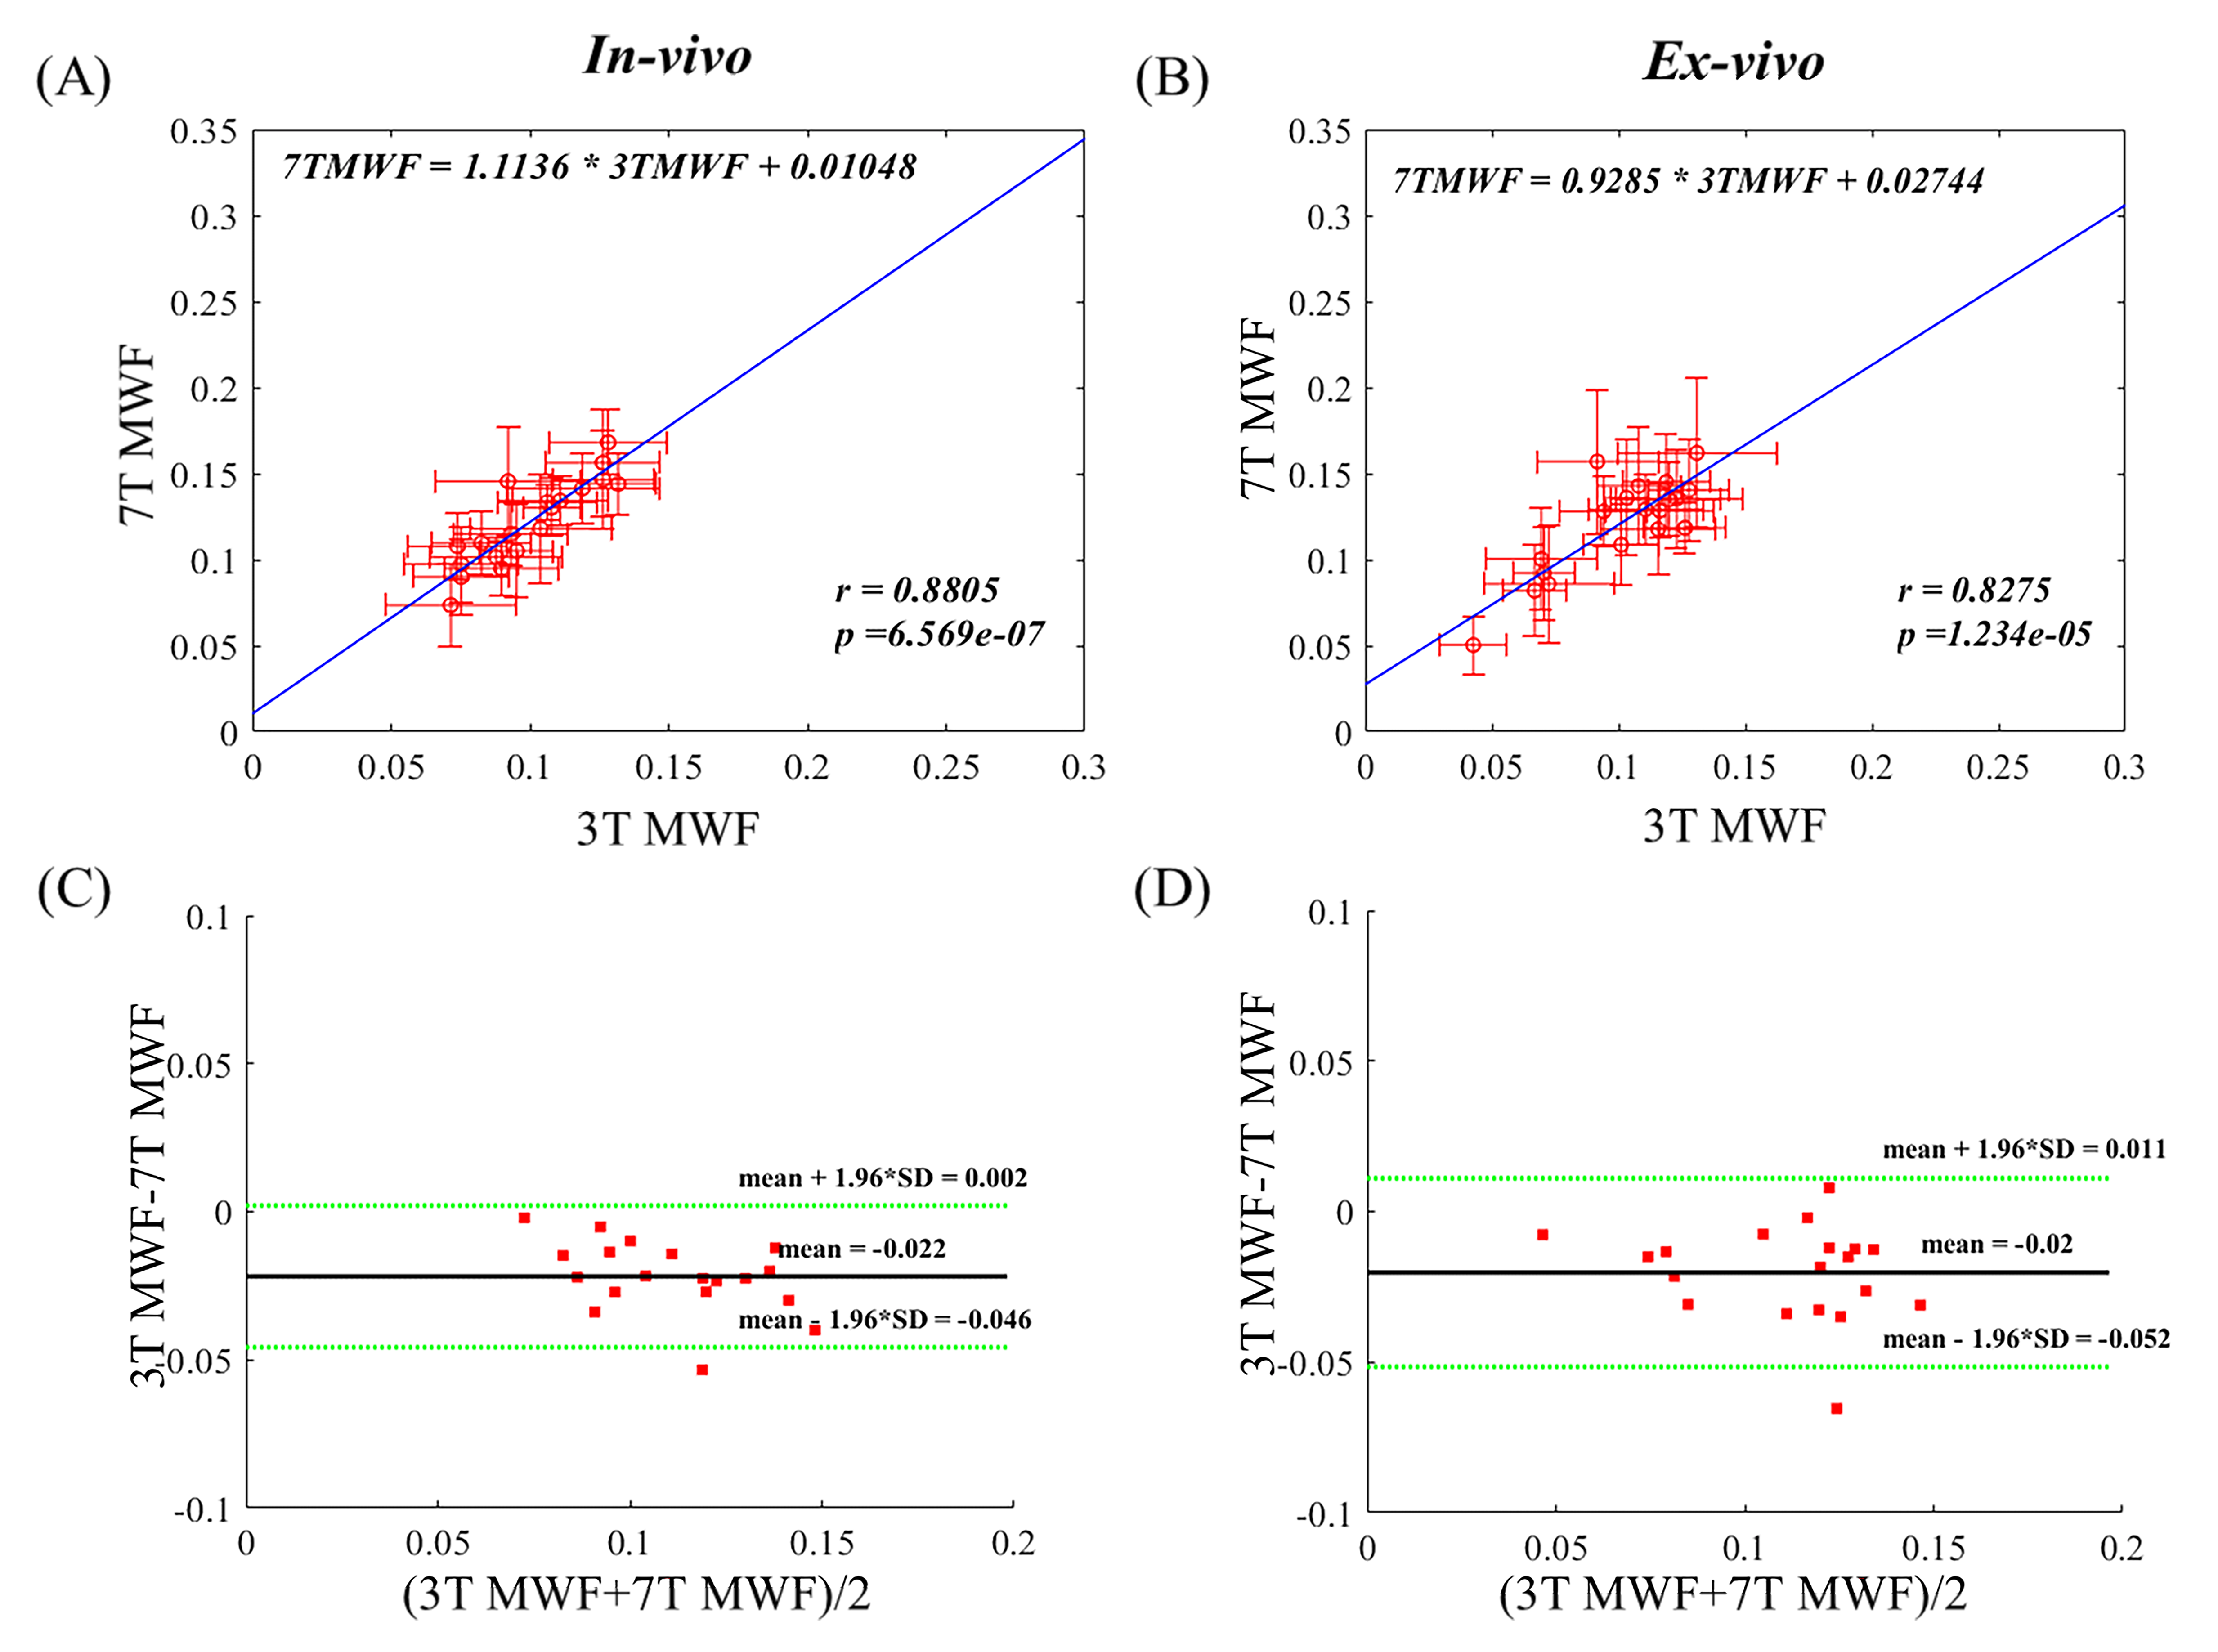
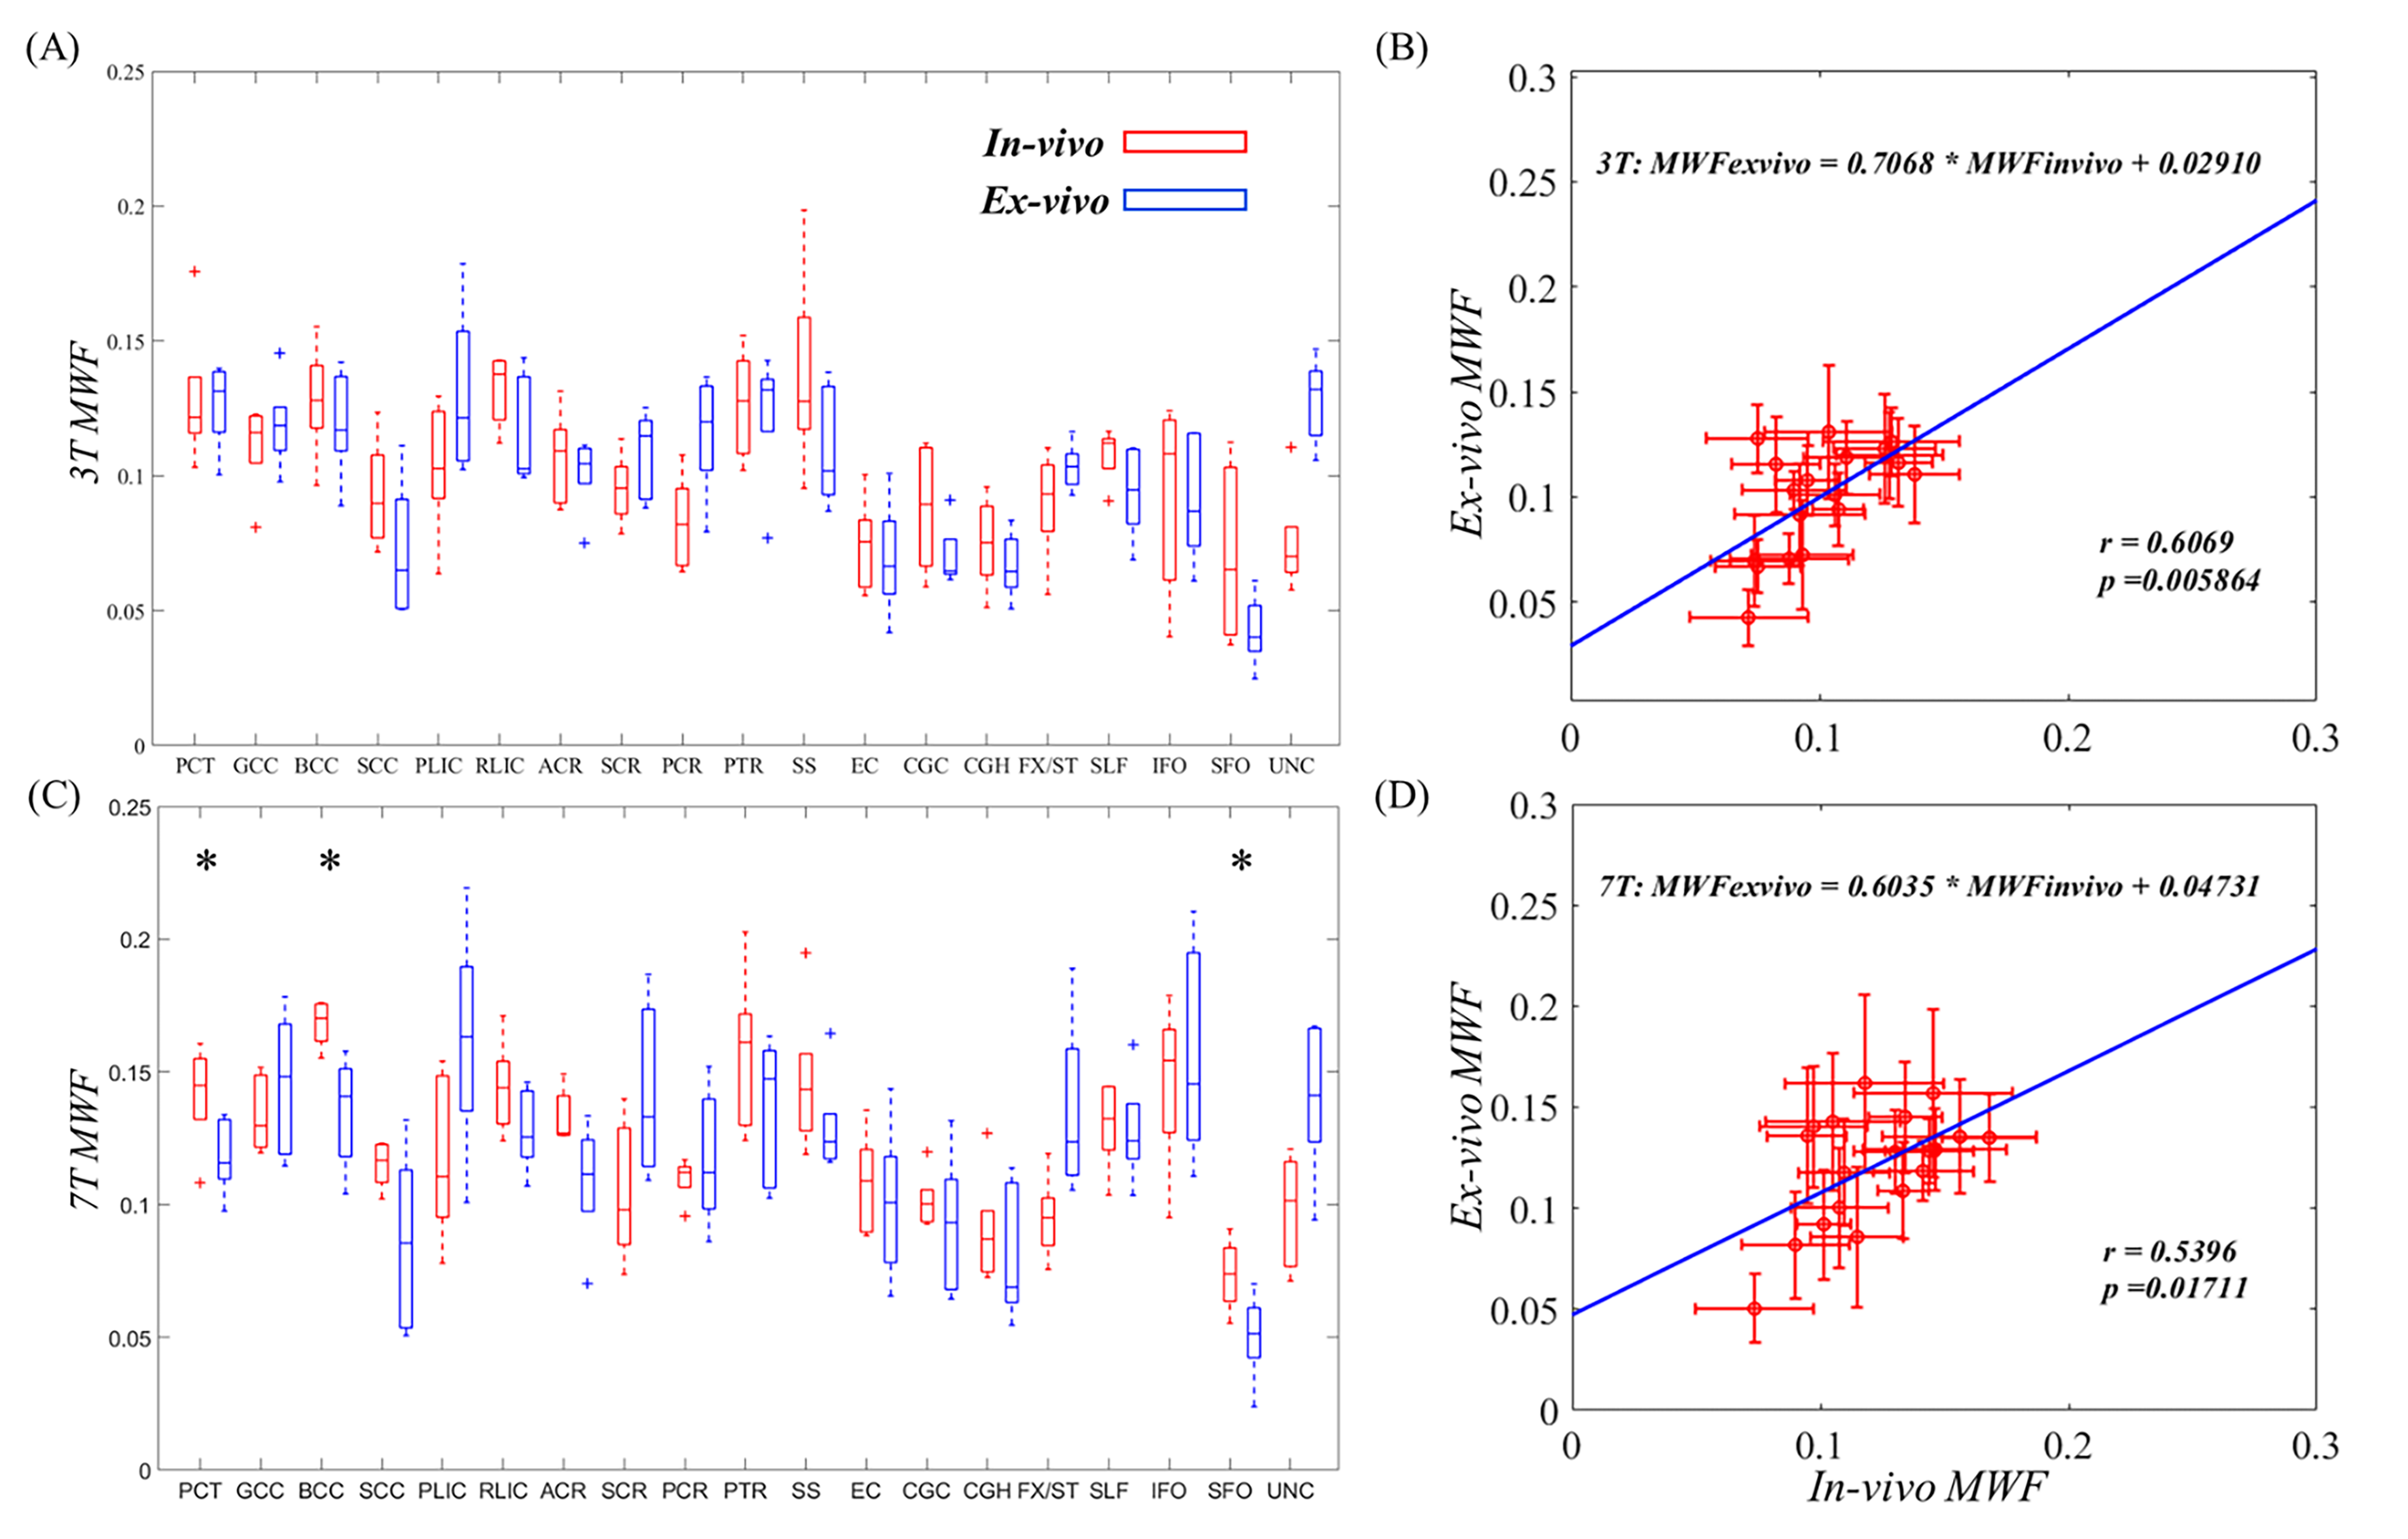
Fig.4. Comparison between in-vivo and ex-vivo MWF measurements (n=5 each group) in 19 white matter ROIs at 3T (A) and 7T (C). Correlation between in-vivo and ex-vivo MWF across 19 white matter ROIs at 3T. Comparison plot for in-vivo and ex-vivo MWF across 5 in-vivo and 5 ex-vivo brains in 19 white matter ROIs measured at 3T (B) or 7T (D).
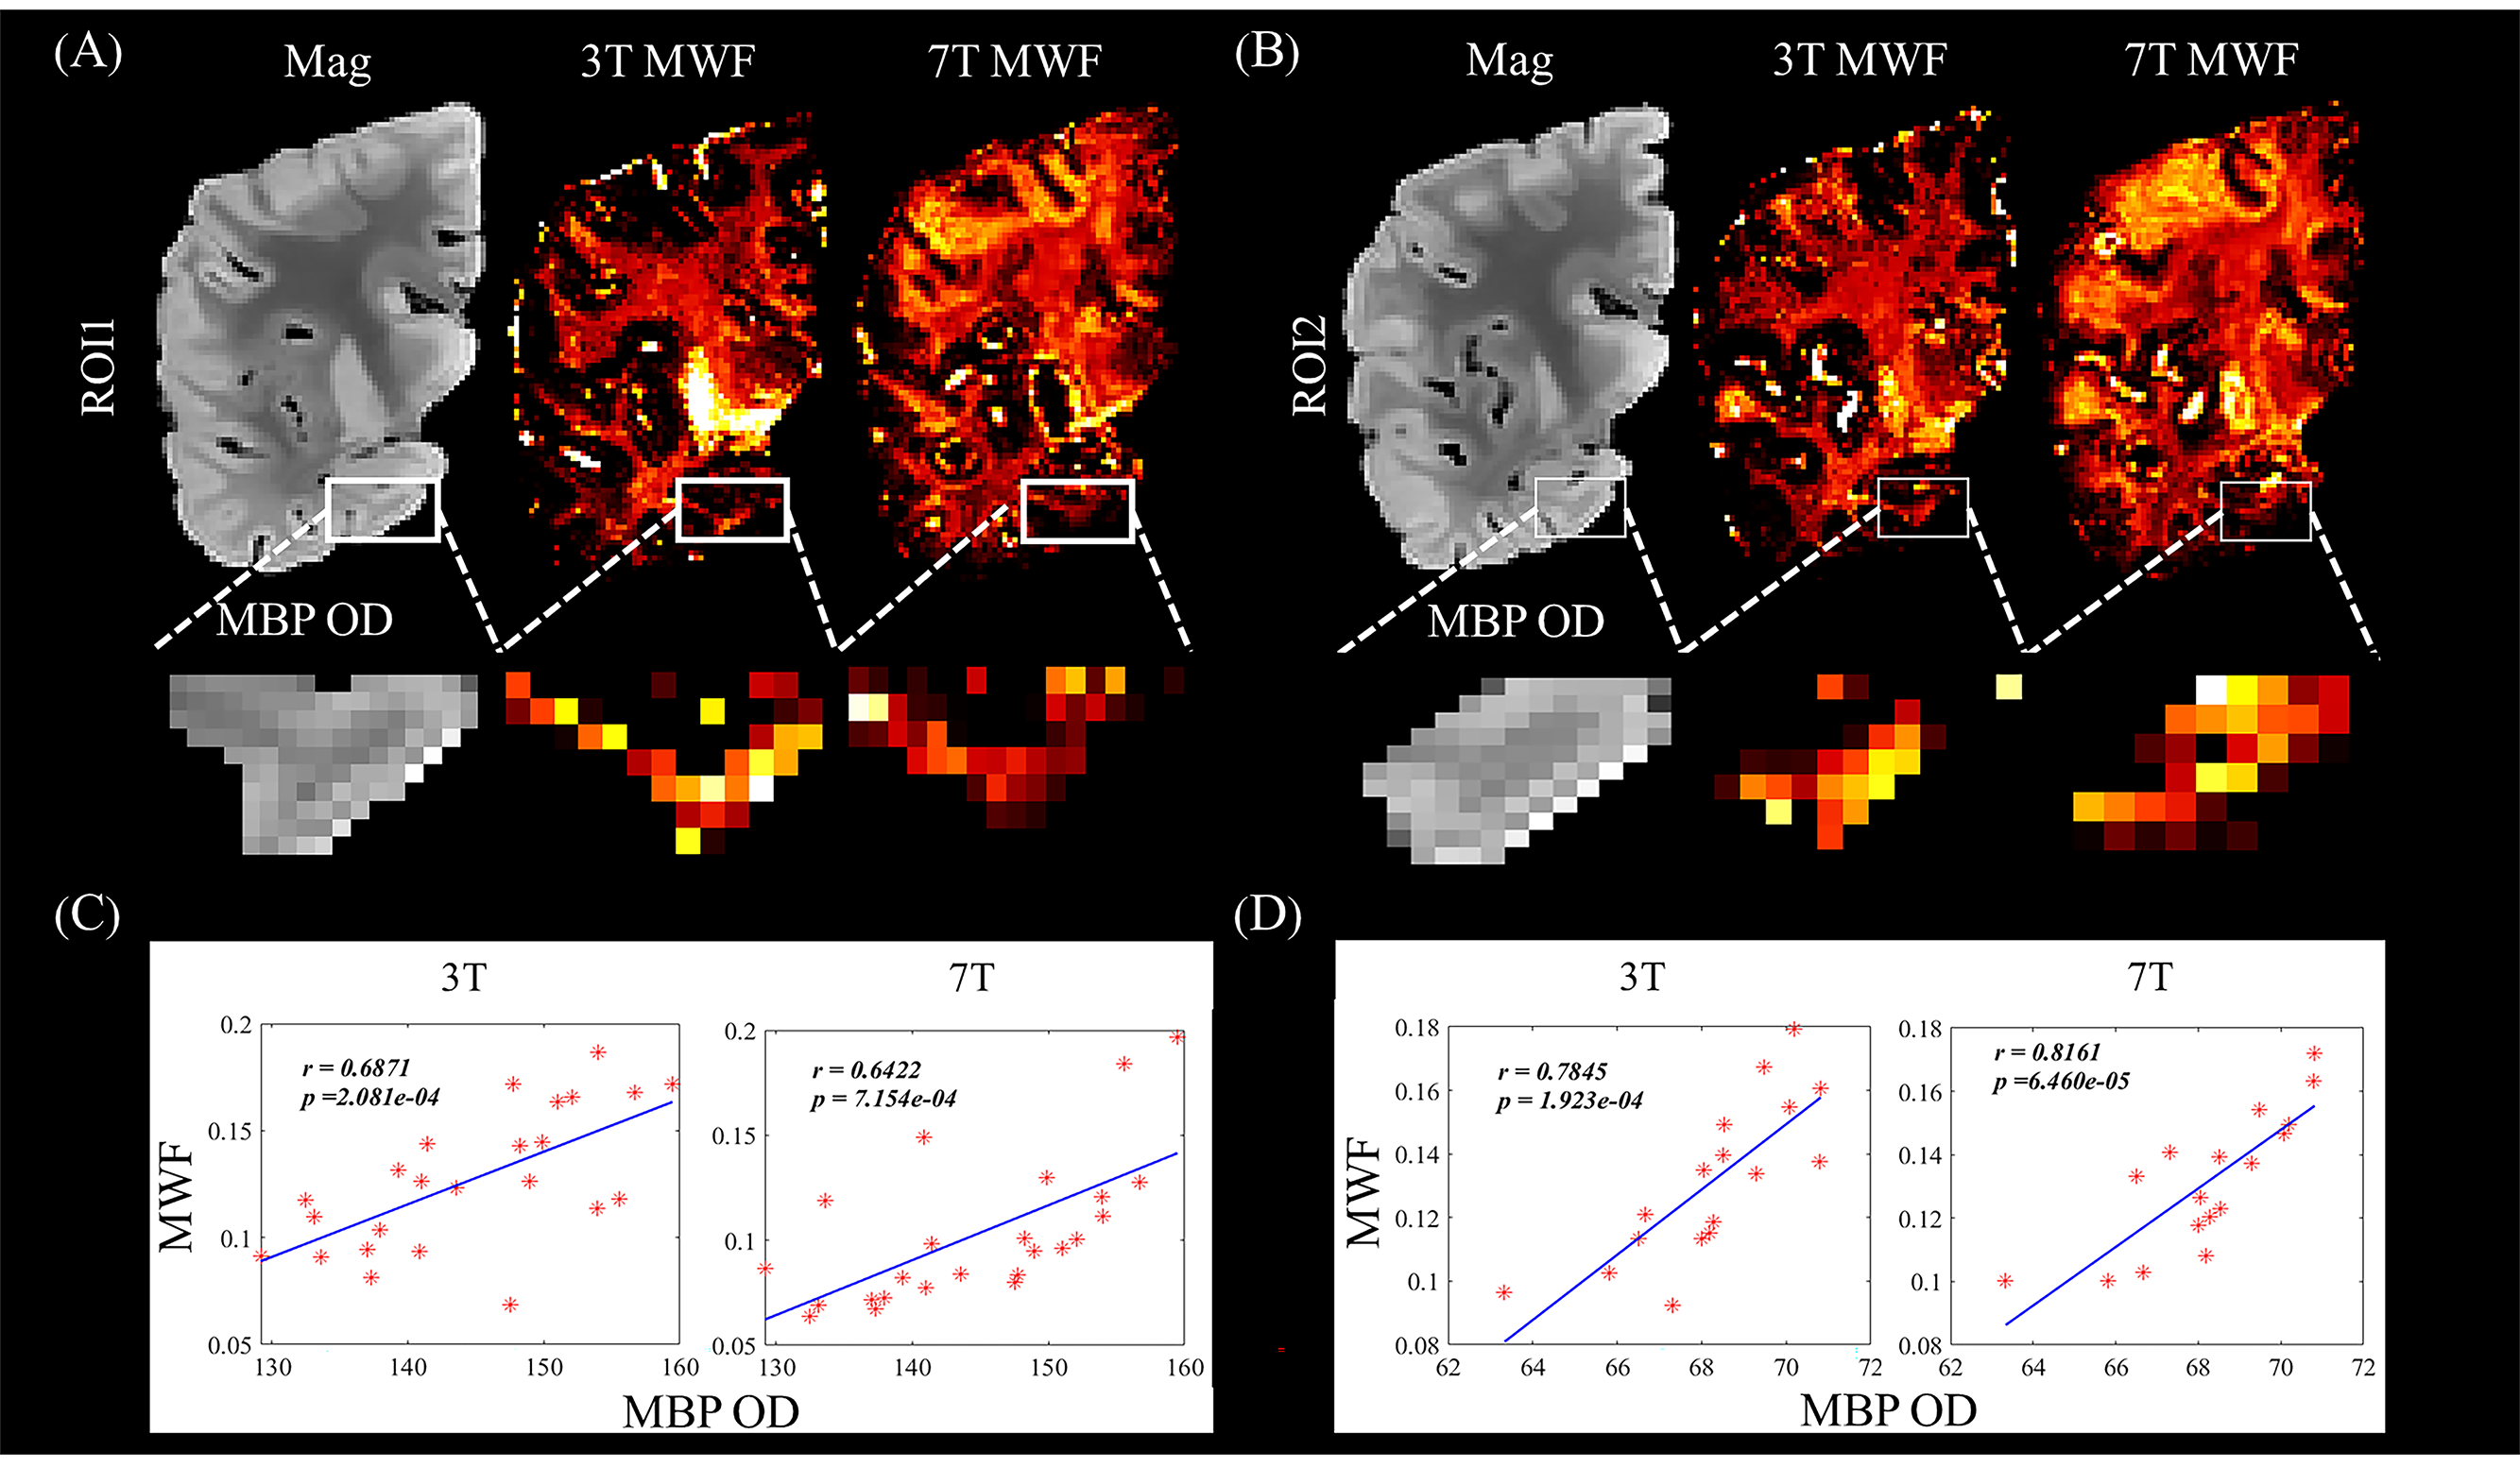
Fig.5. (A, B) Coregistration between mGRE and MBP staining for two tissue sections. (C-D) Pixelwise correlation between the MBP optical density and MWF in the two tissue samples.