2174
Assessing the potential of 7T and high-performance gradients for high-resolution R2* mapping in deep gray matter1Biomedical Magnetic Resonance, Otto-von-Guericke-University Magdeburg, Magdeburg, Germany, 2German Center for Neurodegenerative Diseases, Magdeburg, Germany, 3Center for Behavioral Brain Sciences (CBBS), Magdeburg, Germany, 4Max Planck Institute for Human Cognitive and Brain Sciences, Leipzig, Germany, 5Leibniz Institute for Neurobiology, Magdeburg, Germany
Synopsis
Keywords: Relaxometry, Relaxometry, Ultra-high field; 7T; R2*; high resolution; deep gray mattern; subcortical
Motivation: While conventional 7T systems provide increased SNR, their gradient systems lack the performance to acquire high-resolution GRE data with very fast sampling/many echoes.
Goal(s): To leverage a 7T with high-performance gradients to acquire more echoes than on conventional 7T systems and assess the potential for high-resolution R2* mapping.
Approach: Multi-echo GRE data with varying number of echoes was acquired at a 7T Terra.X Impulse Edition and 7T Plus. Conventional logarithmic-linear and advanced stretched exponential fits were performed.
Results: Sampling more echoes enables fitting advanced models which yield lower R2* standard deviation and root-mean-squared-errors.
Impact: Combining 7T with high-performance gradients enables high spatial and temporal resolution multi-echo GRE data. Hence, R2* mapping can be performed with novel multi-parametric fits, enabling new avenues in biophysical modeling as well as signal denoising and decomposition algorithms.
Introduction
Ultra-high field provides increased SNR but also shortened effective transversal relaxation times T2* 1. For high-resolution and conventional gradient systems, the achievable number of echoes during T2* decay is considerably limited. Here we utilize a 7T with high-performance gradients to acquire more echoes than on conventional 7T systems and assess the potential for high-resolution R2* mapping (R2*=1/T2*). Beyond conventional logarithmic-linear (log-lin) R2* fits2 and motivated by a knee study showing stretched exponential (exp.) relaxation behavior in healthy tissue3, we leverage the potential of more echoes to fit stretched exp. R2* decay for deep gray matter structures.Methods
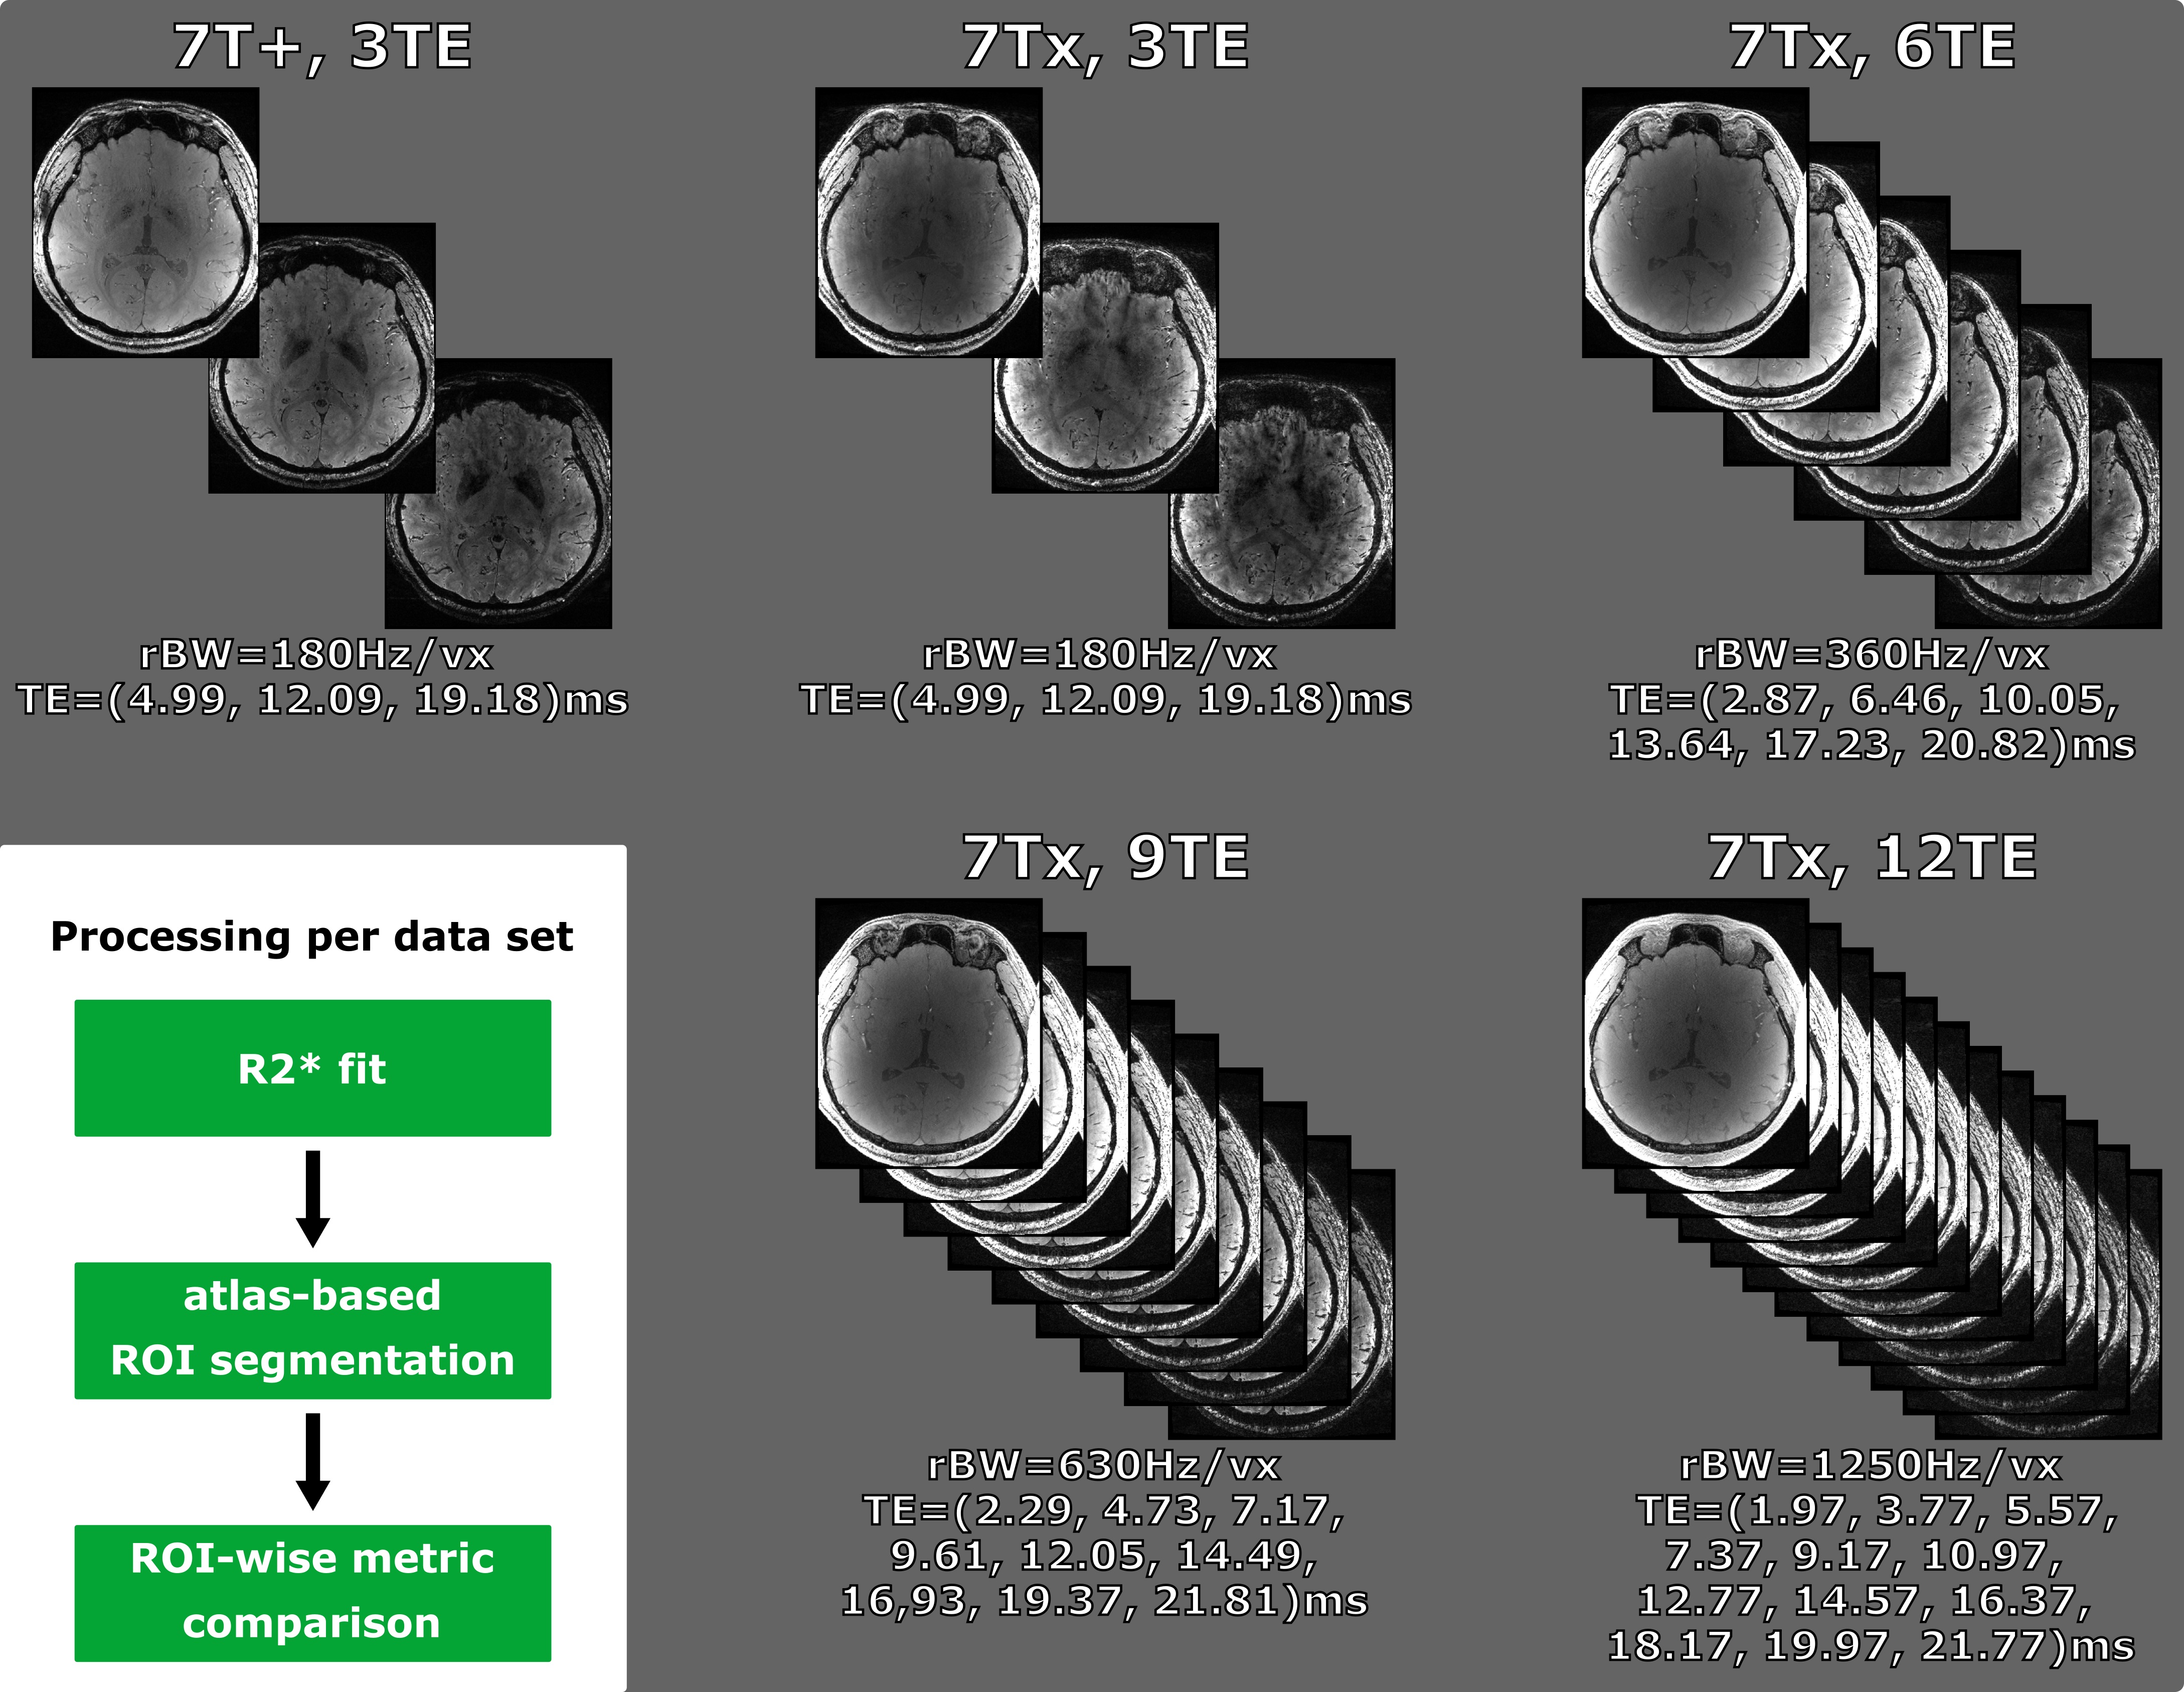
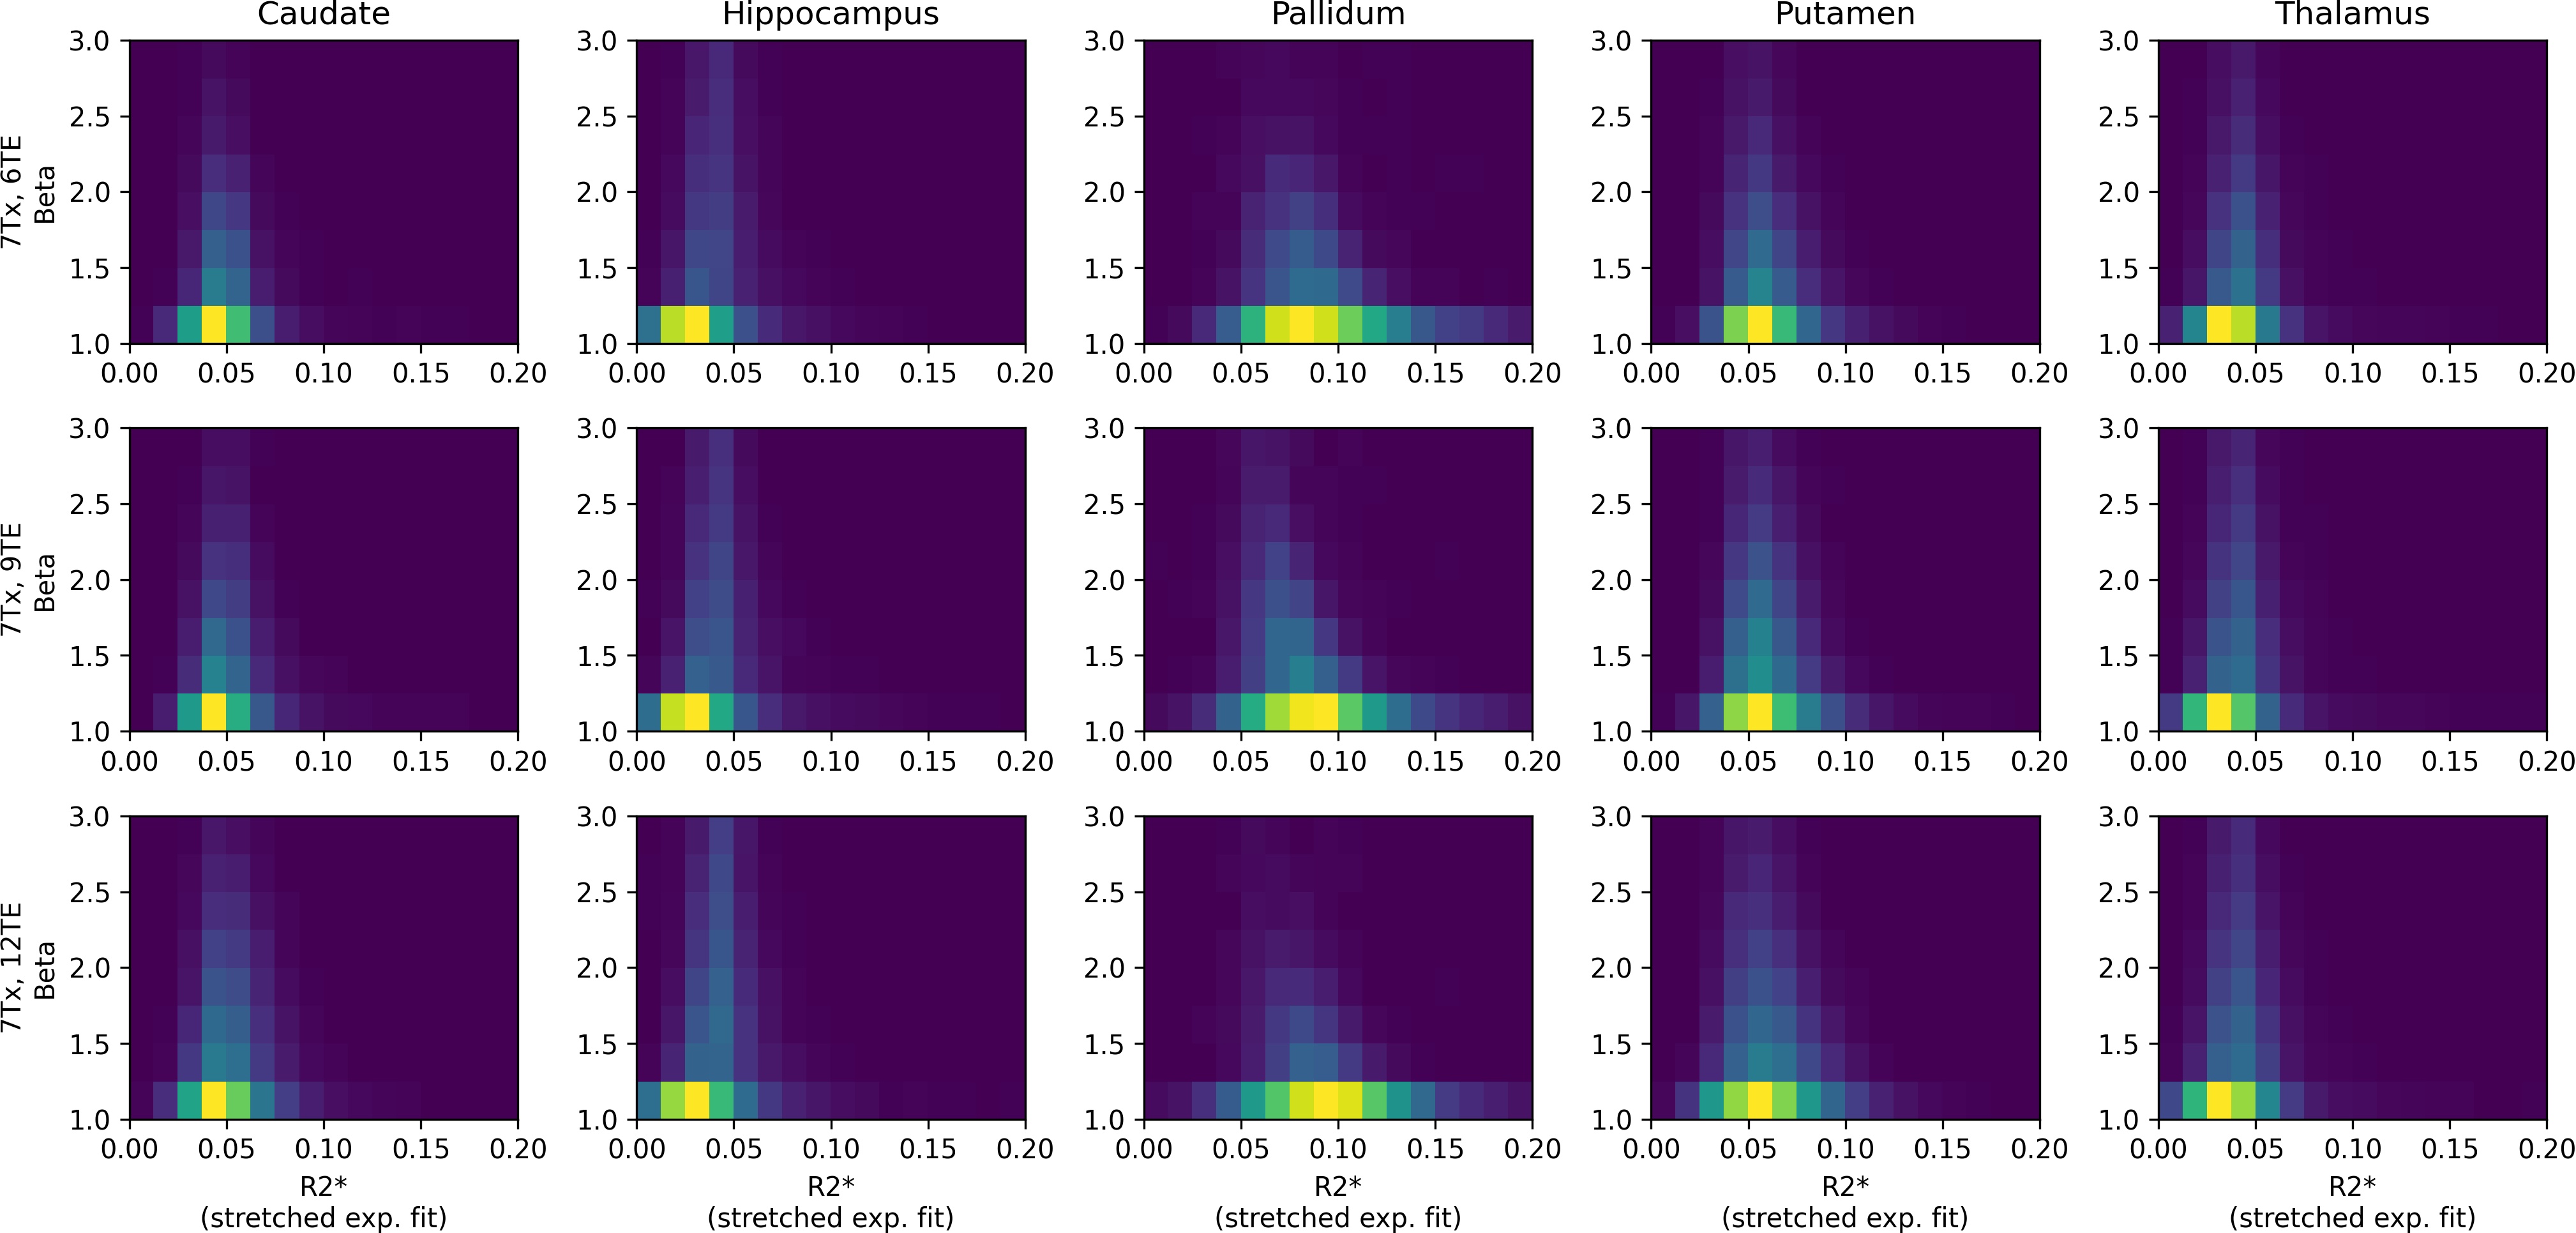
One healthy volunteer (gave written consent, IRB-approved) was scanned at a MAGNETOM 7T Plus (7T+; 70 mT/m, 200 T/m/s) and a MAGNETOM 7T Terra.X Impulse Edition (7Tx; 200 mT/m, 900 T/m/s) by Siemens Healthineers. R2* mapping was performed with a 3D multi-echo (ME) GRE sequence at 0.5 mm isotropic resolution with a slab thickness of 7.2 cm (TR=25ms, GRAPPA 2, TA=14min, monopolar readout, no flow-compensation). The 7T+ enabled a maximum of 3 echoes with a maximal readout bandwidth (rBW)of 180 Hz/vx, while the 7Tx allowed up to 12 echoes with a rBW of 1250 Hz/vx. Data is referred to by the number of echoes and scanner, e.g. 7T+, 3TE or 7Tx, 12TE. Note that the rBW was always chosen to be minimal for a given number of echoes to maximize SNR. Details on TEs and rBW can be found in Fig.1. Deep gray matter regions of interest (ROI) were segmented by co-registering non-rigidly the ME GRE data to MNI space (ICBM 2009b Nonlinear Asymmetric) with an intermediate rigid registration to a 1mm iso MPRAGE with ANTs4. The Harvard-Oxford subcortical atlas5 was then transformed back into the respective data space by nearest neighbor interpolation and each ROI was eroded by 2 voxels to mitigate potential registration imperfections and partial volume effects. The ROIs, i.e. caudate nucleus, hippocampus, pallidum, putamen, and thalamus, were assessed bilaterally. R2* maps were generated per voxel by log-lin fits, i.e. $$$ \ln(S(TE)) = \ln(S_0) - R2^* TE$$$, and stretched exp. fits, i.e. $$$ S(TE) = S_0 \exp(-(R2^* TE )^\beta) $$$ with beta representing the amount of exponential stretch2,3. Note that stretched exp. fits were only generated for data with at least six echoes as sufficient number of data points is required to fit this more complex model. Besides ROI-wise R2* statistics, the signal over time and fits respective root-mean-squared-error (RMSE) were analyzed. Further, the interaction of beta and R2* for stretched exp. fits was assessed by 2D histograms.Results
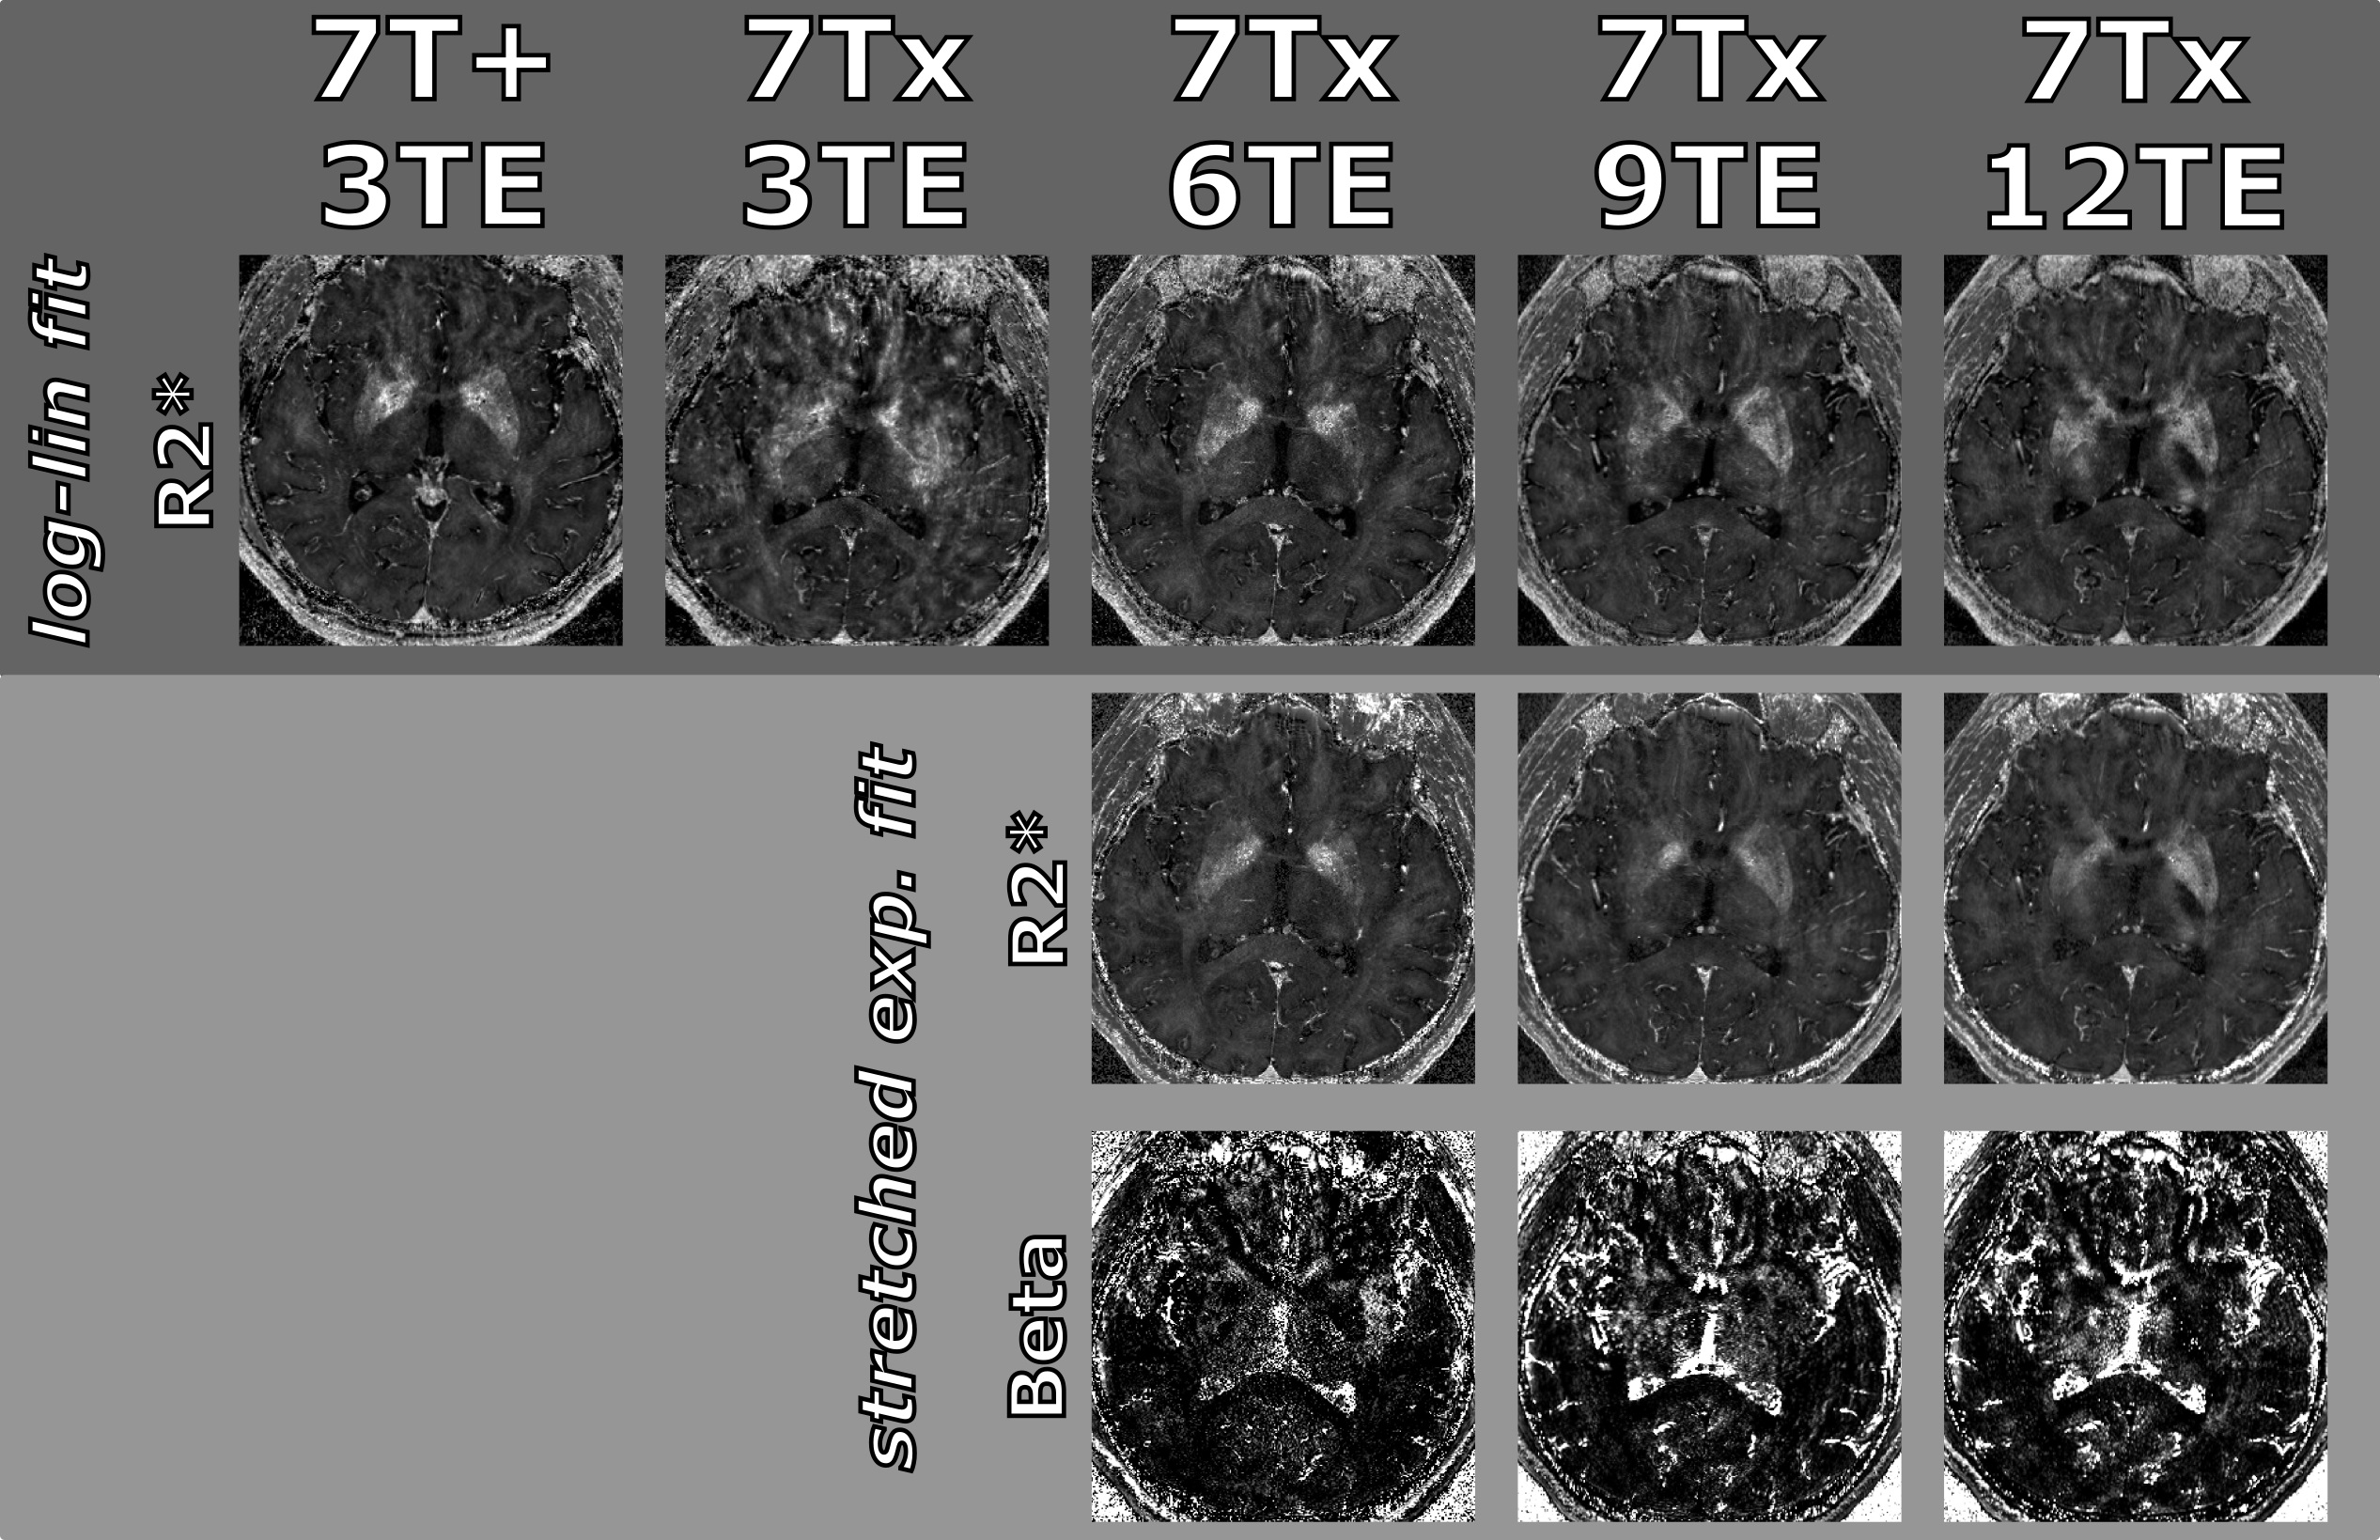
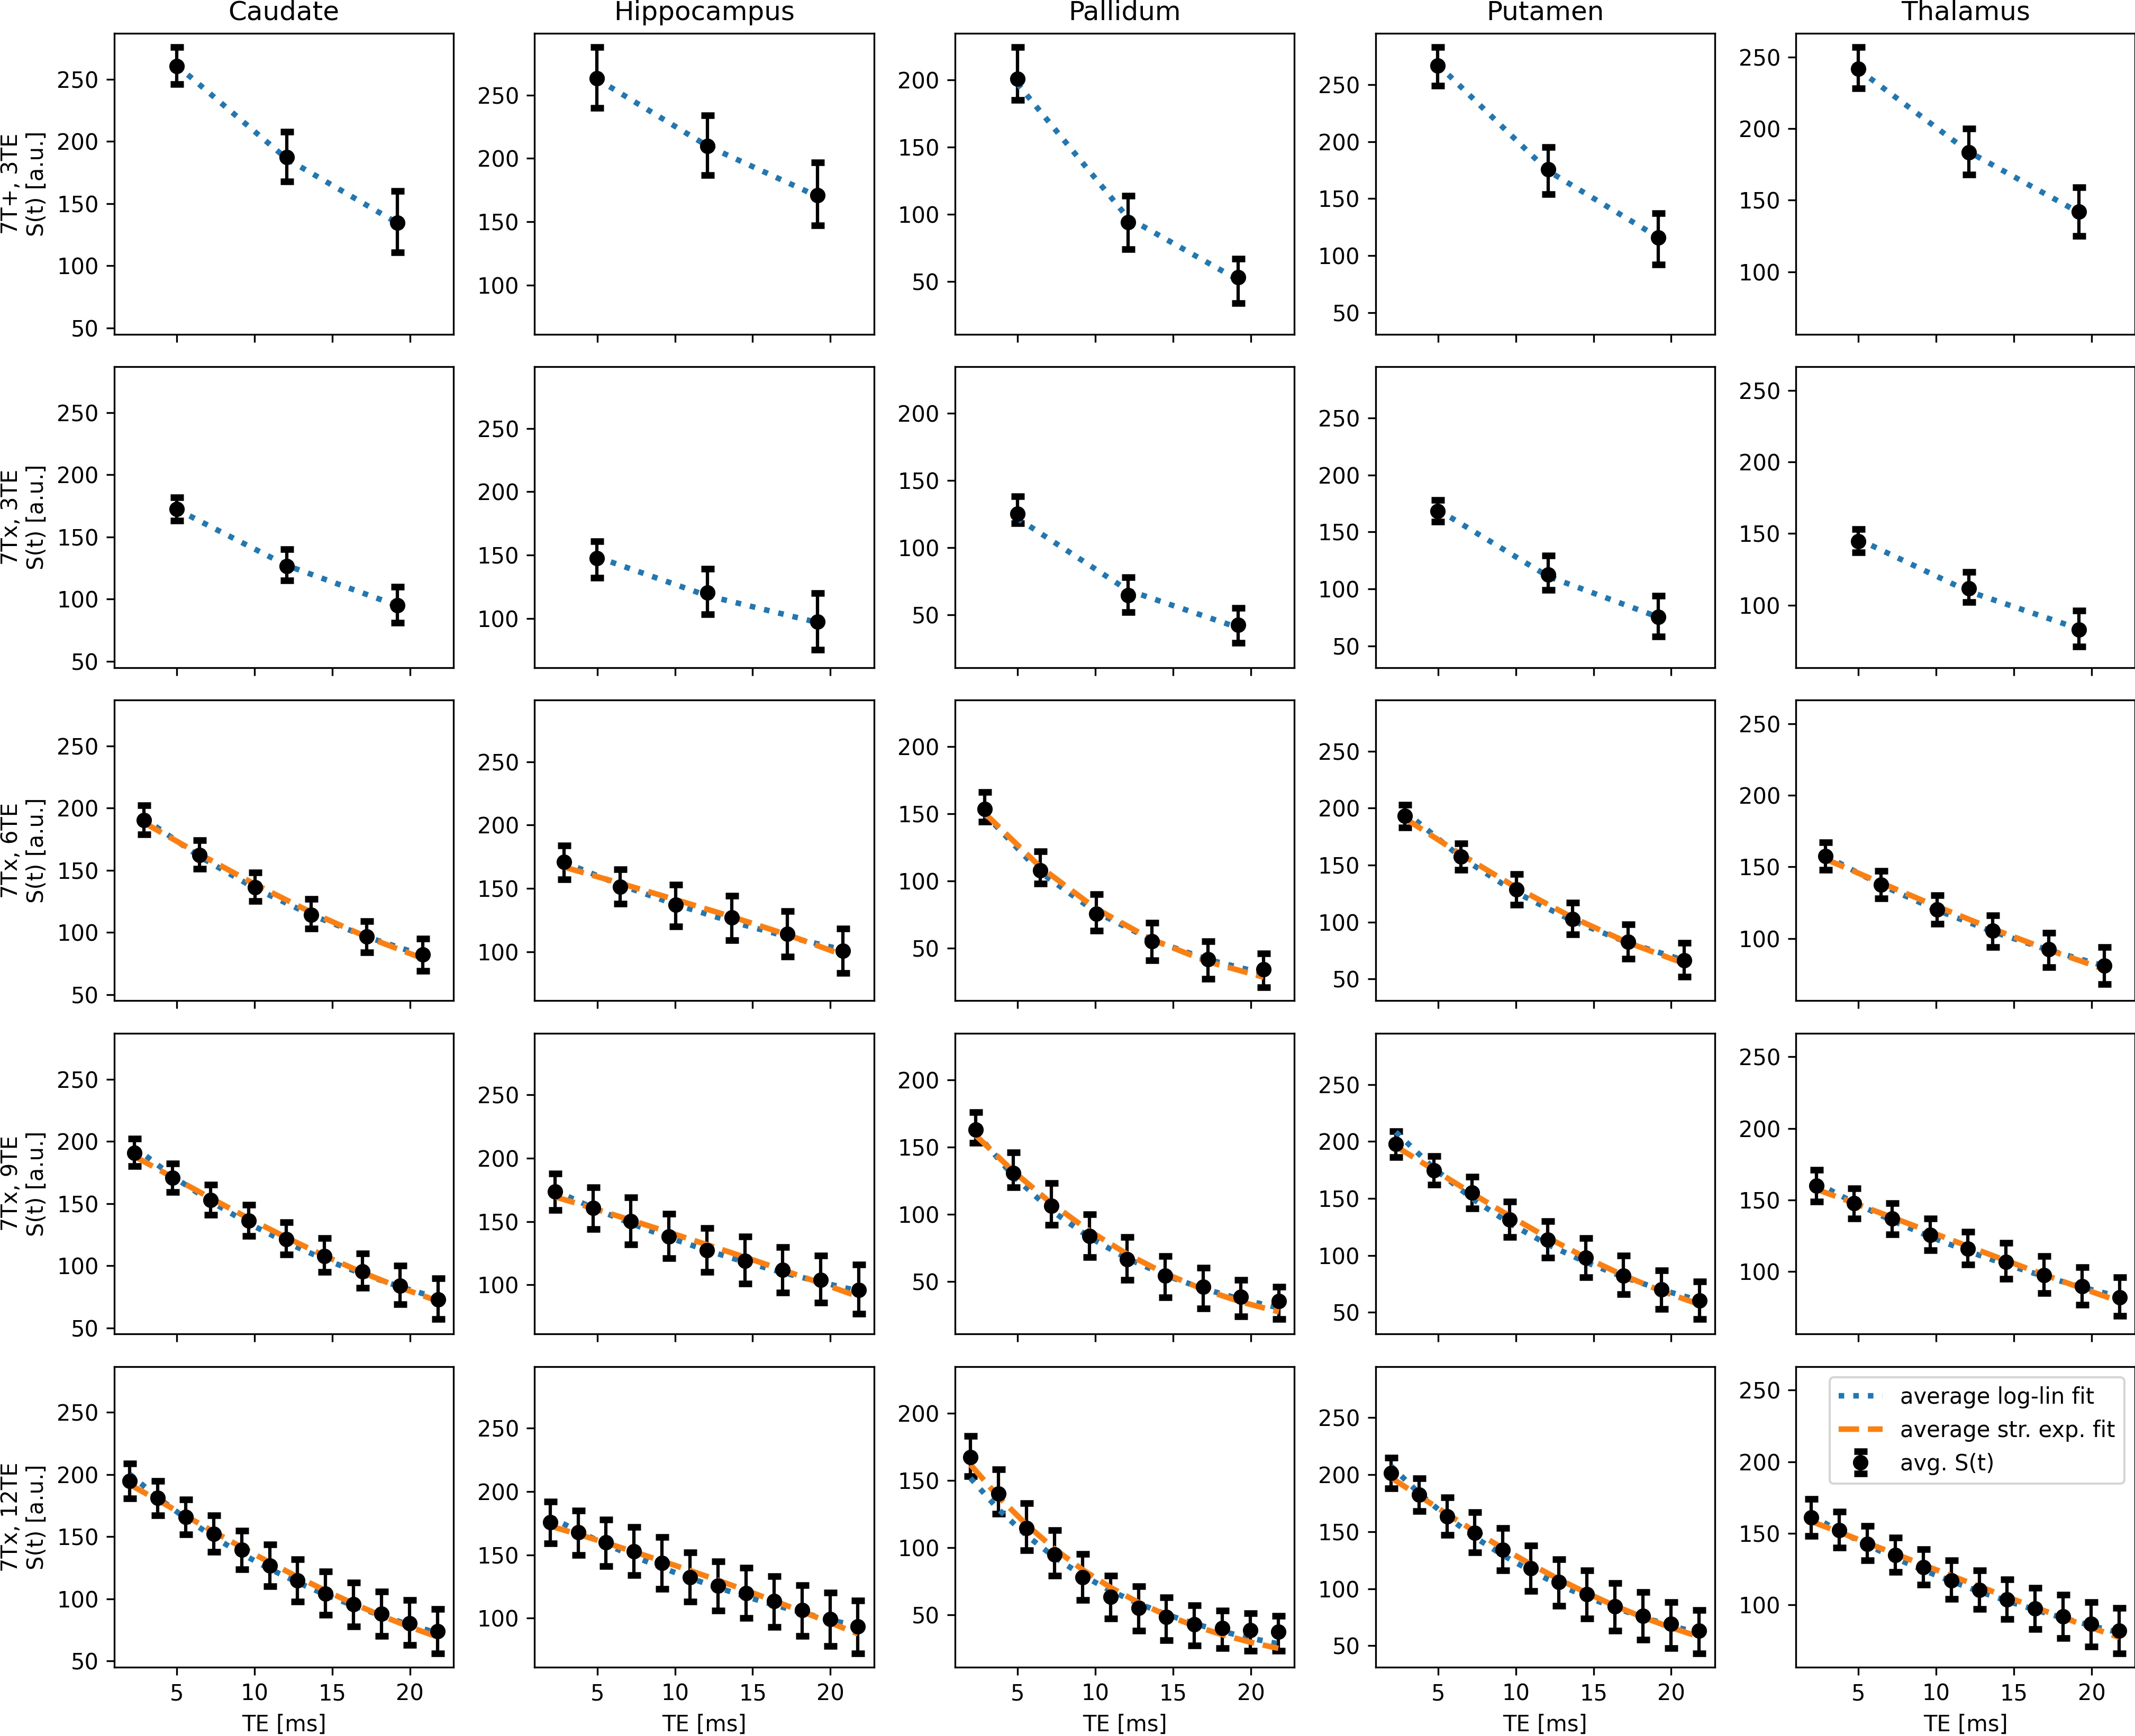
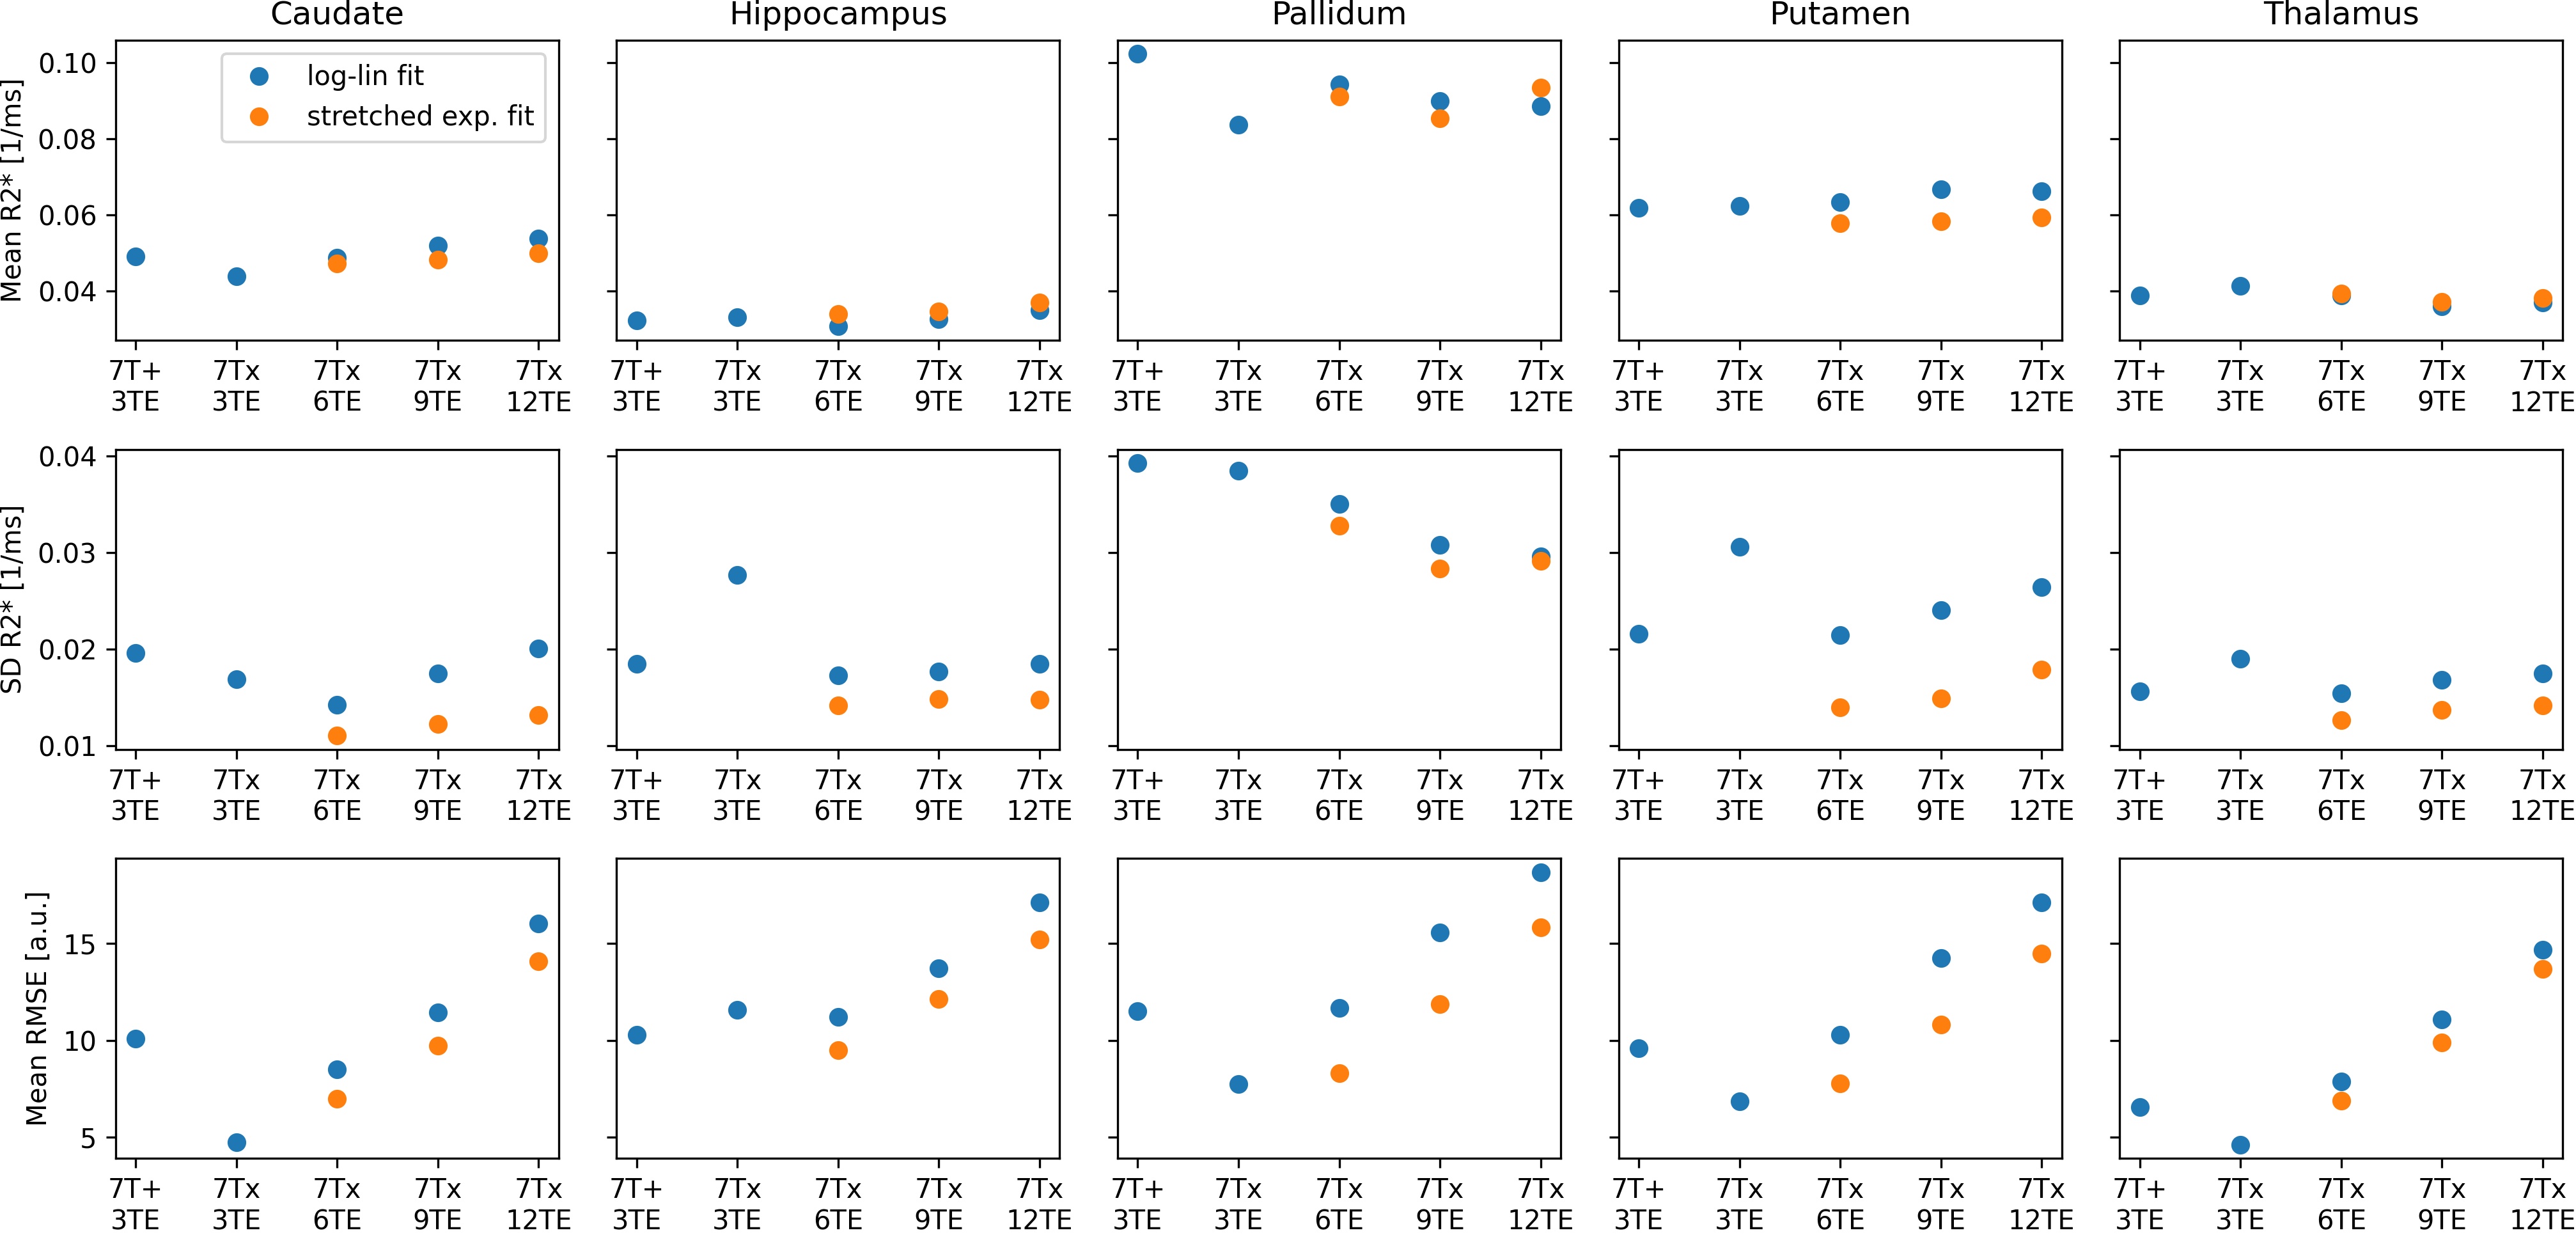
Visual comparison of all obtained fits is shown in Fig.2. ROI-wise assessment of the data and fits over time and statistics are provided in Fig.3 and 4, respectively. 2D histograms in Fig.5 show the distribution of beta and R2* for stretched exp. fits. In this study, fitting the data to more echoes tends to increase SD and RMSE, which could be mitigated by fitting with echo-specific weights in the future2. Compared to the conventional log-lin fit, the stretched exponential fit yields lower R2* SD and RMSE while providing visually more appealing R2* maps. ROI-wise averaged R2* agree across models and with the literature6.Discussion
In this study, high-performance gradients enabled sampling up to 4-times more echoes within the same TR compared to a conventional gradient system. The additional data can be leveraged to fit more advanced models which yield similar ROI-wise mean R2* with lower SD and RMSE compared to conventional log-lin fits. While this proof-of-principle study outlines the potential of the 7T Terra.X for applications beyond EPI-based images, follow-up studies are required to investigate whether the observed fit improvement is due to underlying biophysical mechanisms, i.e. a true stretched exp. decay as shown for knee relaxation mapping3, or if the fit implicitly corrects for image artifacts, such as potential bias due to head orientation, static and dynamic magnetic field differences which we did not assess here.Conclusion
In this proof-of-principle study, we leveraged the potential of 7T and a powerful gradient system to enable high-resolution R2* mapping beyond the log-lin fit. Sampling the signal dynamics with higher temporal resolution enables more advanced biophysical modelling and future studies will test other relaxation models such as inverse Laplace transform and multiexponential fitting. Further, more echoes could enable denoising strategies such as NORDIC7 for R2* mapping in the future.Acknowledgements
This work was funded by the Deutsche Forschungsgemeinschaft (DFG) (Project-Nr. 501214112 and 515412306) and by the Deutsche Alzheimer Gesellschaft (DAG) e.V. (MD-DARS project).References
1 Ladd, Mark E., et al. "Pros and cons of ultra-high-field MRI/MRS for human application." Progress in nuclear magnetic resonance spectroscopy 109 (2018): 1-50.
2 Weiskopf, Nikolaus, et al. "Estimating the apparent transverse relaxation time (R2*) from images with different contrasts (ESTATICS) reduces motion artifacts." Frontiers in neuroscience 8 (2014): 278.
3 Wilson, Robert L., et al. "Stretched-Exponential Modeling of Anomalous T1 ρ and T2 Relaxation in the Intervertebral Disc In Vivo." bioRxiv (2020): 2020-05.
4 Avants, Brian B., et al. "Symmetric diffeomorphic image registration with cross-correlation: evaluating automated labeling of elderly and neurodegenerative brain." Medical image analysis 12.1 (2008): 26-41.
5 Desikan, Rahul S., et al. "An automated labeling system for subdividing the human cerebral cortex on MRI scans into gyral based regions of interest." Neuroimage 31.3 (2006): 968-980.
6 Rua, Catarina, et al. "Multi-centre, multi-vendor reproducibility of 7T QSM and R2* in the human brain: results from the UK7T study." Neuroimage 223 (2020): 117358.
7 Moeller, Steen, et al. "NOise reduction with DIstribution Corrected (NORDIC) PCA in dMRI with complex-valued parameter-free locally low-rank processing." Neuroimage 226 (2021): 117539.
Figures