2172
Analytical T1, T2, proton density, and magnetic field inhomogeneity quantification in the brain using phase-cycled bSSFP1Graduate School for Cellular and Biomedical Sciences (GCB), University of Bern, Bern, Switzerland, 2Department of Diagnostic, Interventional and Pediatric Radiology (DIPR), Inselspital, University Hospital Bern, Bern, Switzerland, 3Translational Imaging Center (TIC), Swiss Institute for Translational and Entrepreneurial Medicine, Bern, Switzerland, 4Department of Cardiology, Inselspital, University Hospital Bern, Bern, Switzerland, 5Advanced Clinical Imaging Technology, Siemens Healthineers International AG, Bern, Switzerland, 6Department of Radiology, Lausanne University Hospital (CHUV) and University of Lausanne (UNIL), Lausanne, Switzerland
Synopsis
Keywords: Multi-Contrast, Quantitative Imaging, bSSFP, brain, T1, T2, Relaxometry, field inhomogeneity, proton density
Motivation: Addressing the need for simplified, time-efficient, and unbiased quantitative imaging in human brain.
Goal(s): Evaluating novel analytical method, ORACLE, to simultaneously quantify T1, T2, proton density (PD), and magnetic field inhomogeneity (B0) in human brain based on balanced steady-state free precession (bSSFP) profiles.
Approach: Acquiring bSSFP data for simultaneous multi-parameter quantification and reference multi-echo spin-echo, MP2RAGE and dual-echo gradient-echo data in 4 human subjects.
Results: Quantifications using bSSFP profiles and ORACLE was consistent with reference methods, although magnetization transfer effects led to a 15% consistent underestimation of T1. Proposed method has faster acquisition and parametric estimation comparing to other methods combined.
Impact: This novel analytical time-efficient method extracts a wide range of quantitative parameters from bSSFP profiles, which can be a valuable alternative to existing reference methods, multi-echo spin-echo, MP2RAGE and dual-echo gradient-echo, that quantify one parameter at a time.
Introduction
Phase-cycled (PC) balanced steady-state free-precession (bSSFP) acquisitions allow simultaneous T1 and T2 quantifications1–4. Off-Resonant encoded Analytical parameter quantification using Complex Linearized Equations (ORACLE) was proposed as a time-efficient method for T1, T2, magnetic field inhomogeneity (Δf), and proton density (PD) quantifications, making off-resonance corrections redundant1–4. Parameter quantifications with ORACLE performed on a standard computer (2.80GHz, 32GB) for 106 voxels requires only a second5,6, compared to prior methods that require over 2 min2, and has been validated in numerical simulations and phantom experiments5,6. This study aims to validate ORACLE application in human brain.Methods
Data Acquisition:PC-bSSFP, multi-echo spin-echo7 (ME-SE), MP2RAGE8 and dual-echo gradient-echo9 (DE-GRE) at 3T (MAGNETOM Prisma, Siemens Healthineers AG, Erlangen, Germany), Fig.1 summarizing acquisition parameters, were performed in 4 healthy subjects according to institutional rules.
Data Processing:
Using voxel-wise complex-valued bSSFP profiles, T1, T2, Δf , PD, complex sum (CS), and T1/T2 values were estimated by ORACLE framework5,6. A 3x3 Gaussian smoothing kernel was applied to ORACLE T1 and T2 maps. From ME-SE magnitude data, T2 was estimated voxel-wise with exponential least-square fitting after omission of first echo7. Vendor-provided MP2RAGE sequence produced T1 maps directly at scanner8. Magnetic field inhomogeneity (Δf) maps were obtained by calculating angle of ratio of two complex-valued gradient-echo images9 and dividing the result by 2πΔTE (Fig.1).
Data Analysis:
To compare different quantitative methods, histograms were computed for T1, T2, PD, and CS, identifying the most frequently occurring T1 and T2 values as reference peaks. Standard deviation and coefficient of variation (COV) of these reference peaks was calculated across subjects. Subsequently, coefficient of determination R2 between ORACLE and reference maps was determined for both T1 and T2 reference peaks. Finally, mean absolute differences in Δf were calculated between ORACLE and DE-GRE.
Results
T1 and T2 maps in human brain appeared similar (Fig.2,3). T1 histograms showed two distinct peaks, corresponding to gray (GM) and white matter (WM) (Fig.4)10. Main T1 peak was 683±12ms (COV=1.8%) for ORACLE and 833±32ms (COV=3.8%) for MP2RAGE. All T2 histograms showed a single distinct peak, 50.5±1.7ms (COV=3.4%) for ORACLE and 68.0ms±1.8ms (COV=2.6%) for ME-SE. R2 between MP2RAGE and ORACLE reference peak T1 values was 0.9998 and between ME-SE and ORACLE reference peak T2 values was 0.9996. Magnetic field inhomogeneity quantified with ORACLE and DE-GRE agreed well (Fig.2), with an average difference of 6.7Hz. Although representing different information, proton density maps (ORACLE) were visually similar to T1 maps (MP2RAGE), with both showing two distinct peaks in the corresponding histograms (Fig.3). ORACLE T1/T2 maps, demonstrated a novel contrast between GM, interstitial fluid, and CSF (Fig.2), leading to a clear differentiation of GM from interstitial fluid and CSF, which does not appear in T1 and T2 maps.Discussion
ORACLE enabled time-efficient multi-parameter quantification and produced a diverse range of contrasts from a 10min acquisition. Previous quantitative methods based on bSSFP profiles are limited to relaxometry1–4, discarded valuable parts of phase information1–4, or required lengthy iterative fitting to retrieve quantitative parameters2–4 .As reported before1–4 and expected due to magnetization transfer effects (MTE)12, T1 for GM and WM13 was underestimated by ~150ms with ORACLE compared to MP2RAGE. However, T1 value variations were reduced with ORACLE compared to MP2RAGE, suggesting ORACLE can be more robust. T2 underestimation using ORACLE compared to ME-SE was expected due to MTE1–4,12. Nevertheless, differences in T2 values enabled visual separation of GM and WM regions, which was improved in T2 maps obtained with ORACLE. This may be caused by residual stimulated echoes for ME-SE for higher T2 values7.
Furthermore, the T2 values of interstitial fluid and CSF, above 1s11,14, appeared noisier and were underestimated in ME-SE sequence.
Observation that the complex sum images had a contrast similar to T2 maps, while PD maps appeared similar to T1 maps, suggests that CS images may serve as a surrogate for T2, while PD can be a proxy for T1. The creation of CS images and PD maps did not necessitate any smoothing, in contrast to T1 maps generated using ORACLE and MP2RAGE. PD-maps may offer an alternative approach to measure cortical thickness—an essential biomarker in studying neurodegenerative and neurological disorders15.
Conclusion
ORACLE relies on analytical solutions, condensing all the information contained within bSSFP profiles, enabling T1, T2, T1/T2, and PD quantification, making off-resonance corrections redundant. This can be a valuable alternative to existing reference methods, multi-echo spin-echo, MP2RAGE and dual-echo gradient-echo, that quantify one parameter at a time. In addition, ORACLE offers different image contrasts PD, CS and T1/T2 with the same scan.Acknowledgements
The present study was funded by the Swiss National Science Foundation (grant number PCEFP2_194296)References
(1) Nguyen, D.; Bieri, O. Motion-Insensitive Rapid Configuration Relaxometry: Motion-Insensitive Rapid Configuration Relaxometry. Magn. Reson. Med. 2017, 78 (2), 518–526. https://doi.org/10.1002/mrm.26384. (2) Shcherbakova, Y.; Berg, C. A. T. van den; Moonen, C. T. W.; Bartels, L. W. PLANET: An Ellipse Fitting Approach for Simultaneous T1 and T2 Mapping Using Phase-Cycled Balanced Steady-State Free Precession. Magn. Reson. Med. 2018, 79 (2), 711–722. https://doi.org/10.1002/mrm.26717. (3) Shcherbakova, Y.; van den Berg, C. A. T.; Moonen, C. T. W.; Bartels, L. W. Investigation of the Influence of B0 Drift on the Performance of the PLANET Method and an Algorithm for Drift Correction. Magn. Reson. Med. 2019, 82 (5), 1725–1740. https://doi.org/10.1002/mrm.27860. (4) Shcherbakova, Y.; van den Berg, C. A. T.; Moonen, C. T. W.; Bartels, L. W. On the Accuracy and Precision of PLANET for Multiparametric MRI Using Phase-Cycled bSSFP Imaging. Magn. Reson. Med. 2019, 81 (3), 1534–1552. https://doi.org/10.1002/mrm.27491. (5) Plähn, N. M. J.; Açikgöz, B. C.; Mackowiak, A. L. C.; Bastiaansen, J. A. M. Rapid Decoding of 3T and 7T bSSFP Profile Asymmetries for T1, T2, and Fraction Quantification in Two-Compartment Systems. In Proc. Intl. Soc. Mag. Reson. Med. 31; 2023. (6) Plähn, N. M. J.; Mackowiak, A. L. C.; Açikgöz, B. C.; Peper, E. S.; Rossi, G. M.; Bastiaansen, J. A. M. Decoding the Phase-Cycled bSSFP Signal for Maximized Parameter Quantification - T1, T2, Proton Density and Magnetic Field Inhomogeneity. In Proc. Intl. Soc. Mag. Reson. Med. 31; 2023. (7) Fatemi, Y.; Danyali, H.; Helfroush, M. S.; Amiri, H. Fast T 2 Mapping Using Multi‐echo Spin‐echo MRI: A Linear Order Approach. Magn. Reson. Med. 2020, 84 (5), 2815–2830. https://doi.org/10.1002/mrm.28309. (8) Marques, J. P.; Kober, T.; Krueger, G.; Van Der Zwaag, W.; Van De Moortele, P.-F.; Gruetter, R. MP2RAGE, a Self Bias-Field Corrected Sequence for Improved Segmentation and T1-Mapping at High Field. NeuroImage 2010, 49 (2), 1271–1281. https://doi.org/10.1016/j.neuroimage.2009.10.002. (9) Geiger, Y.; Tal, A. Optimal Echo Times for Multi‐gradient Echo‐based B 0 Field‐mapping. NMR Biomed. 2020, 33 (7), e4316. https://doi.org/10.1002/nbm.4316. (10) Wansapura, J. P.; Holland, S. K.; Dunn, R. S.; Ball, W. S. NMR Relaxation Times in the Human Brain at 3.0 Tesla. J. Magn. Reson. Imaging 1999, 9 (4), 531–538. https://doi.org/10.1002/(SICI)1522-2586(199904)9:4<531::AID-JMRI4>3.0.CO;2-L. (11) Bojorquez, J. Z.; Bricq, S.; Acquitter, C.; Brunotte, F.; Walker, P. M.; Lalande, A. What Are Normal Relaxation Times of Tissues at 3 T? Magn. Reson. Imaging 2017, 35, 69–80. https://doi.org/10.1016/j.mri.2016.08.021. (12) Wood, T. C.; Teixeira, R. P. A. G.; Malik, S. J. Magnetization Transfer and Frequency Distribution Effects in the SSFP Ellipse. Magn. Reson. Med. 2020, 84 (2), 857–865. https://doi.org/10.1002/mrm.28149. (13) David W. McCandless. Book Review: Neuroanatomy: An Atlas of Structures, Sections, and Systems; 5th Edition, Duane E. Haines, Lippincott Williams & Wilkins, Baltimore; 1999. (14) Hopkins, A. L.; Yeung, H. N.; Bratton, C. B. Multiple Field Strength in Vivo T 1 and T 2 for Cerebrospinal Fluid Protons. Magn. Reson. Med. 1986, 3 (2), 303–311. https://doi.org/10.1002/mrm.1910030214. (15) Rebsamen, M.; Rummel, C.; Reyes, M.; Wiest, R.; McKinley, R. Direct Cortical Thickness Estimation Using Deep Learning‐based Anatomy Segmentation and Cortex Parcellation. Hum. Brain Mapp. 2020, 41 (17), 4804–4814. https://doi.org/10.1002/hbm.25159.Figures
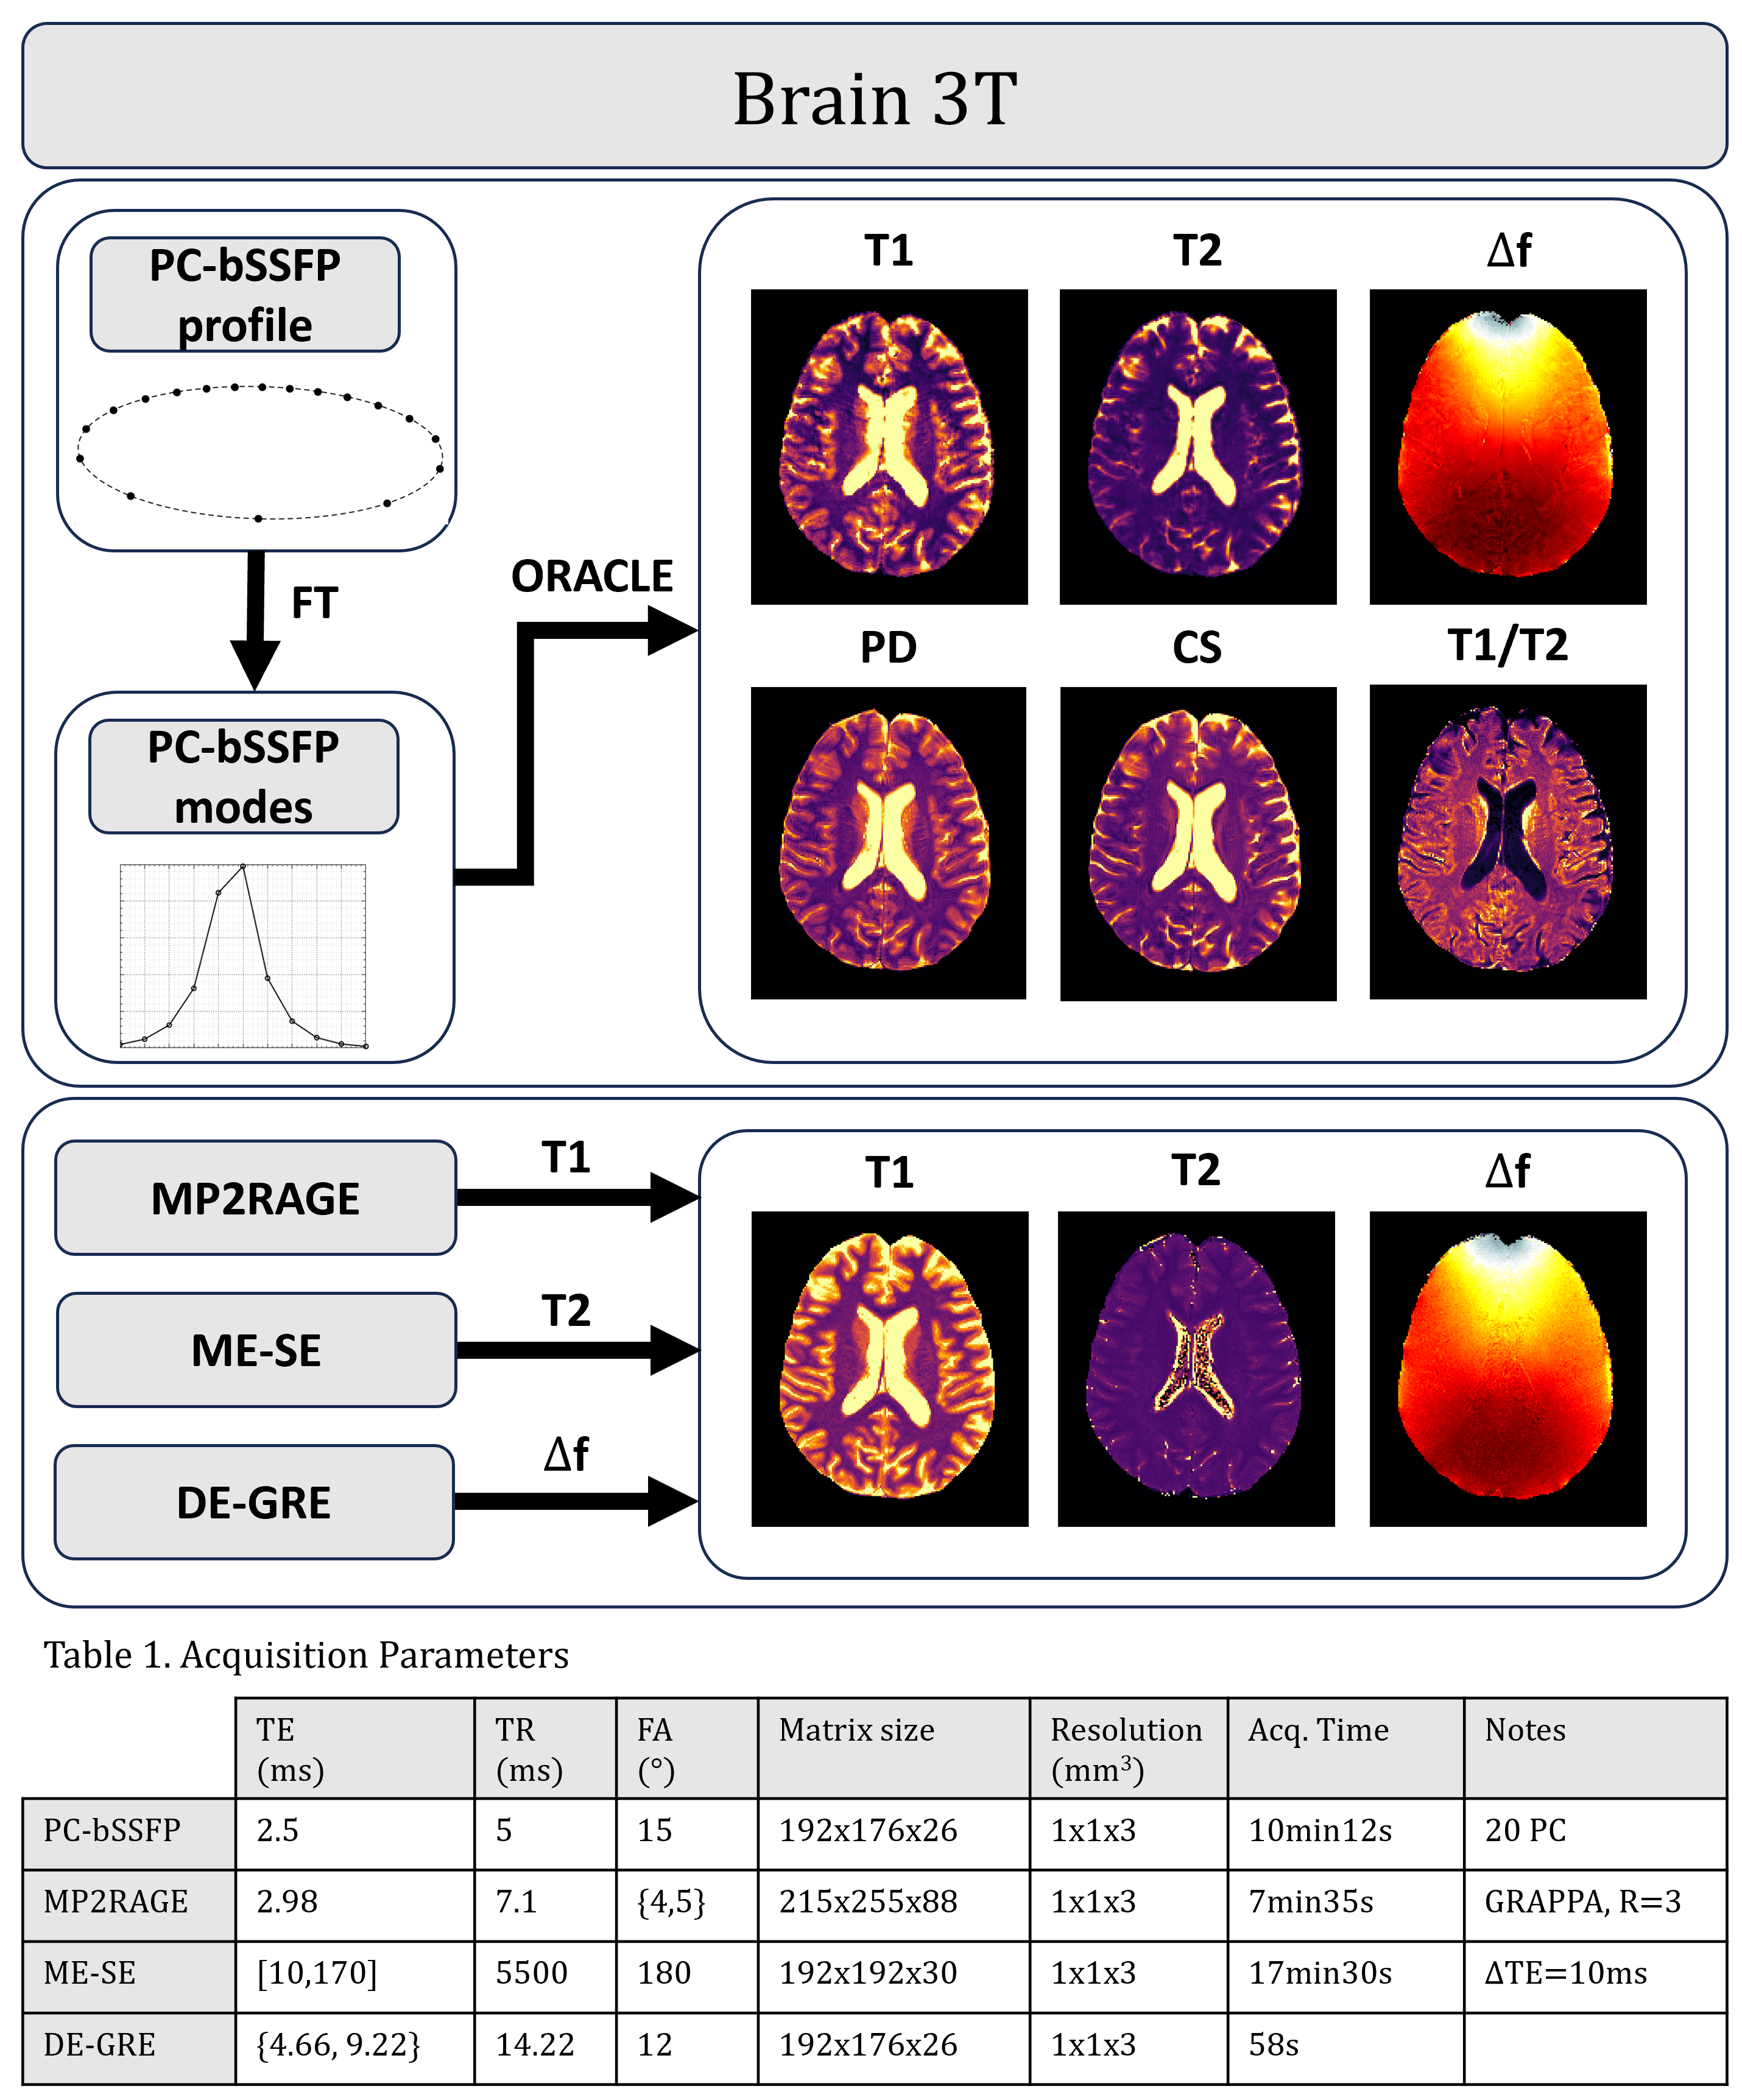
Figure 1. Illustration of the study design, sequences and acquisition parameters. PC-bSSFP is used for T1, T2, off-resonance (Δf), proton density (PD), T1/T2 ratio and complex sum (CS) quantification. MP2RAGE is used to obtain a T1 reference map. ME-SE data is used to obtain a T2 reference. DE- GRE is used for quantification of off-resonance (Δf). Table 1 contains the acquisition parameters: ΔTE is the echo spacing for the 17 echoes of ME-SE, GRAPPA acceleration factor R for MP2RAGE and 20 bSSFP acquisitions with different RF phase increments.
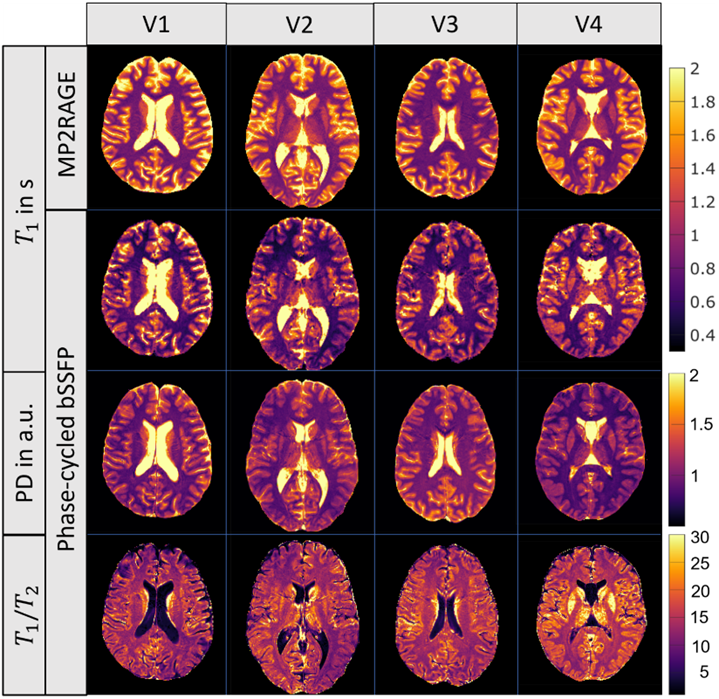
Figure 2. Quantitative maps obtained in 4 healthy subjects at 3T (V1-V4). T1 maps were obtained with MP2RAGE and PC-bSSFP. The proton density (PD) and T1/T2 maps were obtained based on PC-bSSFP. The T1/T2 ratio maps, demonstrate a novel contrast between the gray matter, interstitial fluid, and CSF leading to a clear differentiation of gray matter from interstitial fluid and CSF, unlike T1 maps. The PD maps appear similar to the T1 maps of both methods also confirmed by histograms (Figure 4).
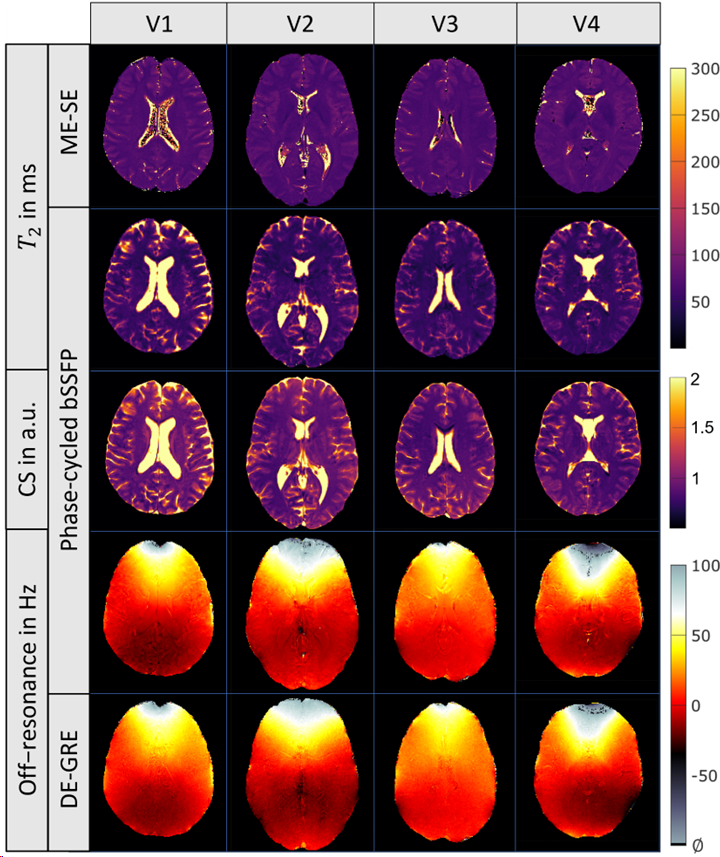
Figure 3. Quantitative maps obtained in 4 healthy subjects at 3T (V1-V4). T2 maps were obtained with ME-SE and PC-bSSFP and off-resonance maps Δf with PC-bSSFP and DE-GRE. Additionally, the complex sum (CS) images were obtained based on PC-bSSFP. The CS images are revealing a contrast similar to the T2 maps (ORACLE), which is also supported by the similarity of the corresponding histograms (Figure 4).
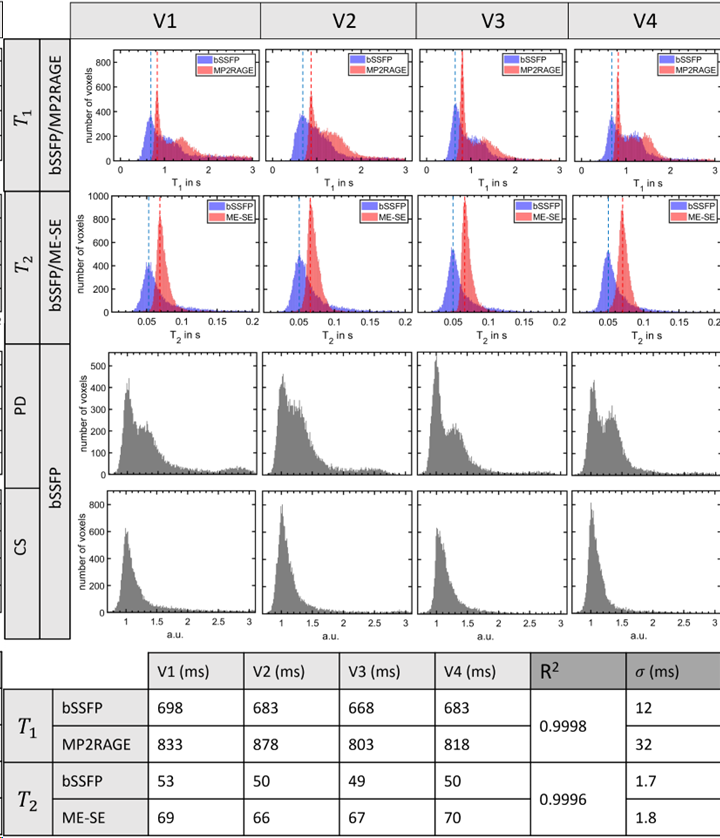
Figure 4. Histograms for PC-bSSFP and MP2RAGE T1 values, for PC-bSSFP and ME-SE T2 values, and for PD and CS values in 4 healthy volunteers (V1-V4). The red and blue lines correspond to the most frequently occurring T1 and T2 values (reference values). In the table the corresponding reference values are summarized, their additional standard deviation and the corresponding R2 value between ORACLE and the reference method for T1 and T2 respectively. Using PC-bSSFP acquisitions following ORACLE reconstructions, a lower standard deviation was found for T1 and T2 values across volunteers.