2171
Characterization of Radiation Response of Muscular Tissue of the Head and Neck using Quantitative Magnetic Resonance Relaxometry1Radiation Oncology, The University of Texas M D Anderson Cancer Center, Houston, TX, United States, 2Radiation Physics, The University of Texas M D Anderson Cancer Center, Houston, TX, United States, 3Head and Neck Surgery, The University of Texas M D Anderson Cancer Center, Houston, TX, United States
Synopsis
Keywords: Relaxometry, Quantitative Imaging, Toxicity; Radiotherapy; Biomarker; Head and Neck
Motivation: Due to limited options for early monitoring and interventions, radiation therapy (RT) for head and neck cancer patients often leads to dysphagia following treatment due to fibrosis development in swallowing muscles.
Goal(s): The goal of this work is to report findings from a retrospective cohort who received RT treatment and longitudinal T1/T2 map imaging.
Approach: Evaluating at pre-, mid-, post-, and late- RT allows for statistical analysis of changes in median T1/T2 values.
Results: Our hypothesis was confirmed that kinetics are discernable for T1 only, but limited correlation to dose and objective measures of muscle damage was seen in various structures.
Impact: At present, there exists no option for the early monitoring of injury from radiation therapy of swallowing muscles related to dysphagia. The aim of this work is to investigate Quantitative MR Relaxometry as a method to monitor for iatrogenic injury.
Introduction
Radiation induced injury to muscular tissues in the head and neck region is a primary driver of dysphagia in patients receiving radiation therapy (RT) for head and neck cancers1. There is at present a lack of approaches available to monitor for early development prior to clinical presentation of symptoms, and this has been a suggested driver of limiting outcomes in clinical trials to reduce edema/fibrosis in these patients2–5. The goal of this work is to investigate and report on a retrospective cohort of patients who received RT and longitudinal quantitative MR relaxometry to establish evidence for an early monitoring biomarker for iatrogenic injury of muscular tissues6,7.Methods
A cohort of 104 head and neck cancer patients (ages 31-80 and median age 59 years) received RT and longitudinal T1 and T2 mapping at baseline, throughout their treatment, and at treatment follow-up. The following sequences were acquired on a Siemens 1.5T Magnetom Aera RT simulator: T2-weighted (T2W) turbo spin echo (TSE), T1 maps using SPGR sequences with 5 varying flip angles (2-20) and constant repetition time which were optimized for head and neck quality, SPGR formula is used for T1 map fitting. T2 maps were acquired using a TSE sequences with 8 varying effective echo times (TEs), where each sampled echo in the TSE echo-train was used for the reconstruction of a separate image, maps constructed after dropping the first echo with a weighted least squares (WLS) fitting of a mono-exponential decay function. Various swallowing-related structures were autosegmented in Admire (Elekta Inc) on the T2W images and copied onto corresponding T1/T2 maps. Timepoint binning was defined according to the following: Pre-RT: [-14 – 5 days before Tx start date]; Mid-RT: [6 – 50]; Post-RT: [50 – 140]; Late-RT: [140 – 273]. Each timepoint-structure was then grouped based on mean dose delivered to the structure and split into dose quartiles. DIGEST8, an objective measure of deglutitive function, was assessed at 6 months – 1 year for a subset of 84 patients as the clinical endpoint of interest. Statistical analysis included signed-rank Wilcoxon (p < 0.05) to evaluate each structure group [timepoint, dose-quartile] change from baseline within each patient-structure. Additionally, the Mann-Whitney U test (p < 0.05) was used to compare ΔT1/T2 from baseline between groups split by both dose-quartile and DIGEST status to determine endpoint correlation and dose- response relationship.Results
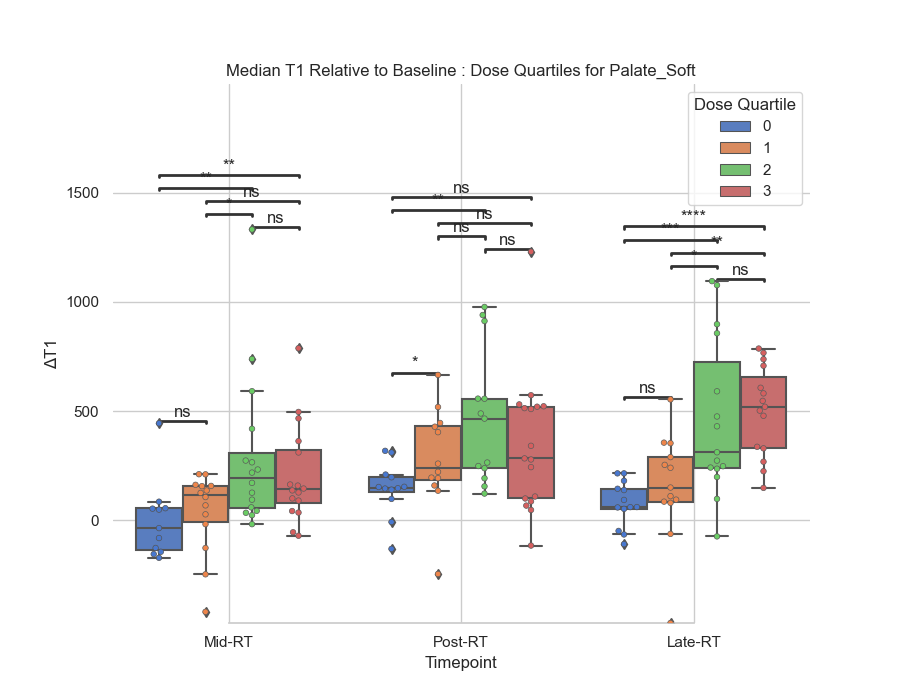
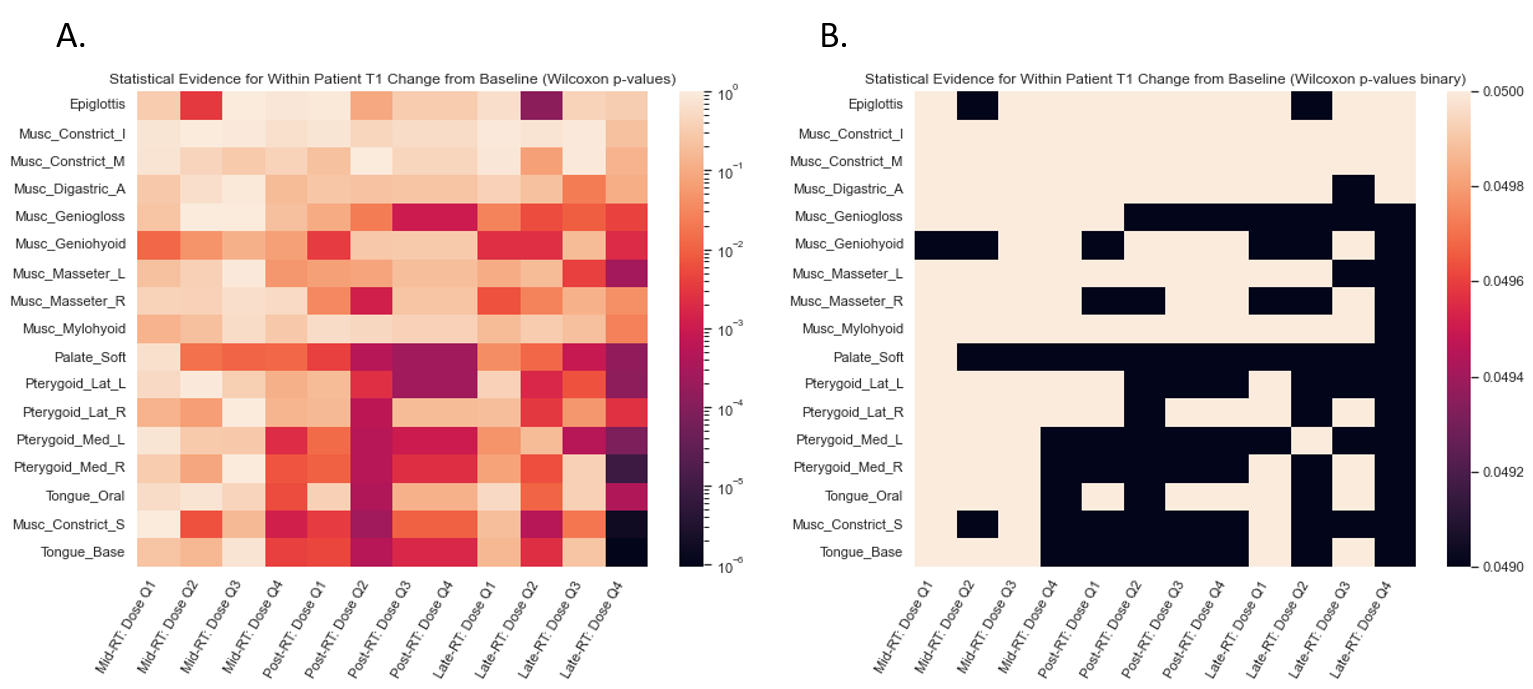
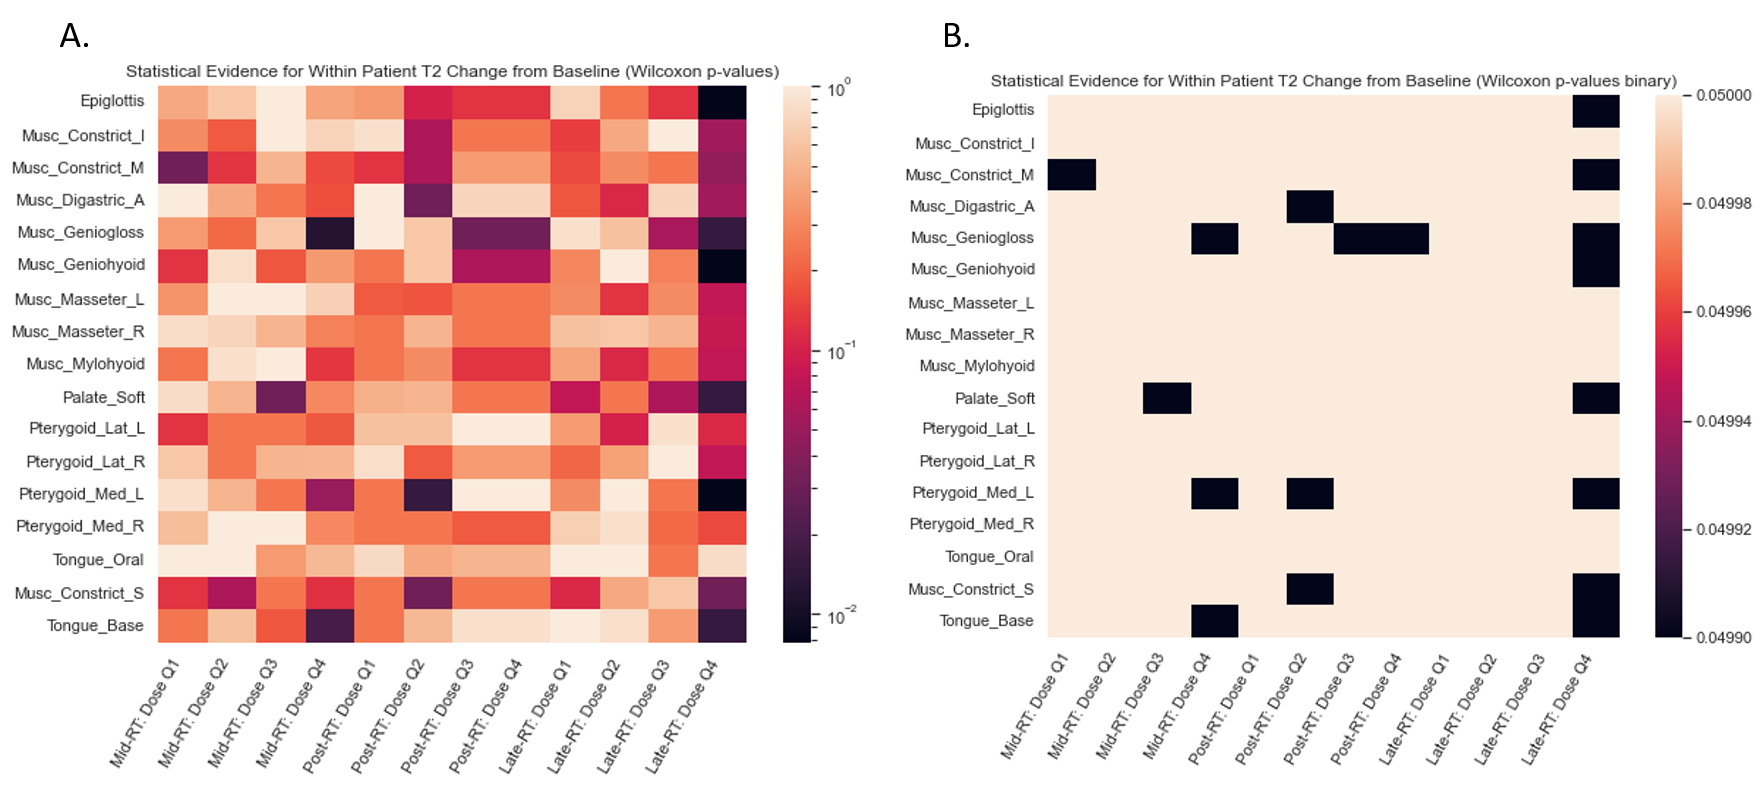
Median ΔT1 showed moderate capacity to discriminate tissue response in correlation to local radiation dose deposition in structures including the soft palate, lateral pterygoid muscles, medial pterygoid muscles, base of tongue, superior constrictor muscle, and digastric muscles at the late time point as demonstrated in Figure 1. ΔT1 demonstrated no statistically significant contribution to final DIGEST status in any of the structures or timepoints observed. Median ΔT2 showed no evidence to have discriminatory capacity for dose quartiles or late DISGEST status. Heatmaps in Figures 2 and 3 demonstrate statistical evidence for change relative to baseline for each dose-quartile at each time point for ΔT2 to further support evidence for statistically significant differences between the groups.Discussion
ΔT1 showed promise as a reliable marker of muscular injury following radiation therapy in its moderate capacity to discriminate dose response in various tissues and muscular structures. Specifically, the late ΔT1 demonstrated the best ability to characterize dose dependent response but in the soft palate some evidence could suggest utility at mid- or post-RT imaging. ΔT2 did not demonstrate reliable utility for discriminating dose-dependent kinetics at any time point observed, but it should be noted that the sparser dataset likely limited potential insights when comparing delta values. Signed-rank Wilcoxon testing for median ΔT2 showed some evidence that changes were present, but this retrospective investigation did not support the hypothesized dose dependence or association with late functional injury.Conclusion
Median ΔT1/T2 represents an initial evaluation of T1/T2 relaxometry as a method of characterizing normal tissue response to radiation therapy. ΔT1 showed moderate evidence of utility which is promising given the amount of information discarded when using such simple metrics as the median. Based on these findings, future research should focus on using additional abstractions for characterizing both T1 and T2 response with respect to dose deliver (e.g., percentiles, radiomics) while further investments should be made to standardize imaging methodologies and their acquisition frequencies in prospective studies to confidently evaluate the potential clinical performance of this imaging biomarker.Acknowledgements
This project is supported by an academic-industrial partnership R01 grant from the National Institutes of Health (NIH)/National Institute of Dental and Craniofacial Research (NIDCR) (R01DE028290) and NIH/NCI (National Cancer Institute) Image-Guided Cancer Therapy T32 Program (T32CA261856).References
1. Strojan P, Hutcheson KA, Eisbruch A, et al. Treatment of late sequelae after radiotherapy for head and neck cancer. Cancer Treat Rev. 2017;59:79-92. doi:10.1016/j.ctrv.2017.07.003
2. Berman B, Duncan MR. Pentoxifylline inhibits the proliferation of human fibroblasts derived from keloid, scleroderma and morphoea skin and their production of collagen, glycosaminoglycans and fibronectin. British Journal of Dermatology. 1990;123(3):339-346. doi:10.1111/j.1365-2133.1990.tb06294.x
3. Kaidar-Person O, Marks LB, Jones EL. Pentoxifylline and vitamin E for treatment or prevention of radiation-induced fibrosis in patients with breast cancer. Breast Journal. 2018;24(5):816-819. doi:10.1111/tbj.13044
4. Tyker A, Franco J, Massa ST, Desai SC, Walen SG. Treatment for lymphedema following head and neck cancer therapy: A systematic review. American Journal of Otolaryngology - Head and Neck Medicine and Surgery. 2019;40(5):761-769. doi:10.1016/j.amjoto.2019.05.024
5. Haddad P, Kalaghchi B, Amouzegar-Hashemi F. Pentoxifylline and vitamin E combination for superficial radiation-induced fibrosis: A phase II clinical trial. Radiotherapy and Oncology. 2005;77(3):324-326. doi:10.1016/j.radonc.2005.09.014
6. Meheissen MAM, Mohamed ASR, Kamal M, et al. A prospective longitudinal assessment of MRI signal intensity kinetics of non-target muscles in patients with advanced stage oropharyngeal cancer in relationship to radiotherapy dose and post-treatment radiation-associated dysphagia: Preliminary findings from a randomized trial. Radiotherapy and Oncology. 2019;130:46-55. doi:10.1016/j.radonc.2018.08.010
7. Messer JA, Mohamed ASR, Hutcheson KA, et al. Magnetic resonance imaging of swallowing-related structures in nasopharyngeal carcinoma patients receiving IMRT: Longitudinal dose-response characterization of quantitative signal kinetics. Radiotherapy and Oncology. 2016;118(2):315-322. doi:10.1016/j.radonc.2016.01.011
8. Hutcheson KA, Barrow MP, Barringer DA, et al. Dynamic Imaging Grade of Swallowing Toxicity (DIGEST): Scale development and validation. Cancer. 2017;123(1):62-70. doi:10.1002/cncr.30283
Figures