2170
On the impact of the free pool T2 on quantitative MT‑derived T1 and Macromolecular Proton Fraction values in the MP2RAGE1Aix Marseille Univ, CNRS, CRMBM, Marseille, France, 2APHM, Hôpital Universitaire Timone, CEMEREM, Marseille, France, 3Dept. of Radiology, Lausanne University Hospital (CHUV) and University of Lausanne, Lausanne, Switzerland, 4Siemens Healthcare SAS, Courbevoie, France
Synopsis
Keywords: Relaxometry, Modelling, Microstructure, Nervous System
Motivation: T1 estimations using the MP2RAGE methodology are biased by Magnetization Transfer (MT) effects. A quantitative MT-based solution was previously proposed in which the inversion efficiency of the preparation pulse (Q) was fixed; we sought to alleviate this strong hypothesis.
Goal(s): To better understand the influence of free water T2 (T2,f) on Q in the scope of MP2RAGE-T1 brain mapping.
Approach: A better modeling of the MP2RAGE involving a discretized preparation pulse is employed, and tested for fixed and free T2,f values.
Results: The T1 bias is highly dependent on the T2,f values, calling for a better and accurate estimation of this parameter.
Impact: Quantitative MT-derived T1 estimation in the MP2RAGE methodology remains dependent on the estimated free water T2 values because of its impact on the inversion efficiency pulse.
Introduction
The MP2RAGE1 sequence has gained interest for fast and high resolution brain in vivo mapping of T1, a quantitative parameter sensitive to microstructure2–4. However, the original associated mathematical model only considers a single proton pool1 which lacks accuracy as magnetization transfer (MT) has shown to induce biases on T1 estimations. It was previously demonstrated that including a macromolecular pool in the model to account for MT effects reduced the MP2RAGE‑estimated free pool T1 bias in comparison with an extensively-modeled Variable Flip Angle (qMT-VFA) protocol5 taken as reference. Nonetheless, the residual bias depends on the inversion efficiency (Q) of the MP2RAGE preparation pulse6.The MP2RAGE typically employs long adiabatic full-passage (AFP) pulses that makes it sensitive to – among other features – free pool transverse relaxation (T2,f), resulting in a reduced Q within typical brain T2,f values (same order as the preparation pulse duration). In this work, we investigated the influence of T2,f on quantitative MT‑derived T1 and macromolecular proton fraction (MPF) through its effect on Q: i) by arbitrarily fixing T2,f in the optimization process, and ii) by estimating T2,f (“free”). Results are compared with a comprehensive joint VFA and MT-weighted quantitative MT (qMT) framework7.
Methods
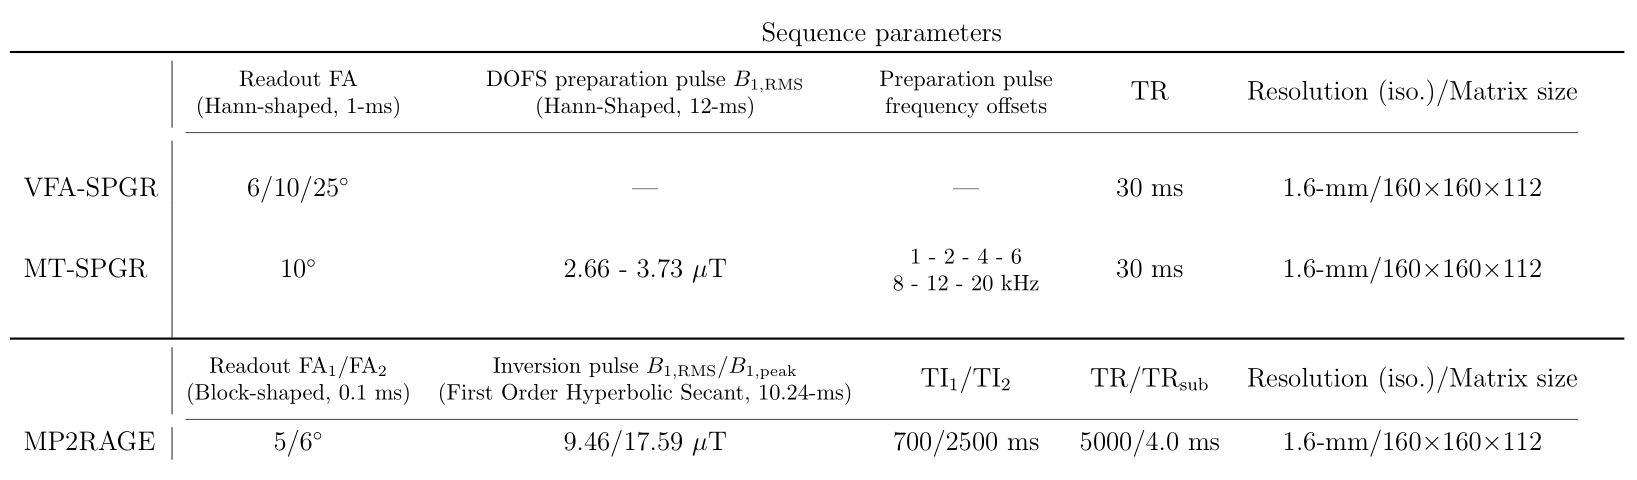
Experiments were performed on one healthy volunteer at 3T (MAGNETOM Vida, Siemens Healthineers, Erlangen, Germany). The protocol included anatomical MPRAGE, B1+ mapping, prototype 3D‑MP2RAGE and 3D- VFA-SPGR and MT-SPGR (for Z-spectra acquisitions following the methodology introduced previoulsy7) sequences. The MP2RAGE was prepared with a 1st-order hyperbolic secant (HS1) AFP pulse. A summary of the sequence parameters is provided in Table 1.Simulations: To evaluate the impact of T2,f on Q, simulations of the 10.24‑ms long HS1-AFP pulse were performed for typical white and gray matter (WM/GM) qMT parameters7 using the MT binary spin-bath model for varying T2,f values.
Experiments: QMT parameters of bound (b) and free (f) pools T2,b, T1,f (assuming T1,b=T1,f=T1), MPF and exchange rate R were estimated from two frameworks through joint fitting of: i) MP2RAGE and Z-spectra data, and ii) VFA and Z-spectra data. A matrix formalism was used to describe the steady‑state signals7,8. The HS1-AFP pulse was discretized and formulated into a conventional rotation matrix, and accounted for all relaxation and exchange effects. To evaluate the impact of T2,f on the qMT parameters, parametric mapping was performed for fixed and free T2,f values. Variations between both frameworks were calculated in WM and deep GM regions.
Results
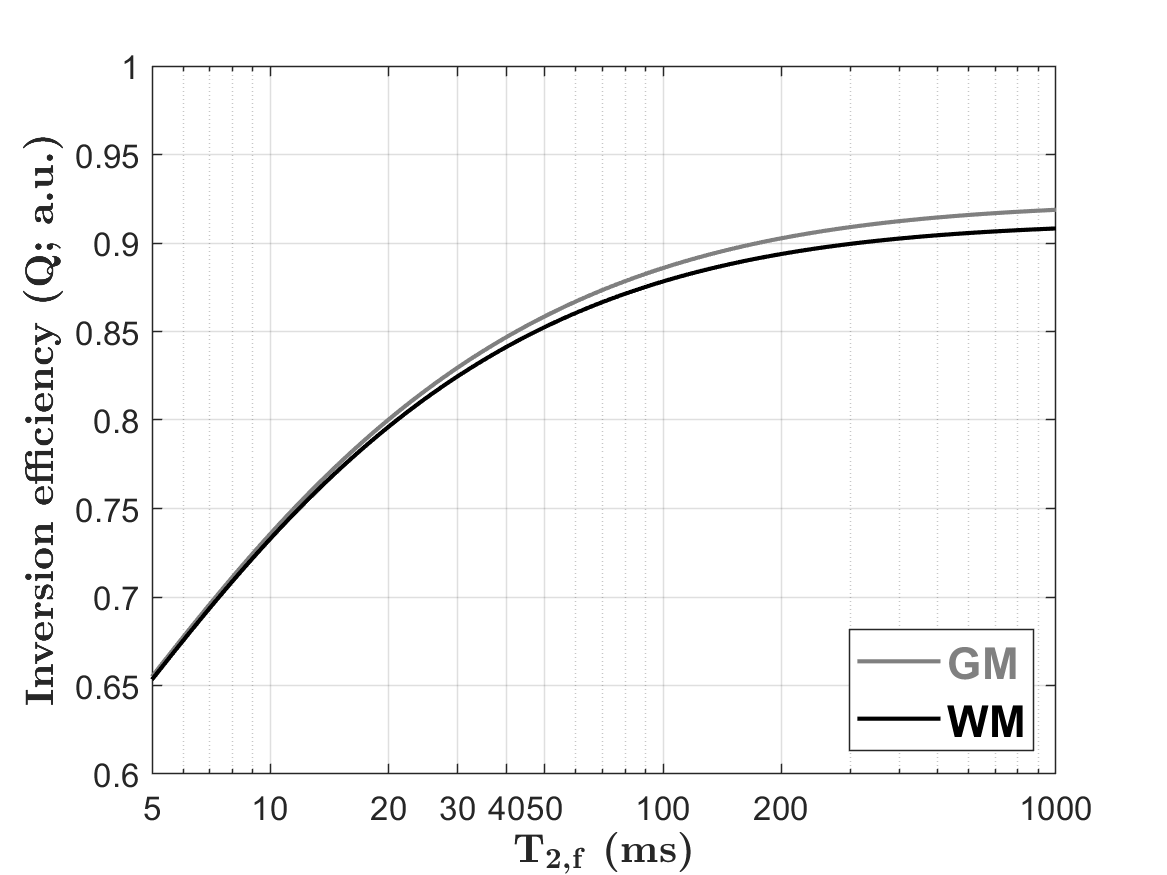
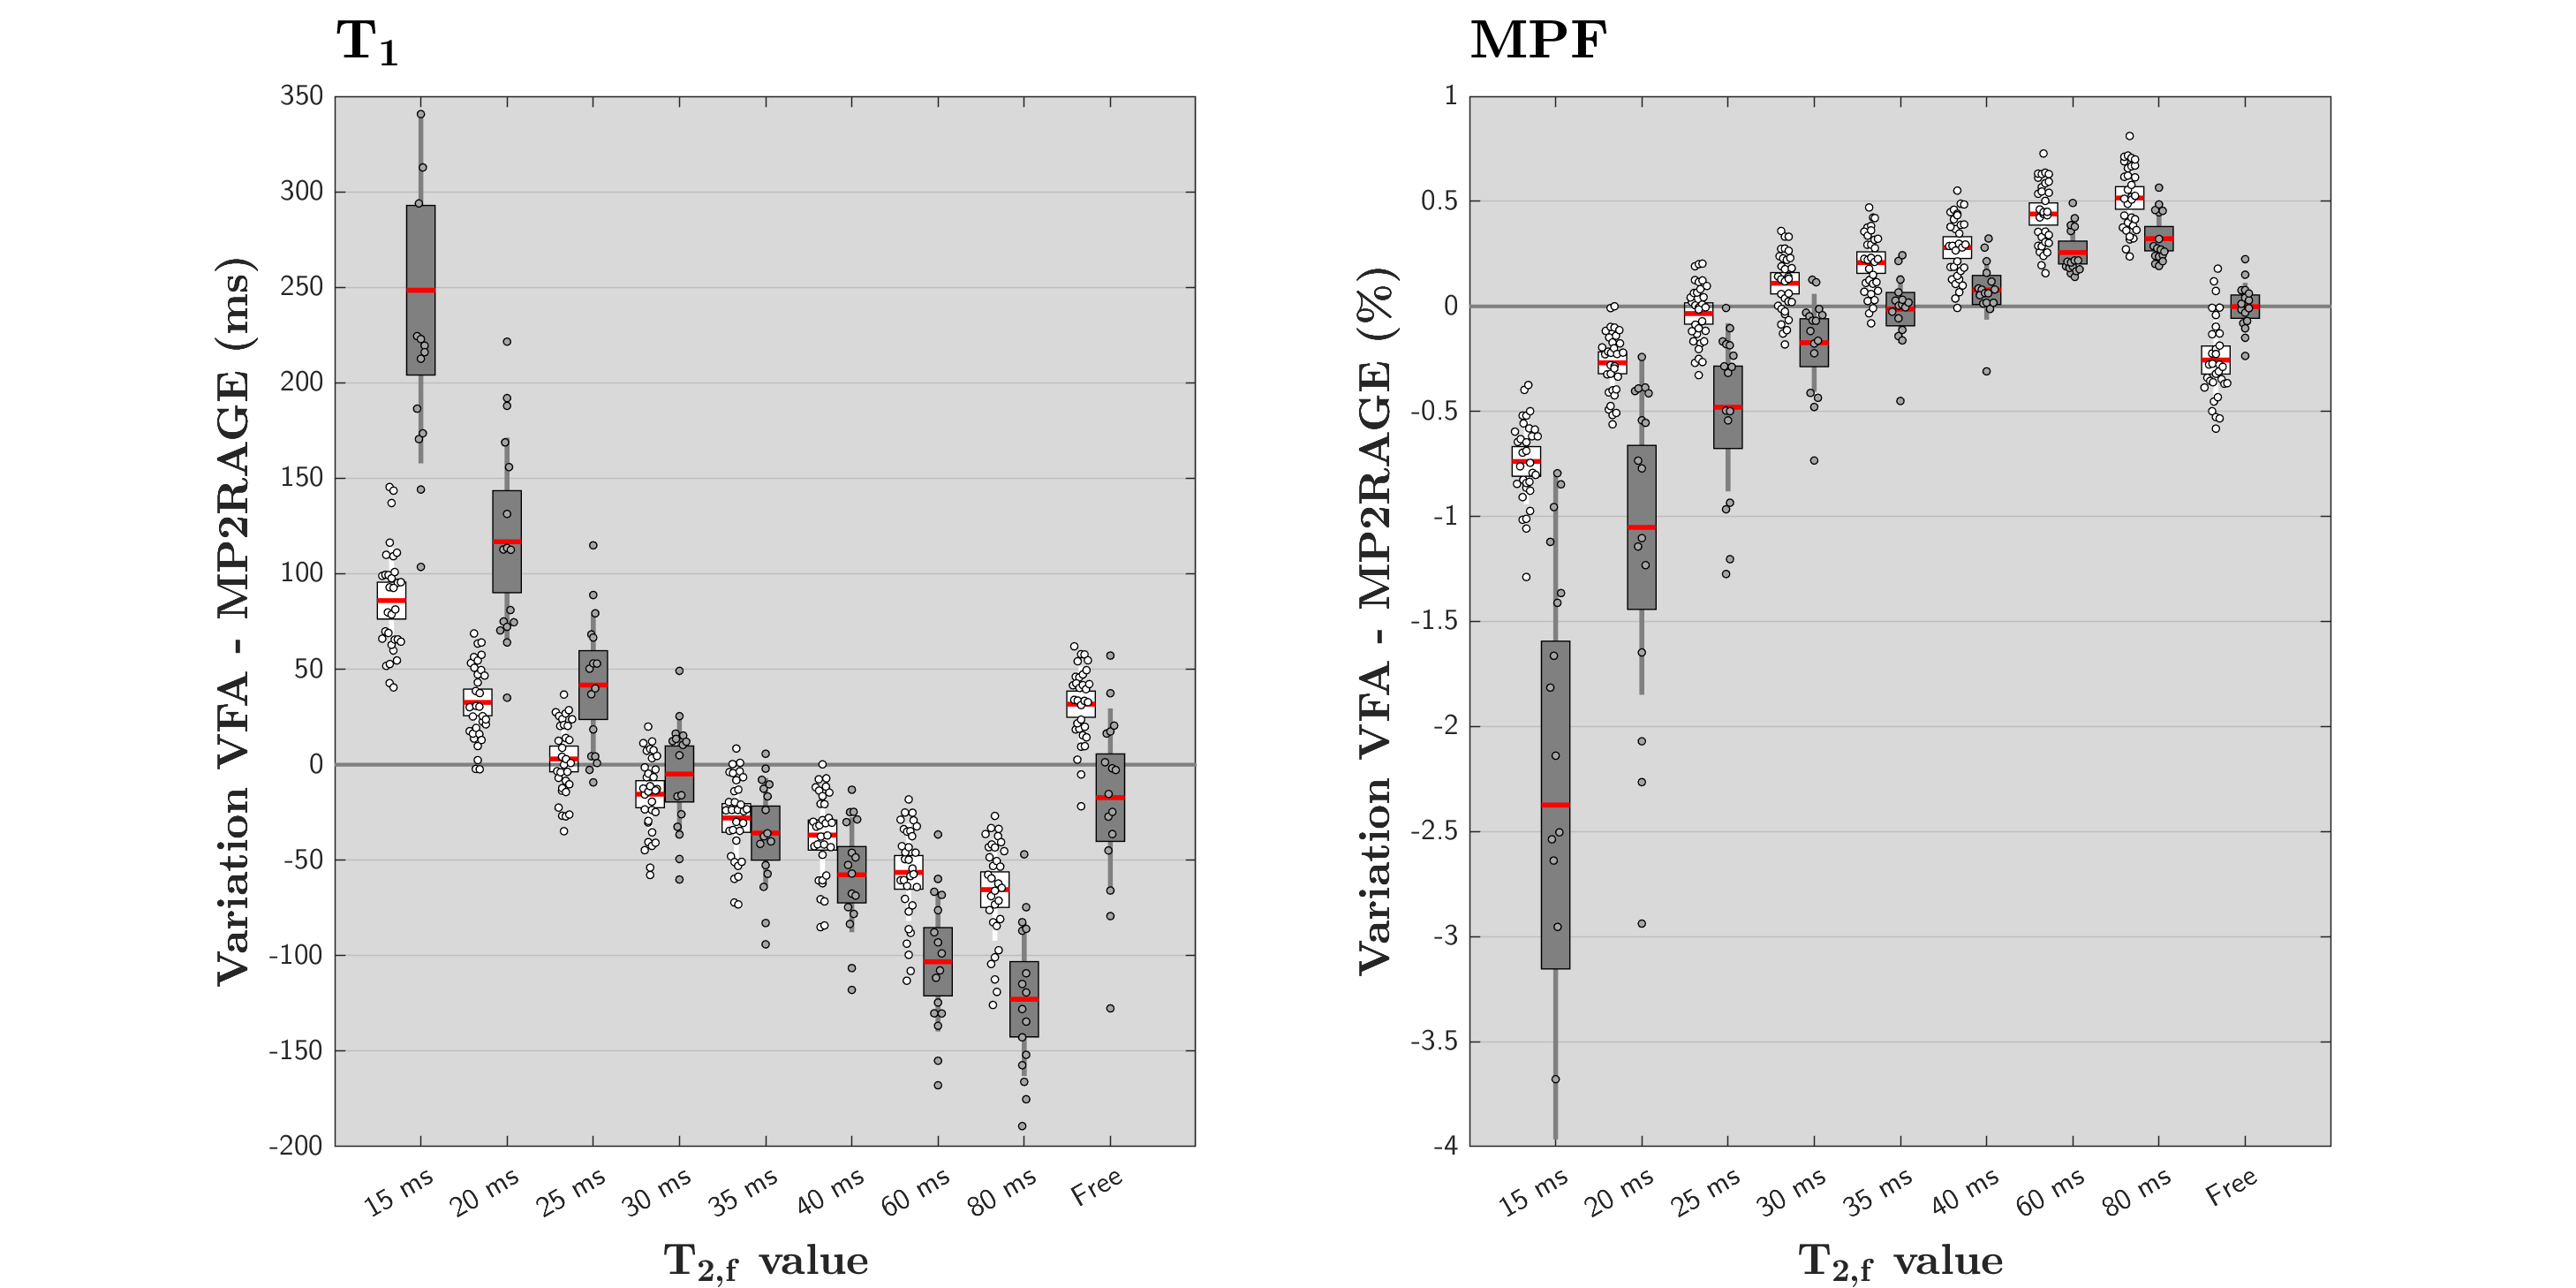
Simulation results of the effective Q (Figure 1) indicate an important impact of T2,f, with values increasing from 0.65 (T2,f=5 ms) to a plateau around 0.91-0.92 (T2,f=1000 ms). A noticeable discrepancy between WM and GM is observed starting at T2,f=20 ms, with a difference of 0.01 at T2,f=1000 ms, emphasizing that qMT parameter differences between WM and GM mildly impact Q for the same T2,f.Figure 2 shows boxplots of the relative variations of T1 and MPF induced by the T2,f effect on the model. The difference between both frameworks decreases as T2,f increases, yields a close-to-zero variation in average for T2,f=25-35 ms, and increases (in absolute) afterward. As T2,f is free for estimation, average variations in WM/GM amounted to 31.7/‑17.2 ms and ‑0.26/0.01% for T1 and MPF, respectively.
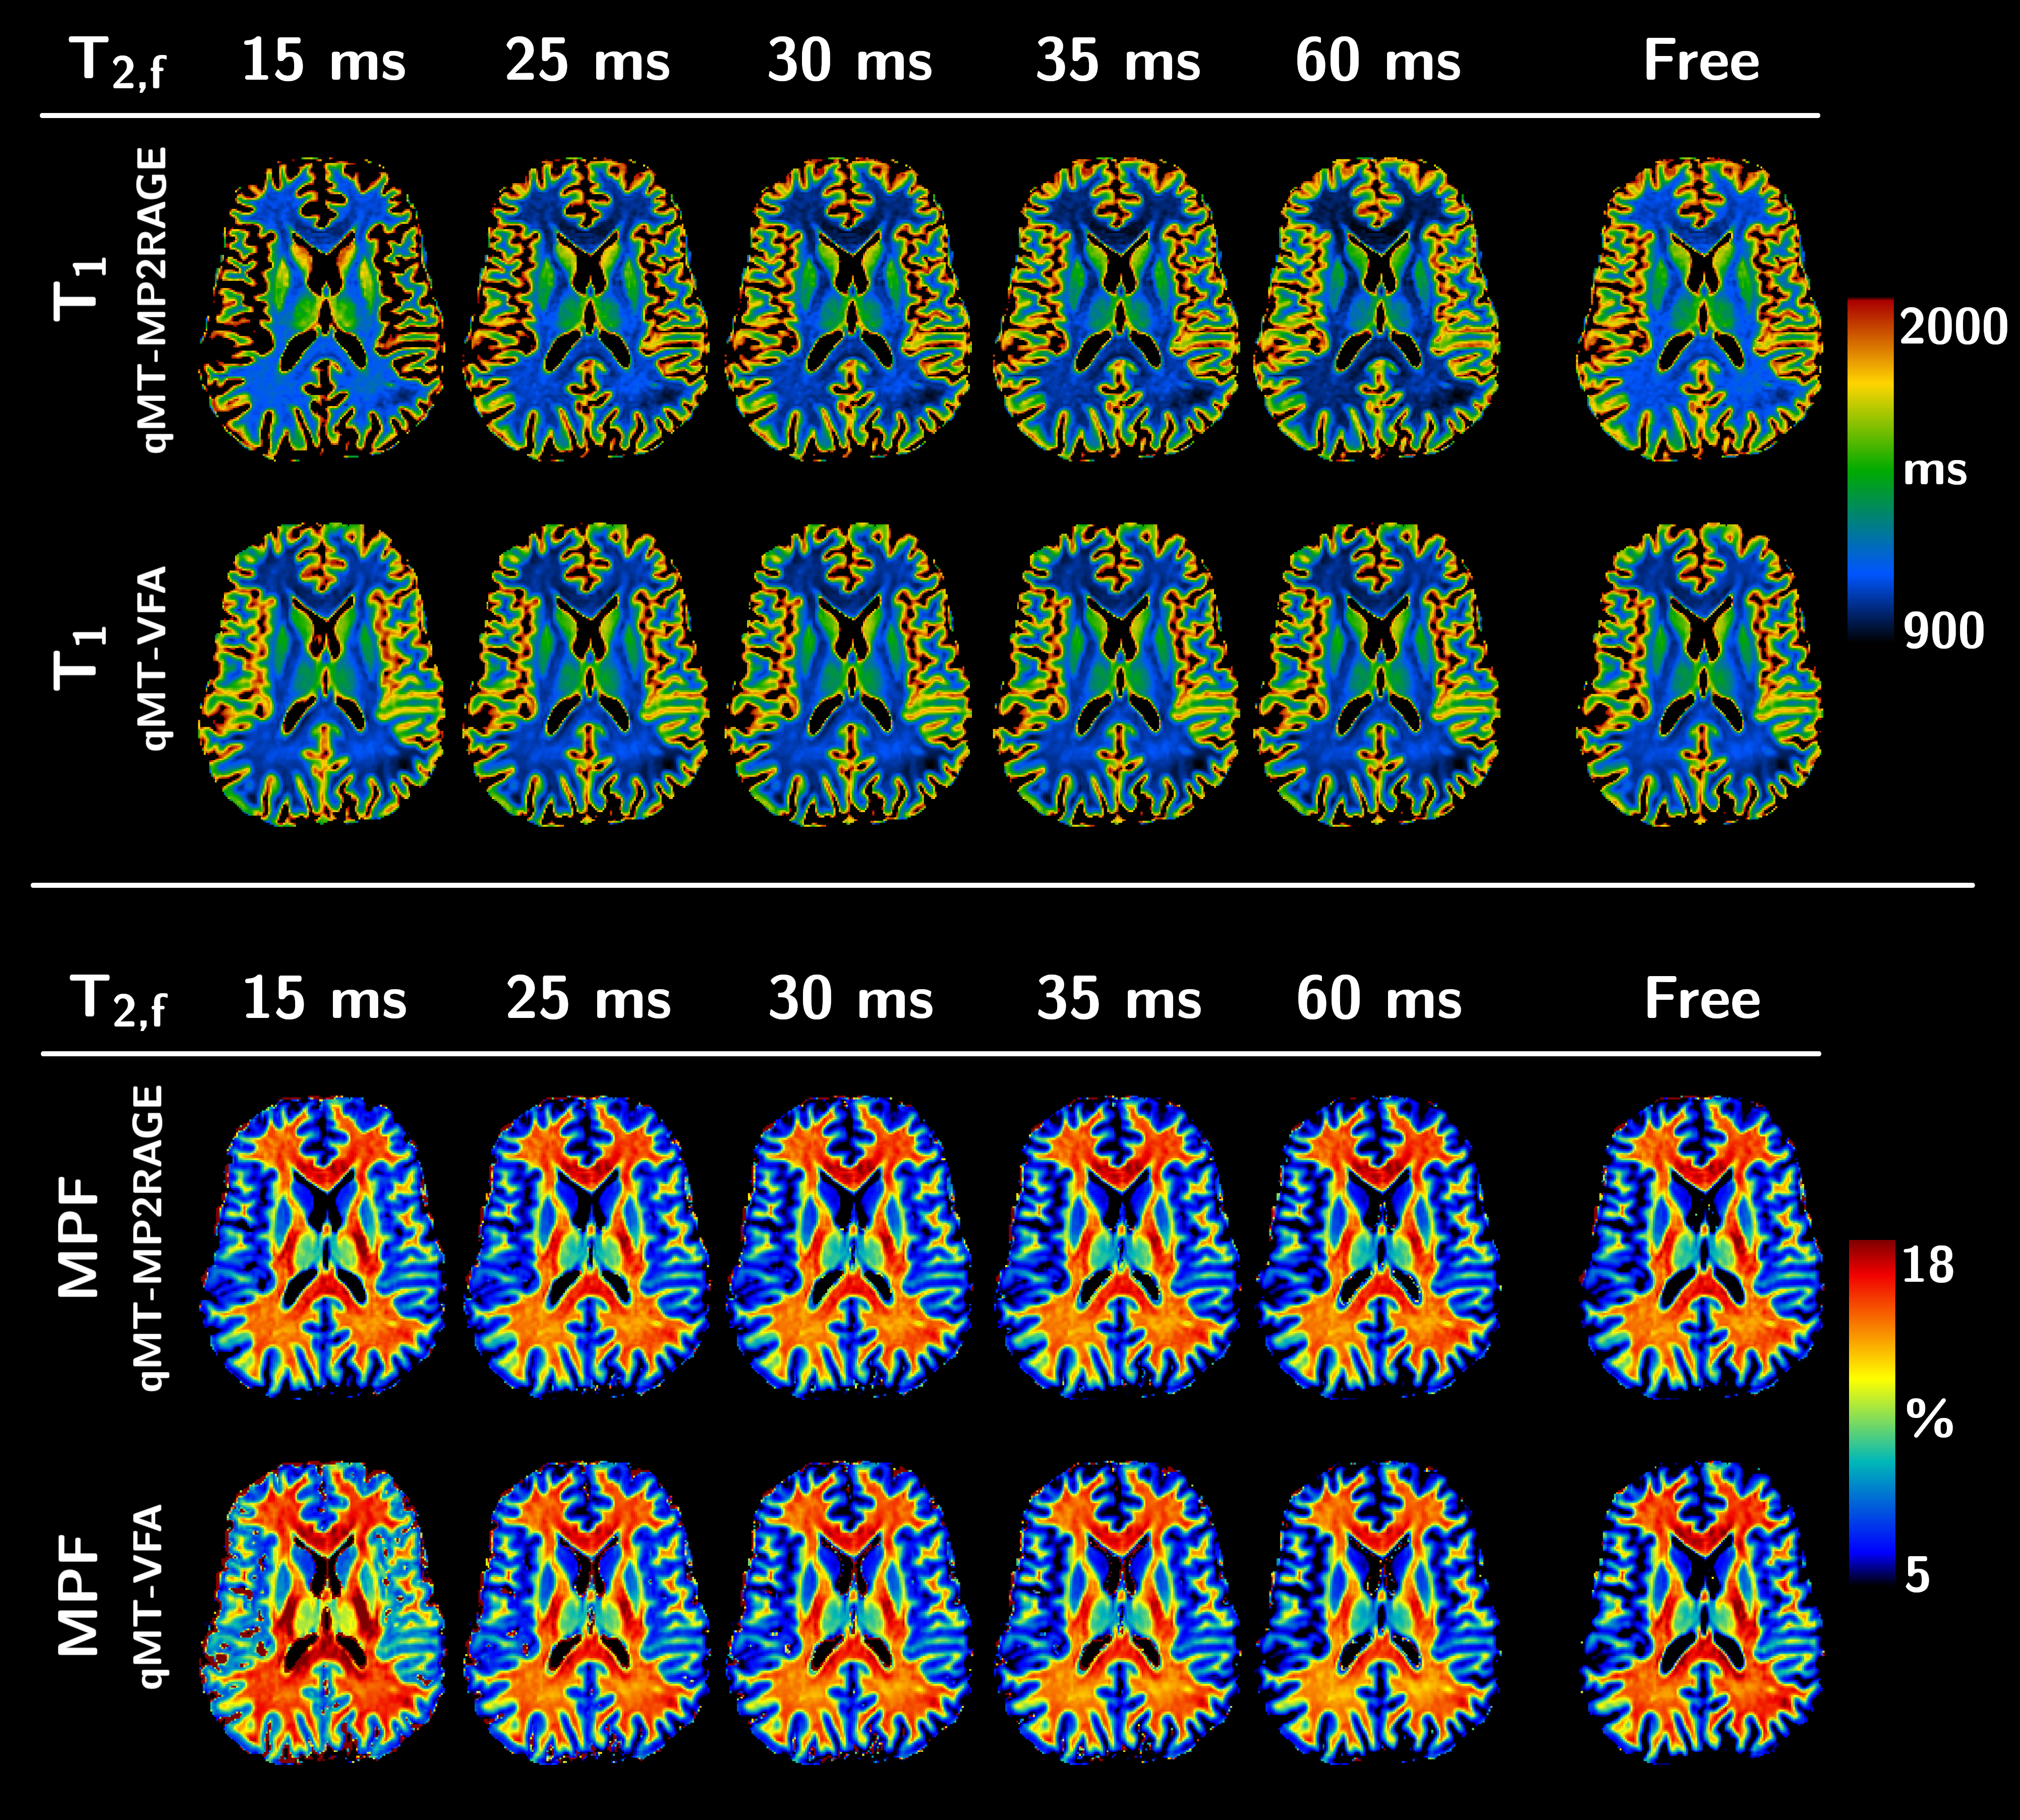
Selected T1 and MPF representative views are presented in Figure 3. A similarity between frameworks is observed for fixed T2,f from 25 to 35 ms, whereas a noticeable discrepancy is seen as T2,f is left free. Fixed T2,f values above 15 ms barely affect maps derived from the VFA-based framework.
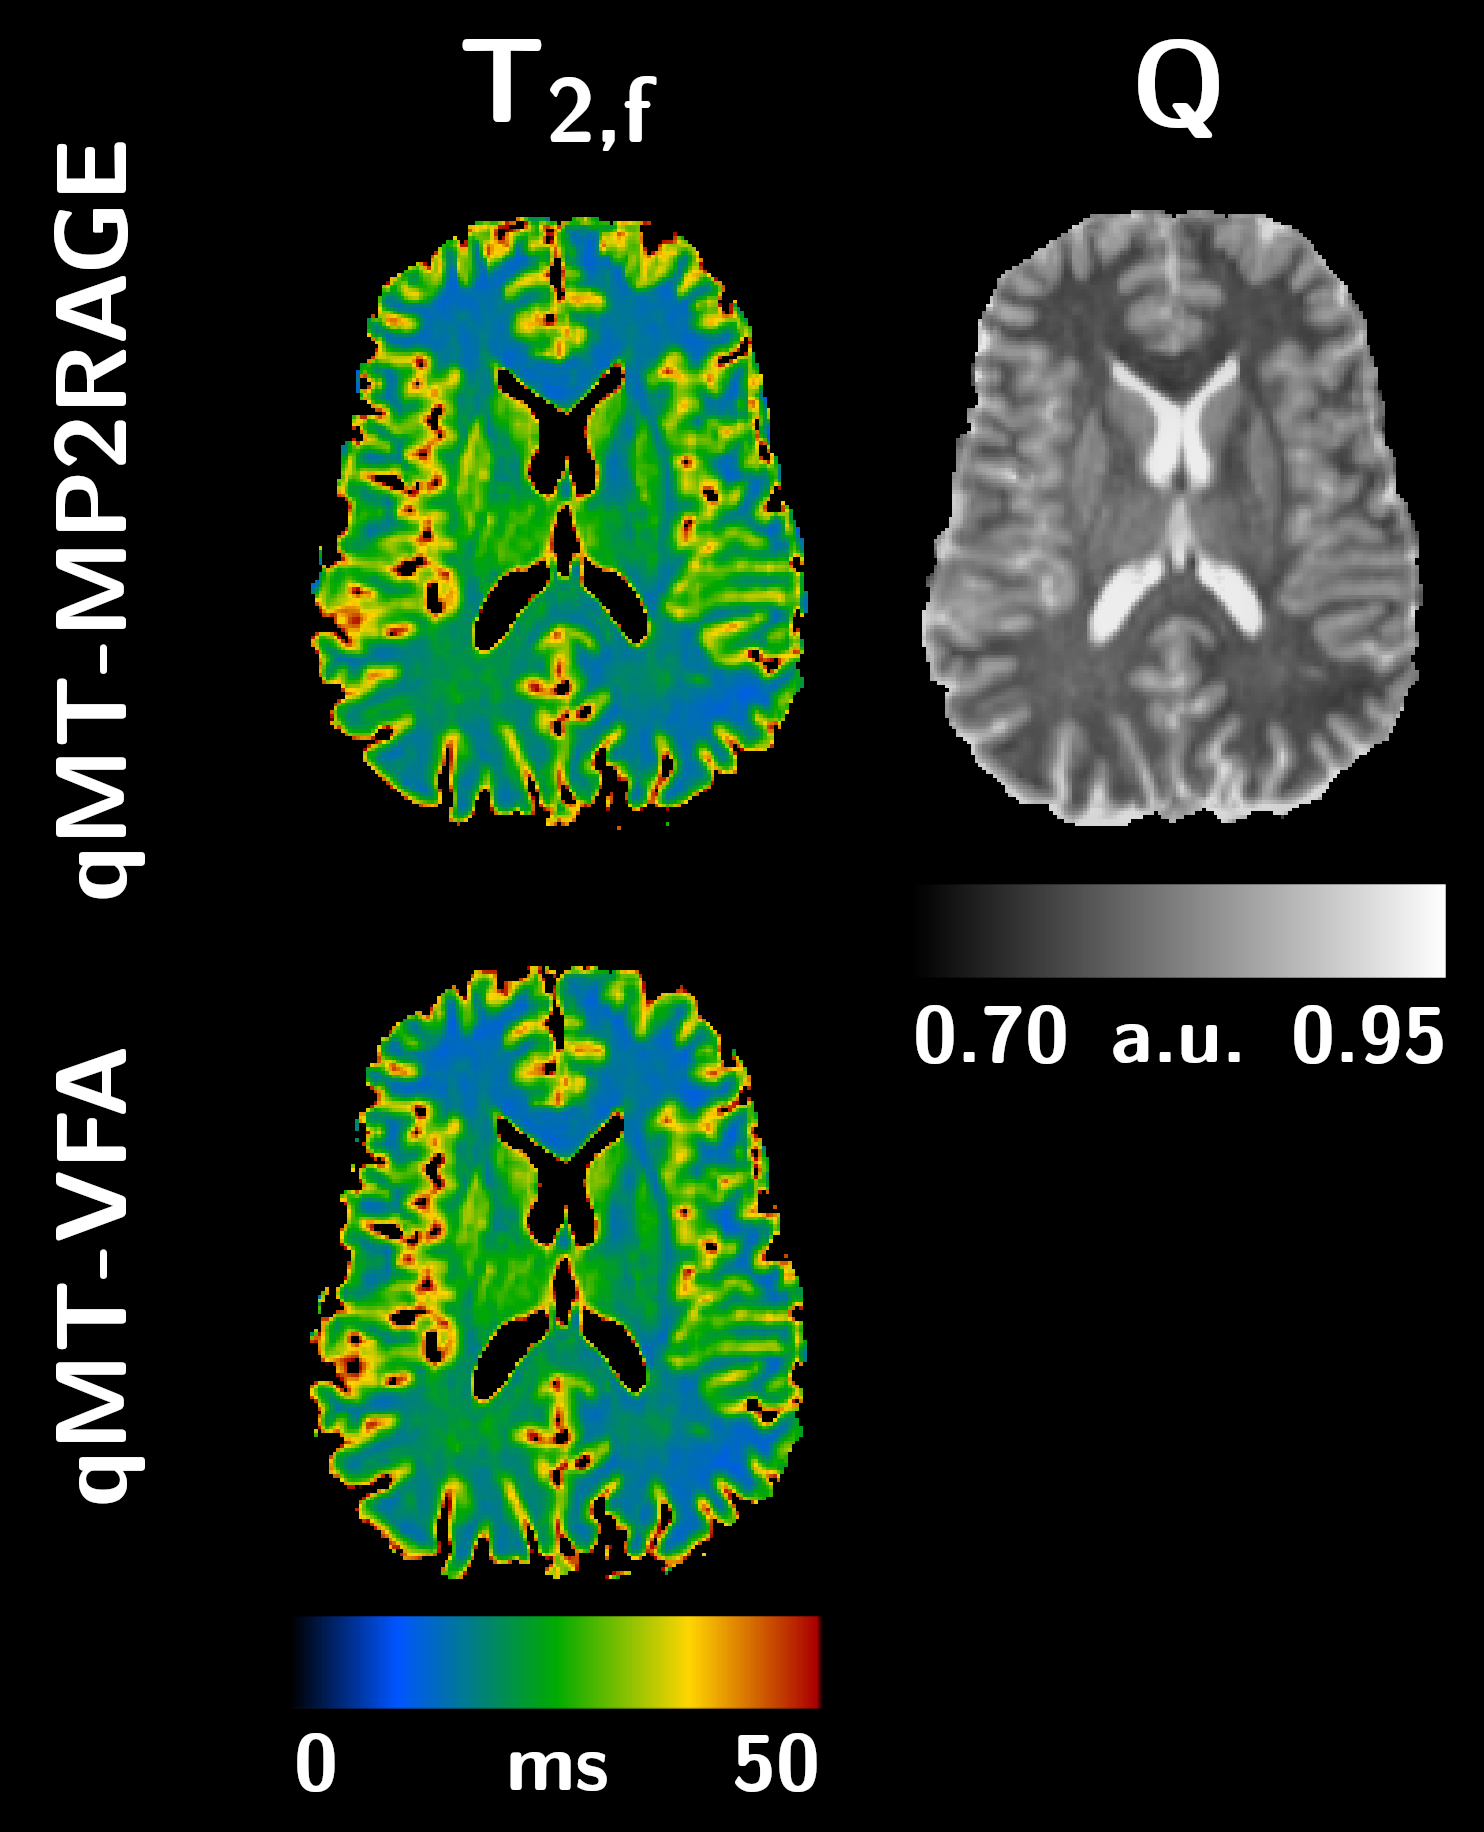
Representative views of T2,f and Q maps are provided in Figure 4. Almost no difference can be observed on T2,f maps between both frameworks. From the qMT-MP2RAGE framework, a high Pearson correlation (R2=0.96) was estimated between Q and T2,f.
Discussion and conclusion
We confirmed that accounting for MT effects is essential to mitigate the discrepancy between VFA- and MP2RAGE-based T1 mapping. However, T2,f relaxation during the HS1-AFP pulse in MP2RAGE proved to impact Q, which in turns bias T1 and MPF estimations as emphasized by the fixed T2,f results. Estimated T2,f values were similar with previously reported ones from the qMT-VFA framework7 (20.1±2.8 ms in WM, 32.2±6.0 ms in GM), and nonetheless yielded a non-negligeable bias on T1 and MPF. We envision that the classical modeling of the T2,f characteristic in Z-spectra analyses is lacking in comprehensiveness because it does not account for the saturation pulse spectral response, and also because multiple water pools may need to be considered9,10. Further investigations shall address these specific issues to yield an appropriate model that will unify both MP2RAGE- and VFA-T1 mapping frameworks.Acknowledgements
This work was supported by the French National Research Agency ANR [ANR‐22‐CE17‐0060]. This work was performed by a laboratory member of France Life Imaging network (grant ANR-11-INBS-0006).References
1. Marques JP, Kober T, Krueger G, van der Zwaag W, Van de Moortele P-F, Gruetter R. MP2RAGE, a self bias-field corrected sequence for improved segmentation and T1-mapping at high field. Neuroimage. 2010;49(2):1271-1281. doi:10.1016/j.neuroimage.2009.10.002
2. Does MD. Inferring brain tissue composition and microstructure via MR relaxometry. Neuroimage. 2018;(October 2017):1-13. doi:10.1016/j.neuroimage.2017.12.087
3. Margaret Cheng H-L, Stikov N, Ghugre NR, Wright GA. Practical medical applications of quantitative MR relaxometry. J Magn Reson Imaging. 2012;36(4):805-824. doi:10.1002/jmri.23718
4. Harkins KD, Xu J, Dula AN, et al. The microstructural correlates of T1 in white matter. Magn Reson Med. 2015;00(February):n/a-n/a. doi:10.1002/mrm.25709
5. Soustelle L, Hertanu A, Troalen T, et al. Disentangling T1 relaxation from MT effects in the MP2RAGE sequence. In: Proceedings 32nd Scientific Meeting, International Society for Magnetic Resonance in Medicine. Toronto, Canada; 2023:1363.
6. Olsson H, Andersen M, Kadhim M, Helms G. MP3RAGE: Simultaneous mapping of T 1 and B1+ in human brain at 7T. Magn Reson Med. 2022;87(6):2637-2649. doi:10.1002/mrm.29151
7. Soustelle L, Troalen T, Hertanu A, et al. Quantitative magnetization transfer <scp>MRI</scp> unbiased by <scp>on‐resonance</scp> saturation and dipolar order contributions. Magn Reson Med. 2023;90(3):875-893. doi:10.1002/mrm.29678
8. Malik SJ, Teixeira RPAG, West DJ, Wood TC, Hajnal J V. Steady‐state imaging with inhomogeneous magnetization transfer contrast using multiband radiofrequency pulses. Magn Reson Med. 2020;83(3):935-949. doi:10.1002/mrm.27984
9. Mackay A, Whittall K, Adler J, Li D, Paty D, Graeb D. In vivo visualization of myelin water in brain by magnetic resonance. Magn Reson Med. 1994;31(6):673-677. doi:10.1002/mrm.1910310614
10. Manning AP, MacKay AL, Michal CA. Understanding aqueous and non-aqueous proton T1 relaxation in brain. J Magn Reson. 2021;323:106909. doi:10.1016/j.jmr.2020.106909
11. Wakana S, Caprihan A, Panzenboeck MM, et al. Reproducibility of quantitative tractography methods applied to cerebral white matter. Neuroimage. 2007;36(3):630-644. doi:10.1016/j.neuroimage.2007.02.049
12. Dale AM, Fischl B, Sereno MI. Cortical Surface-Based Analysis. Neuroimage. 1999;9(2):179-194. doi:10.1006/nimg.1998.0395
Figures