2169
Fast full-brain relaxometry in the clinic using MR-STAT1Computational Imaging Group for MR Therapy and Diagnostics, UMC Utrecht, Utrecht, Netherlands, 2Department of Radiology and Nuclear Medicine, UMC Utrecht, Utrecht, Netherlands, 3Department of Neurosciences, University of Turin, Turin, Italy, 4Department of Radiology, Amsterdam UMC, Amsterdam, Netherlands, 5Department of Radiotherapy, UMC Utrecht, Utrecht, Netherlands, 6Department of Medical Imaging, Radboud UMC, Nijmegen, Netherlands
Synopsis
Keywords: Relaxometry, Quantitative Imaging, Relaxometry, MR-STAT, Clinical
Motivation: This is the first work assessing quantitative values (T1 and T2) from Magnetic Resonance Spin TomogrAphy in Time-domain (MR-STAT) as a fast relaxometry technique in clinical setting.
Goal(s): To assess MR-STAT as viable option for fast relaxometry in the clinic.
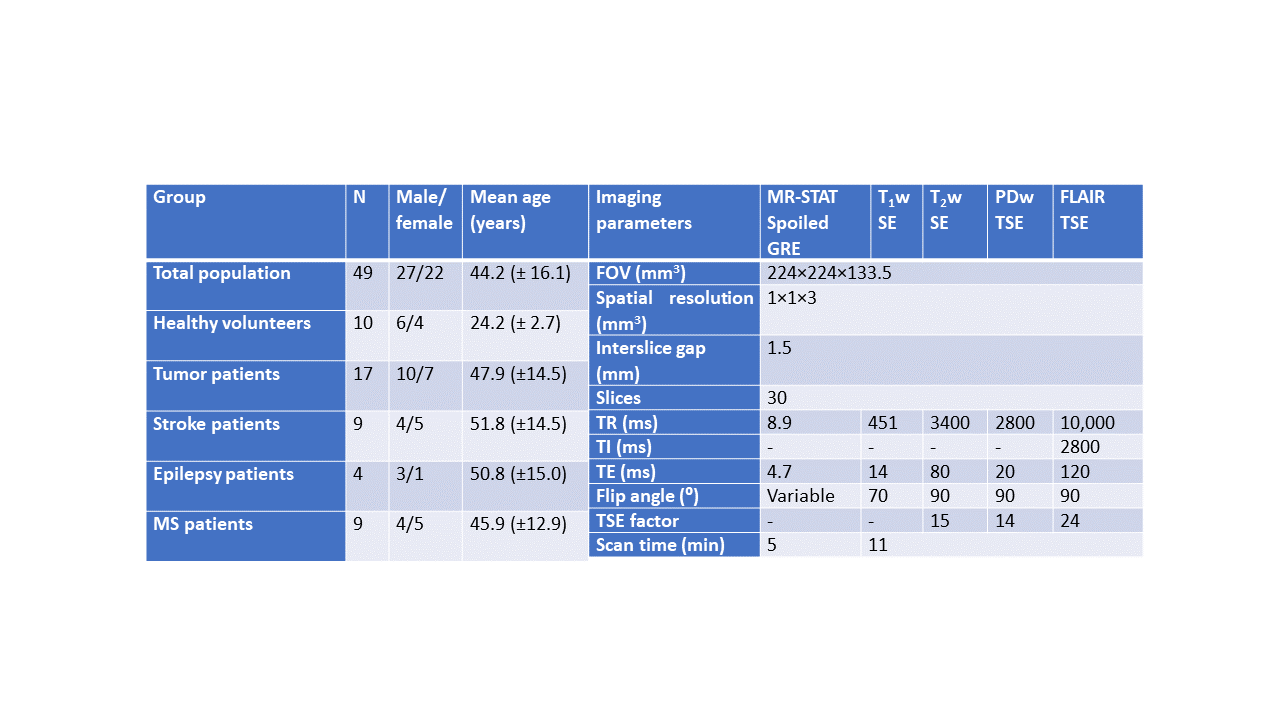
Approach: We applied MR-STAT to investigate the quantitative T1 and T2 values of brain tissue at 3T in a heterogeneous cohort of 50 subjects (10 healthy volunteers, mixed-pathology 40 patients).
Results: Quantitative values in normal appearing brain tissue were comparable to earlier literature. Furthermore, individual case examples (glioma, multiple sclerosis) confirmed the ability to discern pathological tissue in T1 and T2 values.
Impact: Voxel values in clinical MRI are subjective. Magnetic Resonance Spin TomogrAphy in Time-domain (MR-STAT) quickly quantifies MR tissue properties and gives voxels quantitative values. This work demonstrates MR-STAT as fast relaxometry technique in a clinical population and assesses quantitative values.
Introduction
Magnetic Resonance Spin TomogrAphy in Time-domain (MR-STAT) is a multiparametric quantitative MRI (qMRI) technique that allows simultaneous full-brain cartesian-encoded T1- and T2-mapping within 5 minutes. The quantitative parameter maps are reconstructed from time-domain data by solving a large scale non-linear inversion problem1.Studies addressing normative relaxation times of grey and white matter (GM/WM) have been conducted for other qMRI techniques(2–5), but not for MR-STAT. Therefore, the aim of this observational study is to assess MR-STAT as fast relaxometry technique by reporting T1 and T2 of normal appearing GM (NAGM), normal appearing WM (NAWM) and subcortical brain structures and comparing results to literature. Additionally, this study explores potential clinical applications by investigating relaxation times in case examples in two cerebral conditions, namely: primary brain tumor (glioma) and multiple sclerosis (MS).
Methods
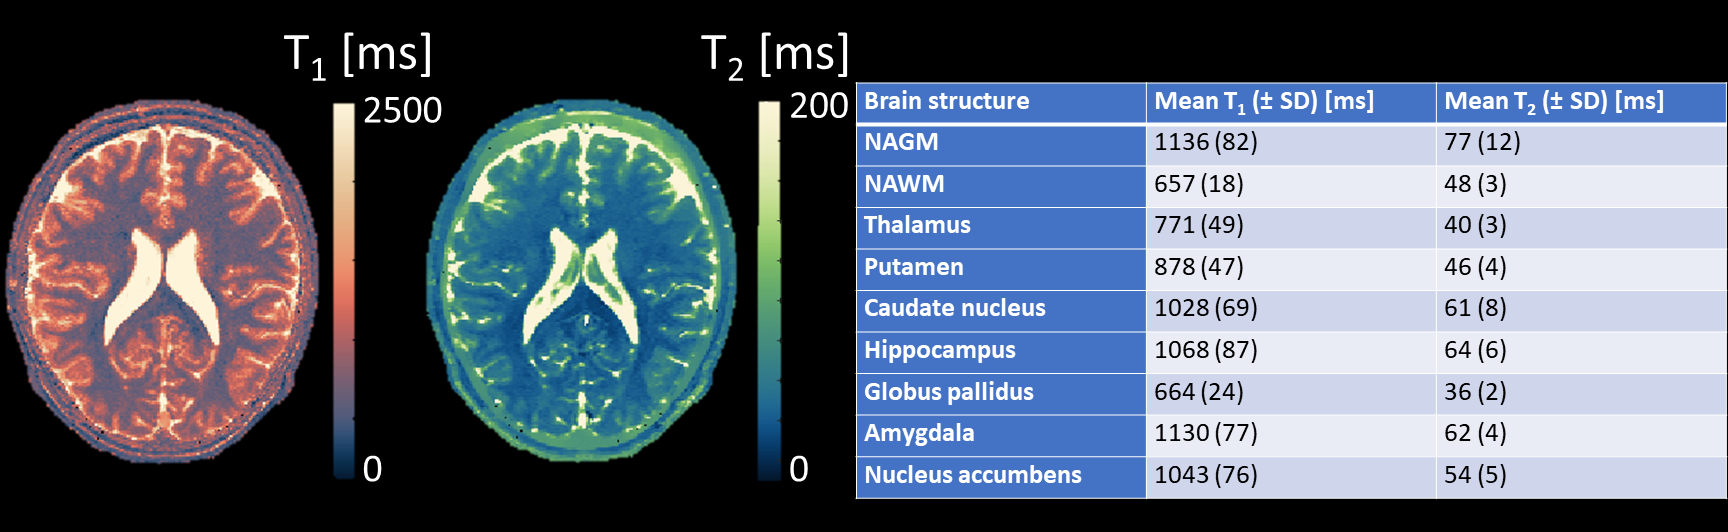
50 adults (21-79 years old) were included in an MR-STAT clinical study6 (Figure 1A). One patient with bilateral stroke lesions was excluded from the analysis since normal appearing tissue could insufficiently be identified.MRI acquisitions (Figure 1B) and data reconstruction were performed according to published methods6,7. Automatic segmentations of brain structures (see Figure 2) were performed using Vol2brain8. Lesions were manually segmented using FSL9 and subtracted from all other masks. Mean T1 and T2 values were reported for each brain structure for healthy volunteers. Differences between the lobes (frontal, temporal, occipital, parietal) of the left and right hemisphere from healthy volunteers were tested using a Kolmogorov-Smirnov test. Pearson’s r coefficient was computed between T1 of subcortical structures and available literature values5,10.
Using a Mann-Whitney U test, we compared the T1 as well as the T2 of both NAGM and NAWM of the healthy controls to the four patients groups and found that intergroup differences were not significant. Therefore, the participant groups were bundled for further statistical analysis.
A Mann-Whitney U test was performed to compare between the T1 and T2 of NAGM and NAWM of male versus female participants. The dependency of T1 and T2 of NAGM and NAWM on age was tested by fitting a second order polynomial fit after which Bonferroni correction was applied.
For one glioma patient and one MS patient, a case illustration concerning T1 and T2 values were provided (Figure 2 and 3).
Results
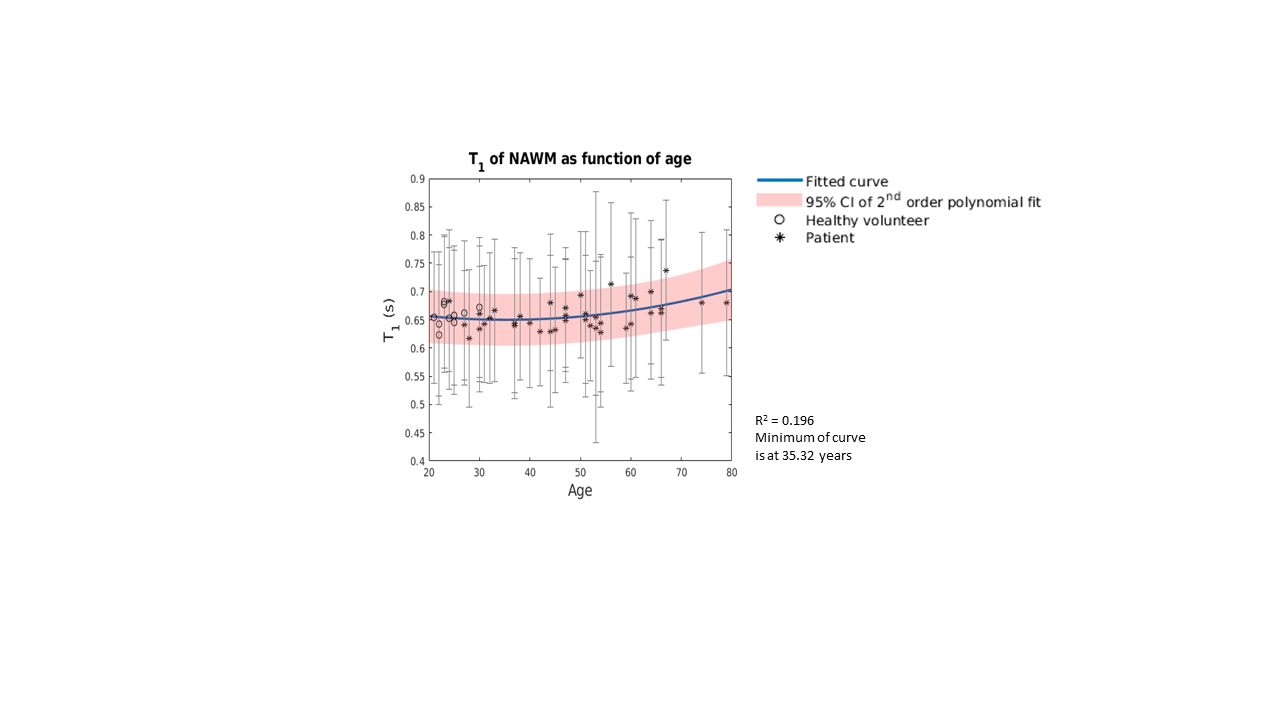
Mean T1 and T2 (±1 SD) of each brain structure were reported for healthy volunteers (Figure 2). We found Pearson’s r = 0.99 for T1 of subcortical structures reported in literature5,10. A comparison to literature for the T2 values could not be made due to scarce recently published data.Differences found between male and female participants and between left and right brain lobes were not significant. A statistically significant correlation between age and T1 of NAWM (R2 = 0.196, p = 0.007) was observed (Figure 3). This correlation was not significant for T1 and T2 of NAGM and T2 of NAWM.
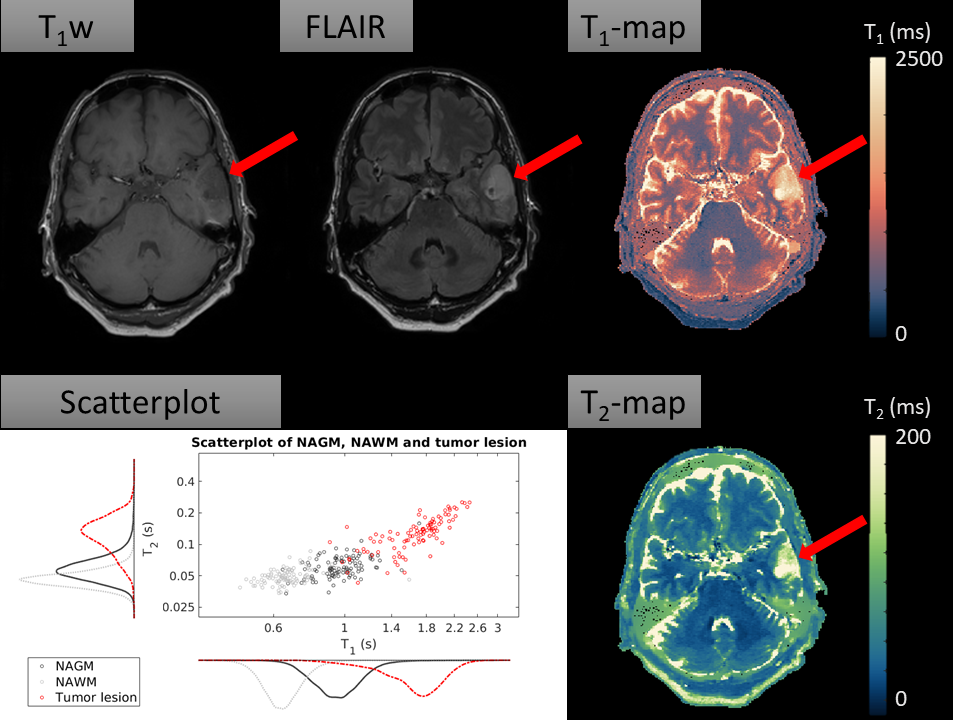
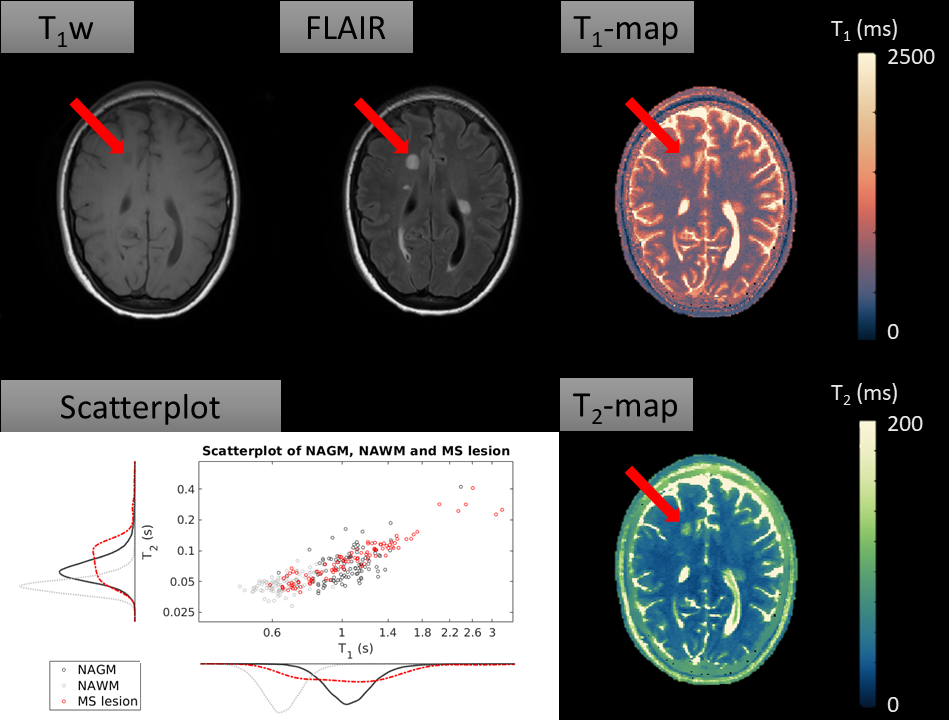
Figures 4 and 5 display the T1w, FLAIR, T1-map and T2-map for a glioma patient and an MS patient, respectively. A scatterplot with histograms visualizing quantitative data distribution is shown. For the tumor patient, the lesion’s T1 showed an increase of 74.3% and 161.4% compared to NAGM and NAWM, while the lesion’s T2 showed an increase of 114.4% and 177.8% compared to NAGM and NAWM.
For the MS patient (Figure 5), the lesion showed an increase of 68.6% in T1 and of 85.1% in T2 compared to NAWM.
In both patients, contrast was not administered so the enhancement status is unknown
Discussion & conclusion
Fast full-brain relaxometry with MR-STAT was assessed in a clinical population. The reported T1 and T2 of NAGM and NAWM and the reported T1 values of subcortical structures agree with literature2-5,11–28.Results on (non-significant) differences in sex, left and right brain lobes and correlation between T1 and age, as well as the increase in T1 and T2 observed in the pathological tissue (glioma, MS) are in agreement with literature10,29–31. In contrast to our results, a significant correlation between T1 and T2 of NAGM and T2 of NAWM, and age could be found in literature29.
Data might be subject to partial volume effects as a 2D acquisition protocol with limited resolution in the slice direction and a 1.5 mm interslice gap was used. Increased resolution could alleviate these effects.
To conclude, these results add to the validity of MR-STAT as viable option for fast relaxometry in the clinic.
Acknowledgements
No acknowledgement found.References
1. Sbrizzi A, Heide O van der, Cloos M, et al. Fast quantitative MRI as a nonlinear tomography problem. Magn Reson Imaging. 2018;46:56-63. doi:10.1016/j.mri.2017.10.015
2. Choi JY, Hu S, Su T-Y, et al. Normative quantitative relaxation atlases for characterization of cortical regions using magnetic resonance fingerprinting. Cereb Cortex. 2023;33(7):3562-3574. doi:10.1093/cercor/bhac292
3. Ndengera M, Delattre BMA, Scheffler M, Lövblad K, Meling TR, Vargas MI. Relaxation time of brain tissue in the elderly assessed by synthetic MRI. Brain Behav. 2022;12(1). doi:10.1002/brb3.2449
4. Ma S, Nguyen CT, Han F, et al. Three‐dimensional simultaneous brain T 1 , T 2 , and ADC mapping with MR Multitasking. Magn Reson Med. 2020;84(1):72-88. doi:10.1002/mrm.28092
5. Wang Y, Chen Y, Wu D, et al. STrategically Acquired Gradient Echo (STAGE) imaging, part II: Correcting for RF inhomogeneities in estimating T1 and proton density. Magn Reson Imaging. 2018;46:140-150. doi:10.1016/j.mri.2017.10.006
6. Kleinloog JPD, Mandija S, D’Agata F, et al. Synthetic MRI with Magnetic Resonance Spin TomogrAphy in Time-Domain (MR-STAT): Results from a Prospective Cross-Sectional Clinical Trial. J Magn Reson Imaging. 2023;57(5):1451-1461. doi:https://doi.org/10.1002/jmri.28425
7. Liu H, van der Heide O, Mandija S, van den Berg CAT, Sbrizzi A. Acceleration Strategies for MR-STAT: Achieving High-Resolution Reconstructions on a Desktop PC Within 3 Minutes. IEEE Trans Med Imaging. 2022;41(10):2681-2692. doi:10.1109/TMI.2022.3168436
8. Manjón J V., Romero JE, Vivo-Hernando R, et al. vol2Brain: A New Online Pipeline for Whole Brain MRI Analysis. Front Neuroinform. 2022;16. doi:10.3389/fninf.2022.862805
9. McCarthy P. FSLeyes. Published online June 13, 2023. doi:10.5281/ZENODO.8033457
10. Okubo G, Okada T, Yamamoto A, et al. Relationship between aging and T 1 relaxation time in deep gray matter: A voxel-based analysis. J Magn Reson Imaging. 2017;46(3):724-731. doi:10.1002/jmri.25590
11. Benjamin AJV, Gómez PA, Golbabaee M, et al. Multi-shot Echo Planar Imaging for accelerated Cartesian MR Fingerprinting: An alternative to conventional spiral MR Fingerprinting. Magn Reson Imaging. 2019;61:20-32. doi:10.1016/j.mri.2019.04.014
12. Cao X, Ye H, Liao C, Li Q, He H, Zhong J. Fast 3D brain MR fingerprinting based on multi‐axis spiral projection trajectory. Magn Reson Med. 2019;82(1):289-301. doi:10.1002/mrm.27726
13. Khajehim M, Christen T, Tam F, Graham SJ. Streamlined magnetic resonance fingerprinting: Fast whole-brain coverage with deep-learning based parameter estimation. Neuroimage. 2021;238:118237. doi:10.1016/j.neuroimage.2021.118237
14. Cao X, Liao C, Iyer SS, et al. Optimized multi‐axis spiral projection <scp>MR</scp> fingerprinting with subspace reconstruction for rapid whole‐brain high‐isotropic‐resolution quantitative imaging. Magn Reson Med. 2022;88(1):133-150. doi:10.1002/mrm.29194
15. Konar AS, Shah AD, Paudyal R, et al. Quantitative Relaxometry Metrics for Brain Metastases Compared to Normal Tissues: A Pilot MR Fingerprinting Study. Cancers (Basel). 2022;14(22):5606. doi:10.3390/cancers14225606
16. Zou L, Liang D, Ye H, et al. Quantitative MR relaxation using MR fingerprinting with fractional-order signal evolution. J Magn Reson. 2021;330:107042. doi:https://doi.org/10.1016/j.jmr.2021.107042
17. Hilbert T, Xia D, Block KT, et al. Magnetization transfer in magnetic resonance fingerprinting. Magn Reson Med. 2020;84(1):128-141. doi:https://doi.org/10.1002/mrm.28096
18. Assländer J, Cloos MA, Knoll F, Sodickson DK, Hennig J, Lattanzi R. Low rank alternating direction method of multipliers reconstruction for MR fingerprinting. Magn Reson Med. 2018;79(1):83-96. doi:10.1002/mrm.26639
19. Lu L, Chen Y, Shen C, et al. Initial assessment of 3D magnetic resonance fingerprinting (MRF) towards quantitative brain imaging for radiation therapy. Med Phys. 2020;47(3):1199-1214. doi:10.1002/mp.13967
20. Chen Y, Fang Z, Hung S-C, Chang W-T, Shen D, Lin W. High-resolution 3D MR Fingerprinting using parallel imaging and deep learning. Neuroimage. 2020;206:116329. doi:https://doi.org/10.1016/j.neuroimage.2019.116329
21. Cao P, Cui D, Vardhanabhuti V, Hui ES. Development of fast deep learning quantification for magnetic resonance fingerprinting in vivo. Magn Reson Imaging. 2020;70:81-90. doi:10.1016/j.mri.2020.03.009
22. Rieger B, Akçakaya M, Pariente JC, et al. Time efficient whole-brain coverage with MR Fingerprinting using slice-interleaved echo-planar-imaging. Sci Rep. 2018;8(1):6667. doi:10.1038/s41598-018-24920-z
23. Nagtegaal M, Koken P, Amthor T, Doneva M. Fast multi-component analysis using a joint sparsity constraint for MR fingerprinting. Magn Reson Med. 2020;83(2):521-534. doi:https://doi.org/10.1002/mrm.27947
24. Deshmane A, McGivney DF, Ma D, et al. Partial volume mapping using magnetic resonance fingerprinting. NMR Biomed. 2019;32(5):e4082. doi:10.1002/nbm.4082
25. Körzdörfer G, Kirsch R, Liu K, et al. Reproducibility and Repeatability of MR Fingerprinting Relaxometry in the Human Brain. Radiology. 2019;292(2):429-437. doi:10.1148/radiol.2019182360
26. Buonincontri G, Biagi L, Retico A, et al. Multi-site repeatability and reproducibility of MR fingerprinting of the healthy brain at 1.5 and 3.0 T. Neuroimage. 2019;195:362-372. doi:10.1016/j.neuroimage.2019.03.047
27. Ma D, Jones SE, Deshmane A, et al. Development of high-resolution 3D MR fingerprinting for detection and characterization of epileptic lesions. J Magn Reson Imaging. 2019;49(5):1333-1346. doi:https://doi.org/10.1002/jmri.26319
28. Fang Z, Chen Y, Hung S, Zhang X, Lin W, Shen D. Submillimeter MR fingerprinting using deep learning–based tissue quantification. Magn Reson Med. 2020;84(2):579-591. doi:10.1002/mrm.28136
29. Badve C, Yu A, Rogers M, et al. Simultaneous T1 and T2 Brain Relaxometry in Asymptomatic Volunteers Using Magnetic Resonance Fingerprinting. Tomography. 2015;1(2):136-144. doi:10.18383/j.tom.2015.00166
30. Blystad I, Håkansson I, Tisell A, et al. Quantitative MRI for Analysis of Active Multiple Sclerosis Lesions without Gadolinium-Based Contrast Agent. Am J Neuroradiol. 2016;37(1):94-100. doi:10.3174/ajnr.A4501
31. Kikuchi K, Togao O, Yamashita K, et al. Quantitative relaxometry using synthetic MRI could be better than T2-FLAIR mismatch sign for differentiation of IDH-mutant gliomas: a pilot study. Sci Rep. 2022;12(1):9197. doi:10.1038/s41598-022-13036-0
Figures