2166
SH-CASA: A Novel Algorithm for Denoising Diffusion MRI Data using Spherical Harmonics1Department of R&D Advanced Applications, Olea Medical, La Ciotat, France
Synopsis
Keywords: Tractography, Diffusion/other diffusion imaging techniques, Denoising, tractography, CASA
Motivation: The diffusion MRI (dMRI) signal exhibits a low signal-to-noise ratio.
Goal(s): This study endeavors to enrich the quality of dMRI data by employing a pioneering denoising technique, which combines Component Analysis with Standard-deviation Attenuation (CASA) and Spherical Harmonics (SH).
Approach: Comparative analysis is conducted between the denoising capabilities of SH-based decomposition and the original PCA-based CASA technique using synthetic and in-vivo data.
Results: The findings demonstrate that both denoising methods notably enhance image and tractography quality. In the case of synthetic data, SH-CASA displayed the most substantial improvement.
Impact: Our novel denoising technique, SH-CASA, significantly enhances both the quality of raw diffusion MRI data and the resulting tractography. This holds particular significance in clinical settings where rescanning the patient is not always feasible.
INTRODUCTION
Diffusion MRI (dMRI) requires prolonged acquisition to achieve comprehensive imaging of white matter pathways, often resulting in a diminished Signal-to-Noise Ratio (SNR) in contrast to structural imaging. This study introduces an innovative denoising technique for dMRI, the Spherical Harmonics Component Analysis based on Standard-deviation Attenuation (SH-CASA). In contrast to the previously introduced Principal Component Analysis (PCA) CASA1,2, this updated approach leverages on the SH decomposition of the diffusion signal, and is uniquely tailored for handling dMRI data.METHODS
The CASA denoising method was initially devised for CEST imaging1 and is based on the PCA decomposition of MRI data. In various dMRI methodologies, the signal is represented as a weighted combination of Spherical Harmonics (SH) to encapsulate the directional dependence of the diffusion signal. Consequently, both PCA and SH involve projecting the signal onto a mathematical foundation—PCA using eigenvectors and SH relying on its basis. In this study, we substitute the PCA decomposition with the SH decomposition within the CASA algorithm for dMRI denoising. The SH-CASA method comprises three key steps.- The signal of each voxel undergoes decomposition into n Spherical Harmonics (SH) coefficients, where n is determined by the selected SH order for fitting.
- The coefficients representing the harmonics across various voxels can be interpreted as a structural image. We applied Gaussian smoothing to this image, adjusting its intensity based on the estimated noise level derived from the respective CASA rate1,2.
- The reconstructed signal is derived from the smoothed coefficients.
RESULTS
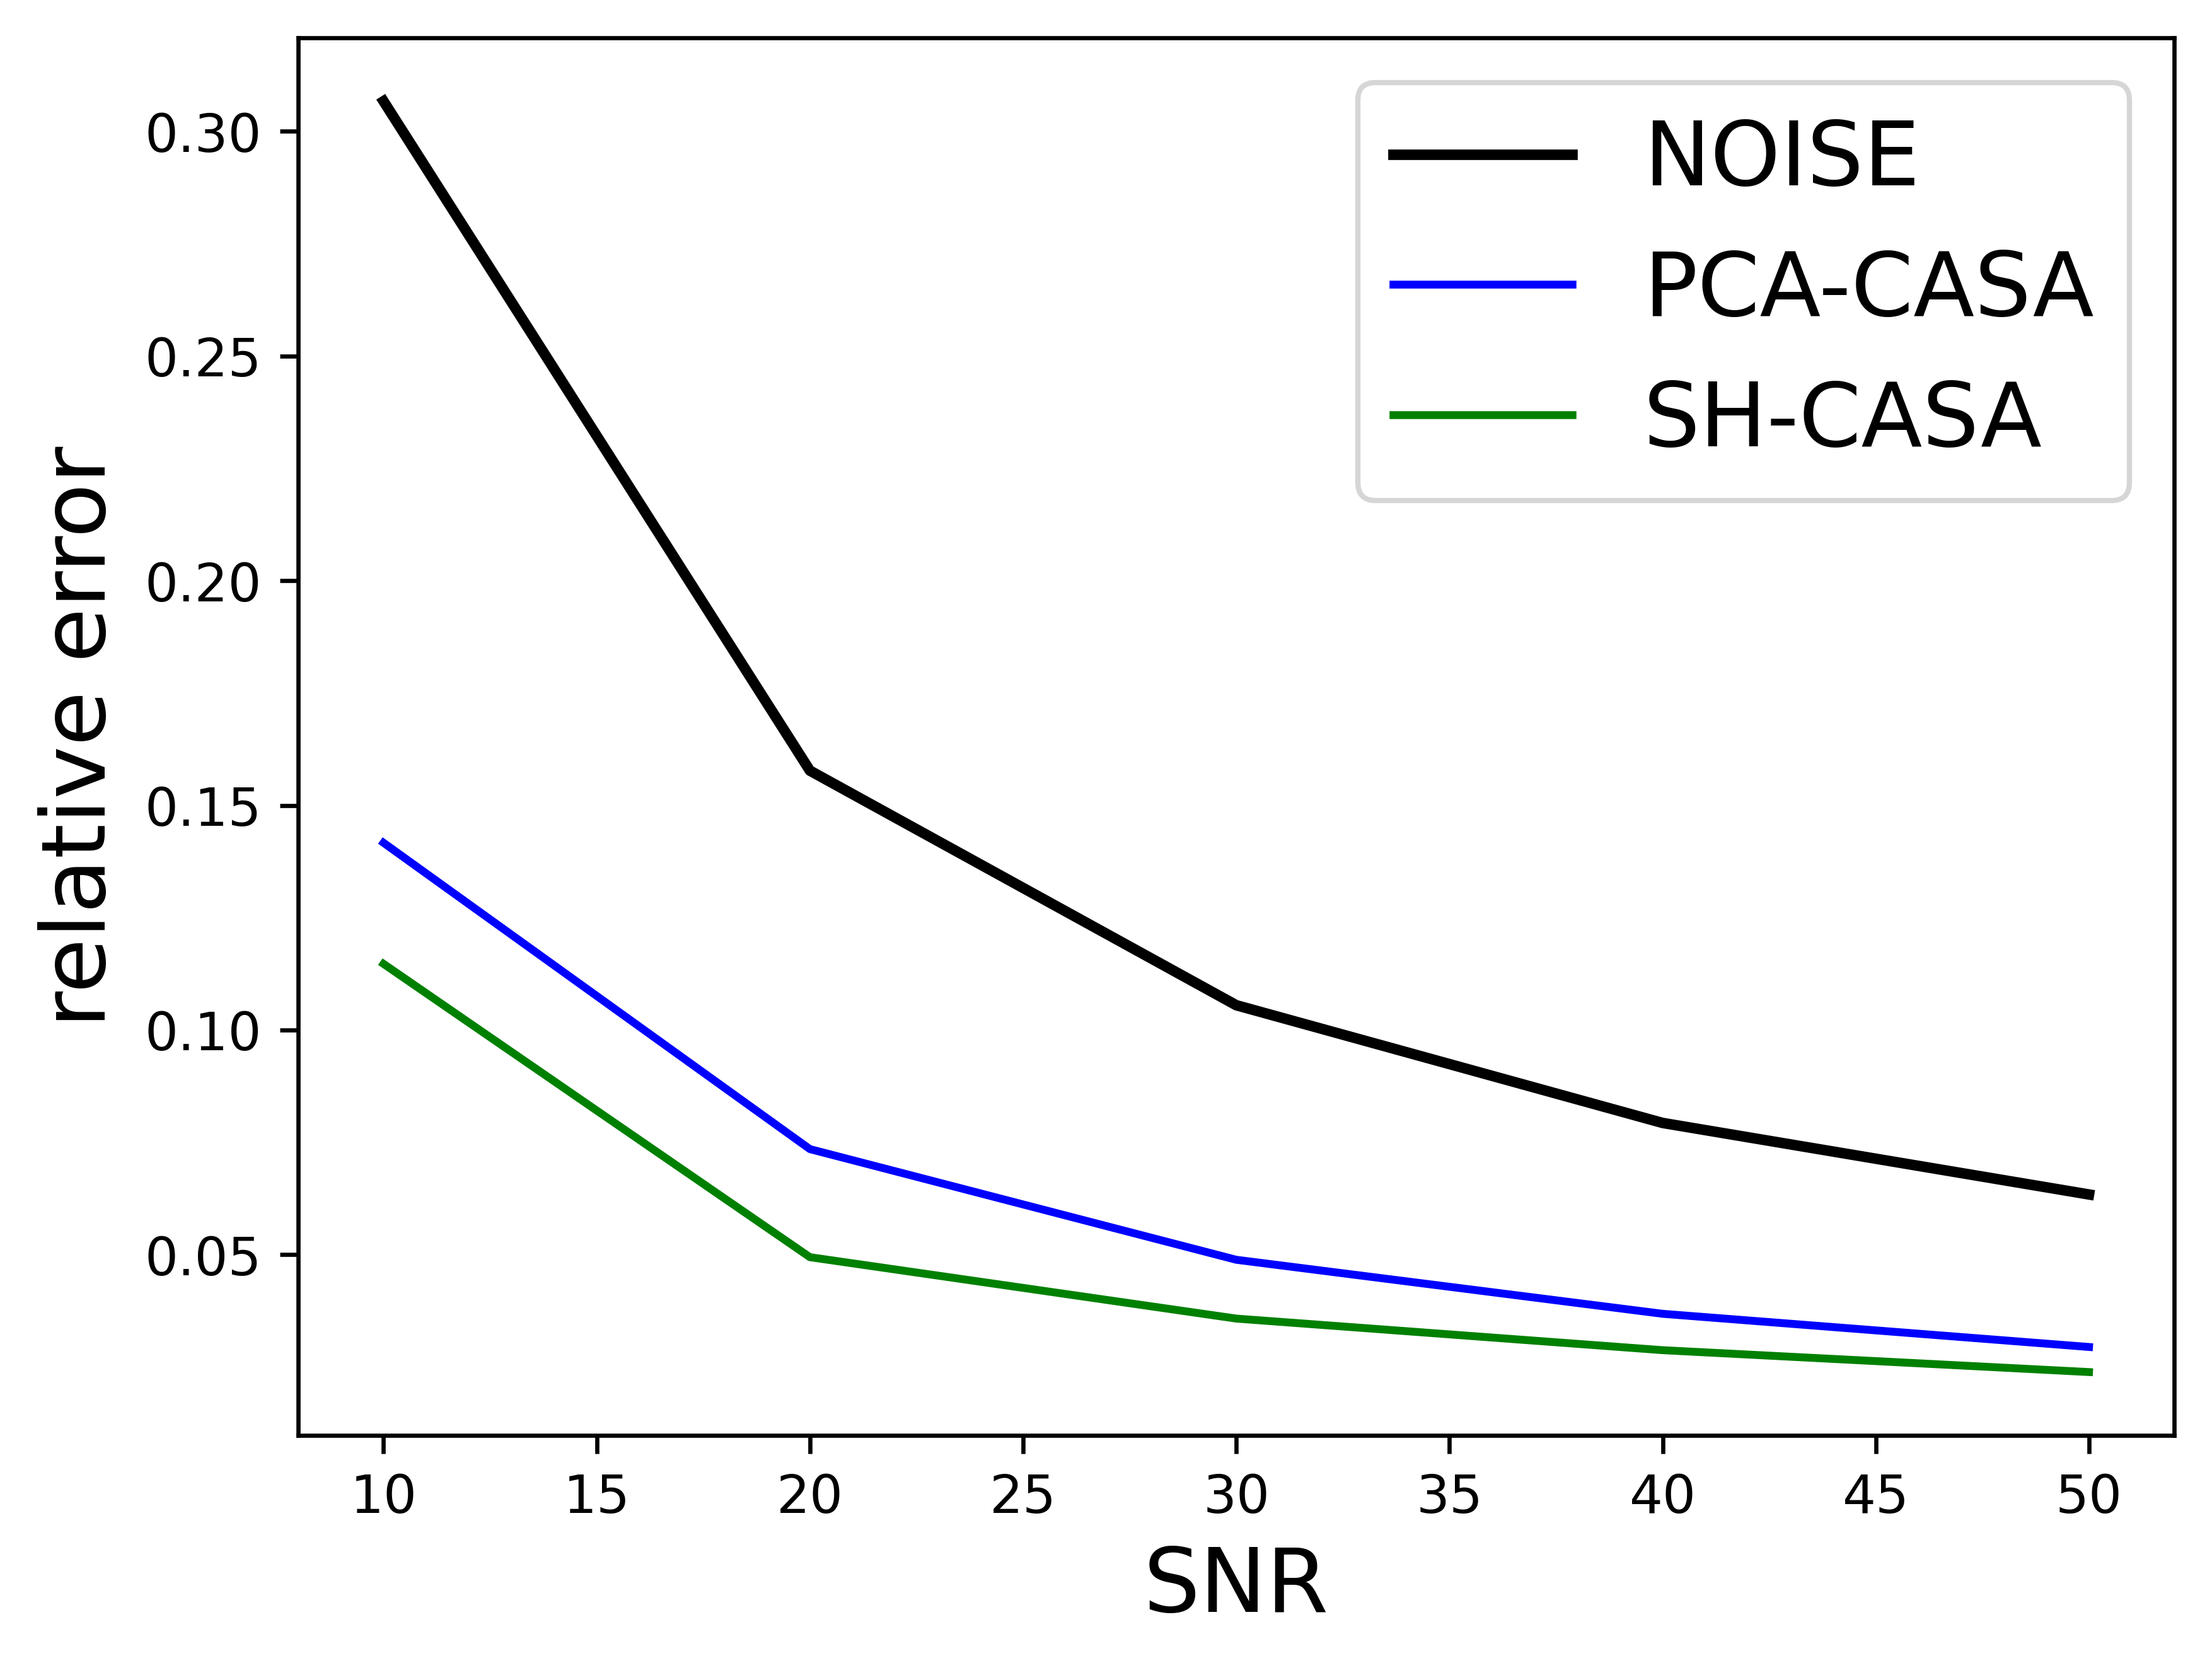
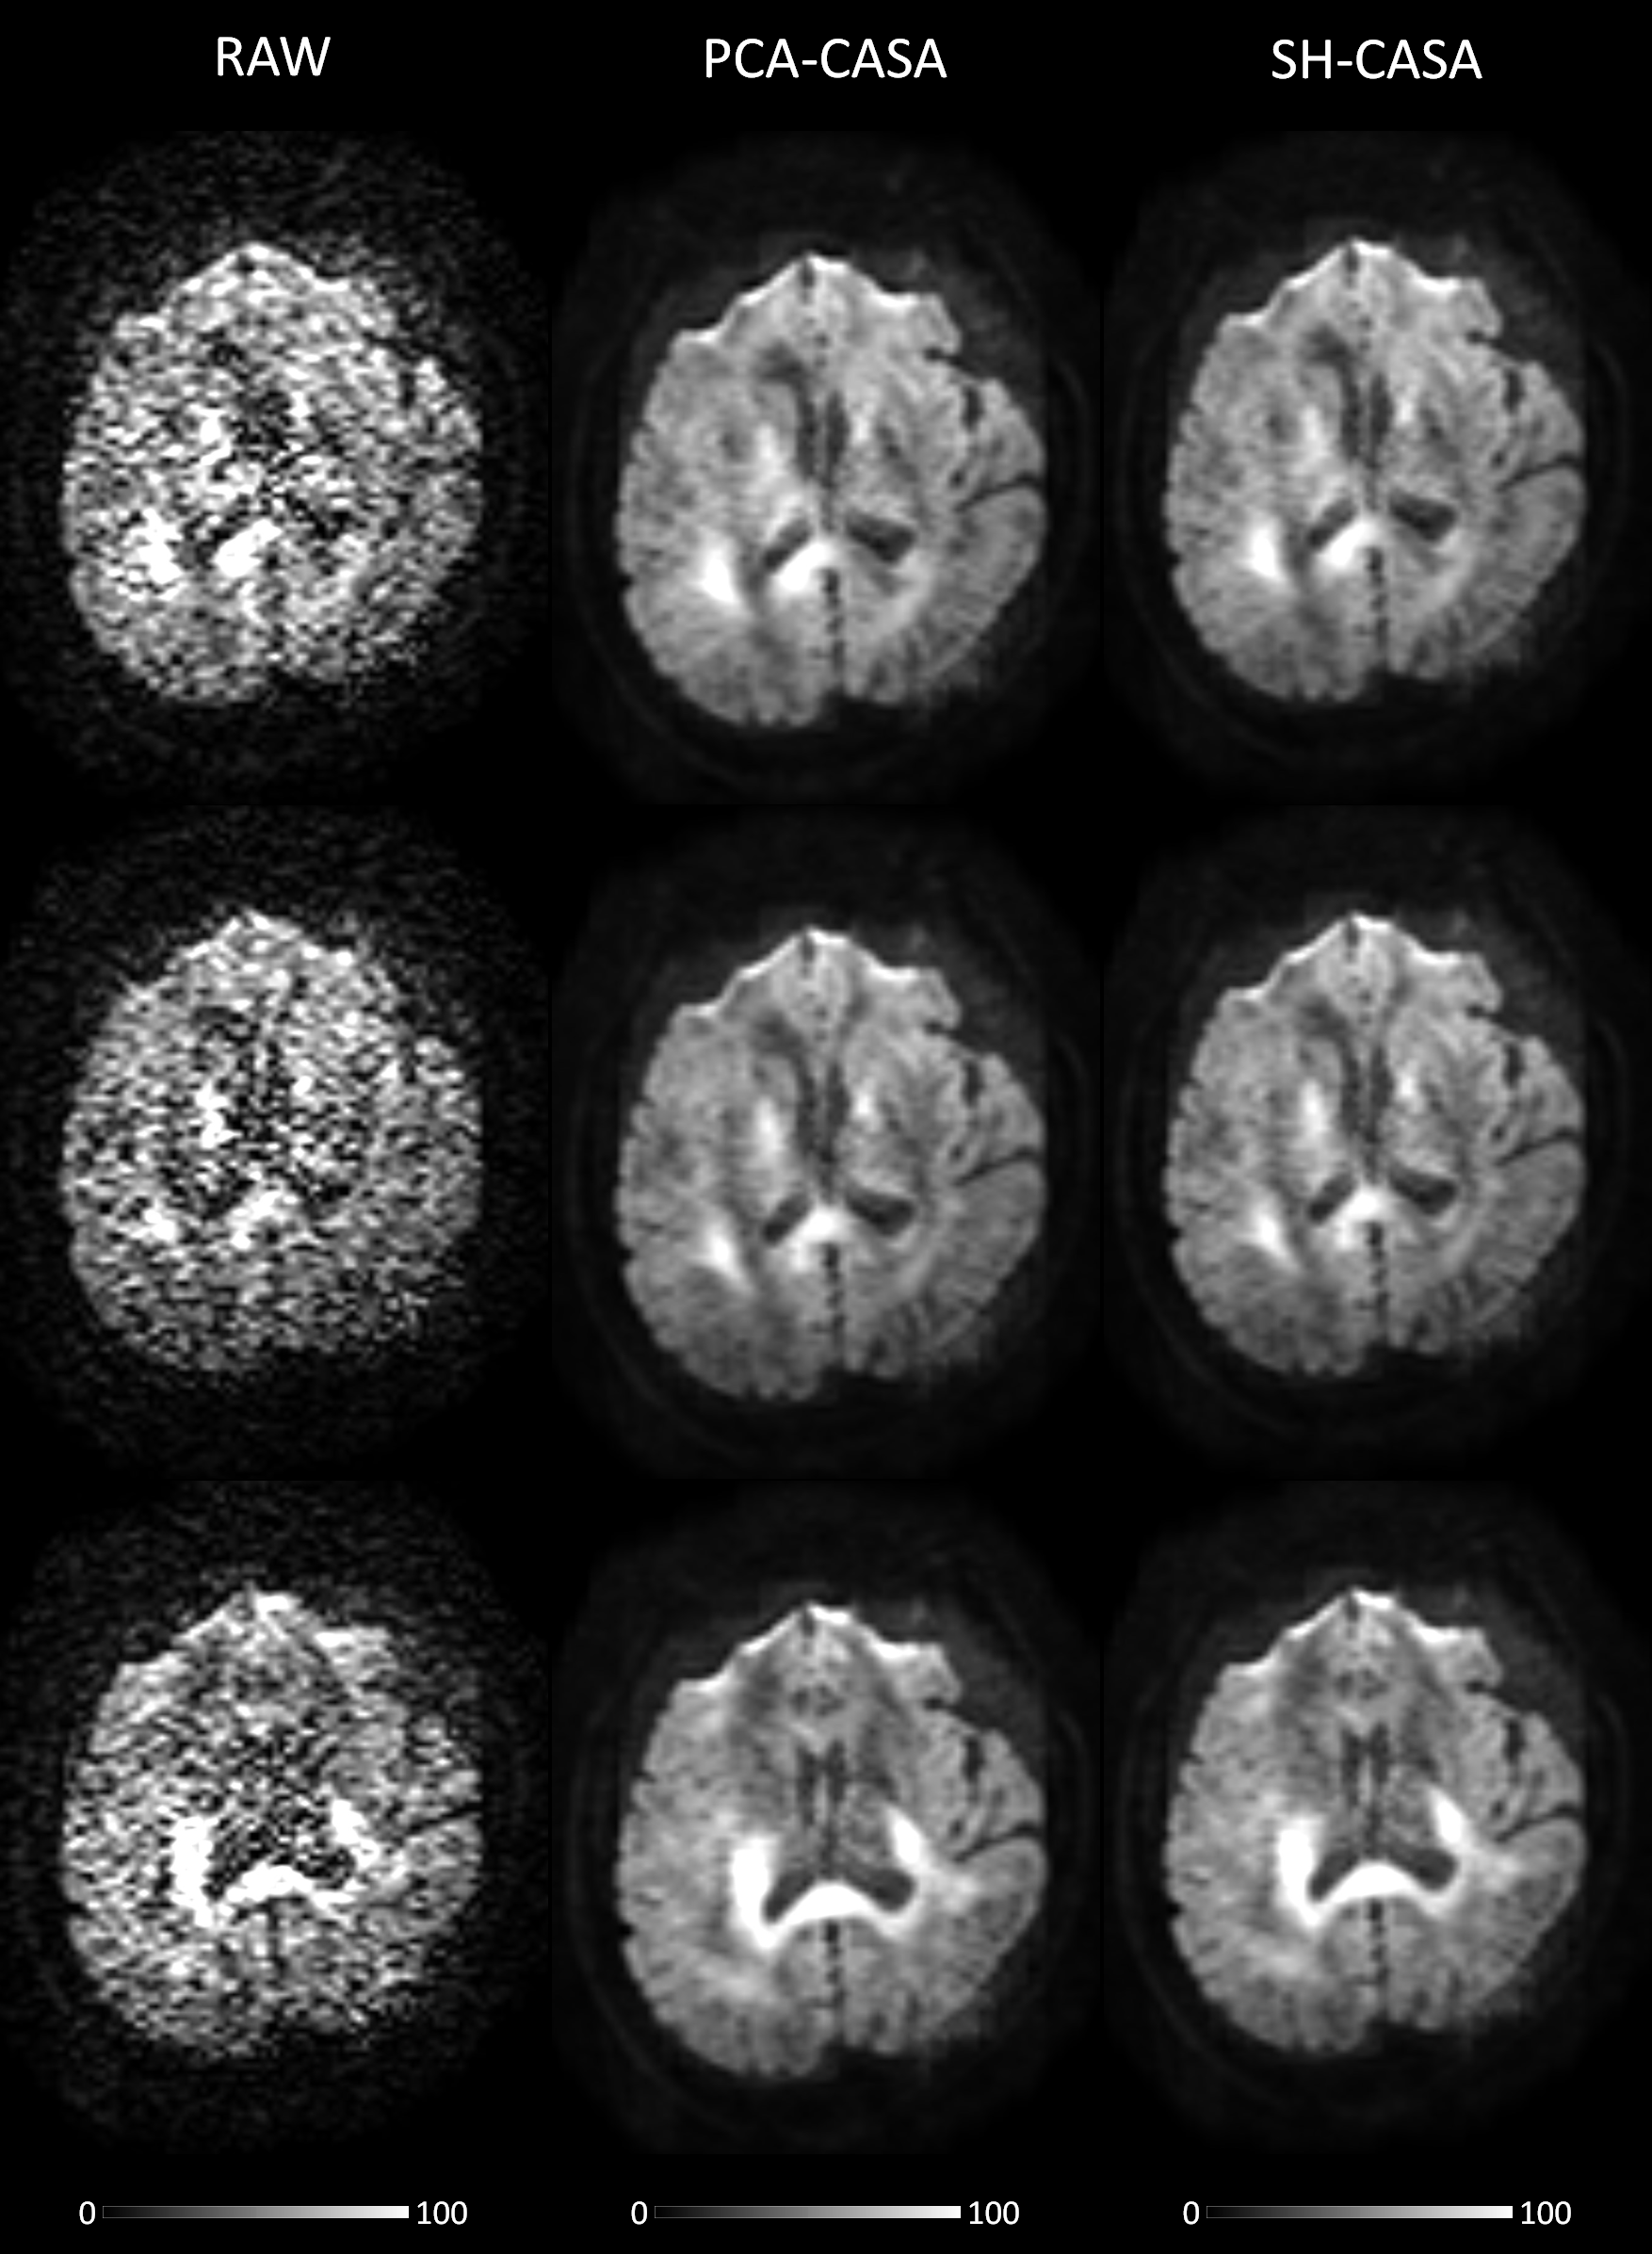
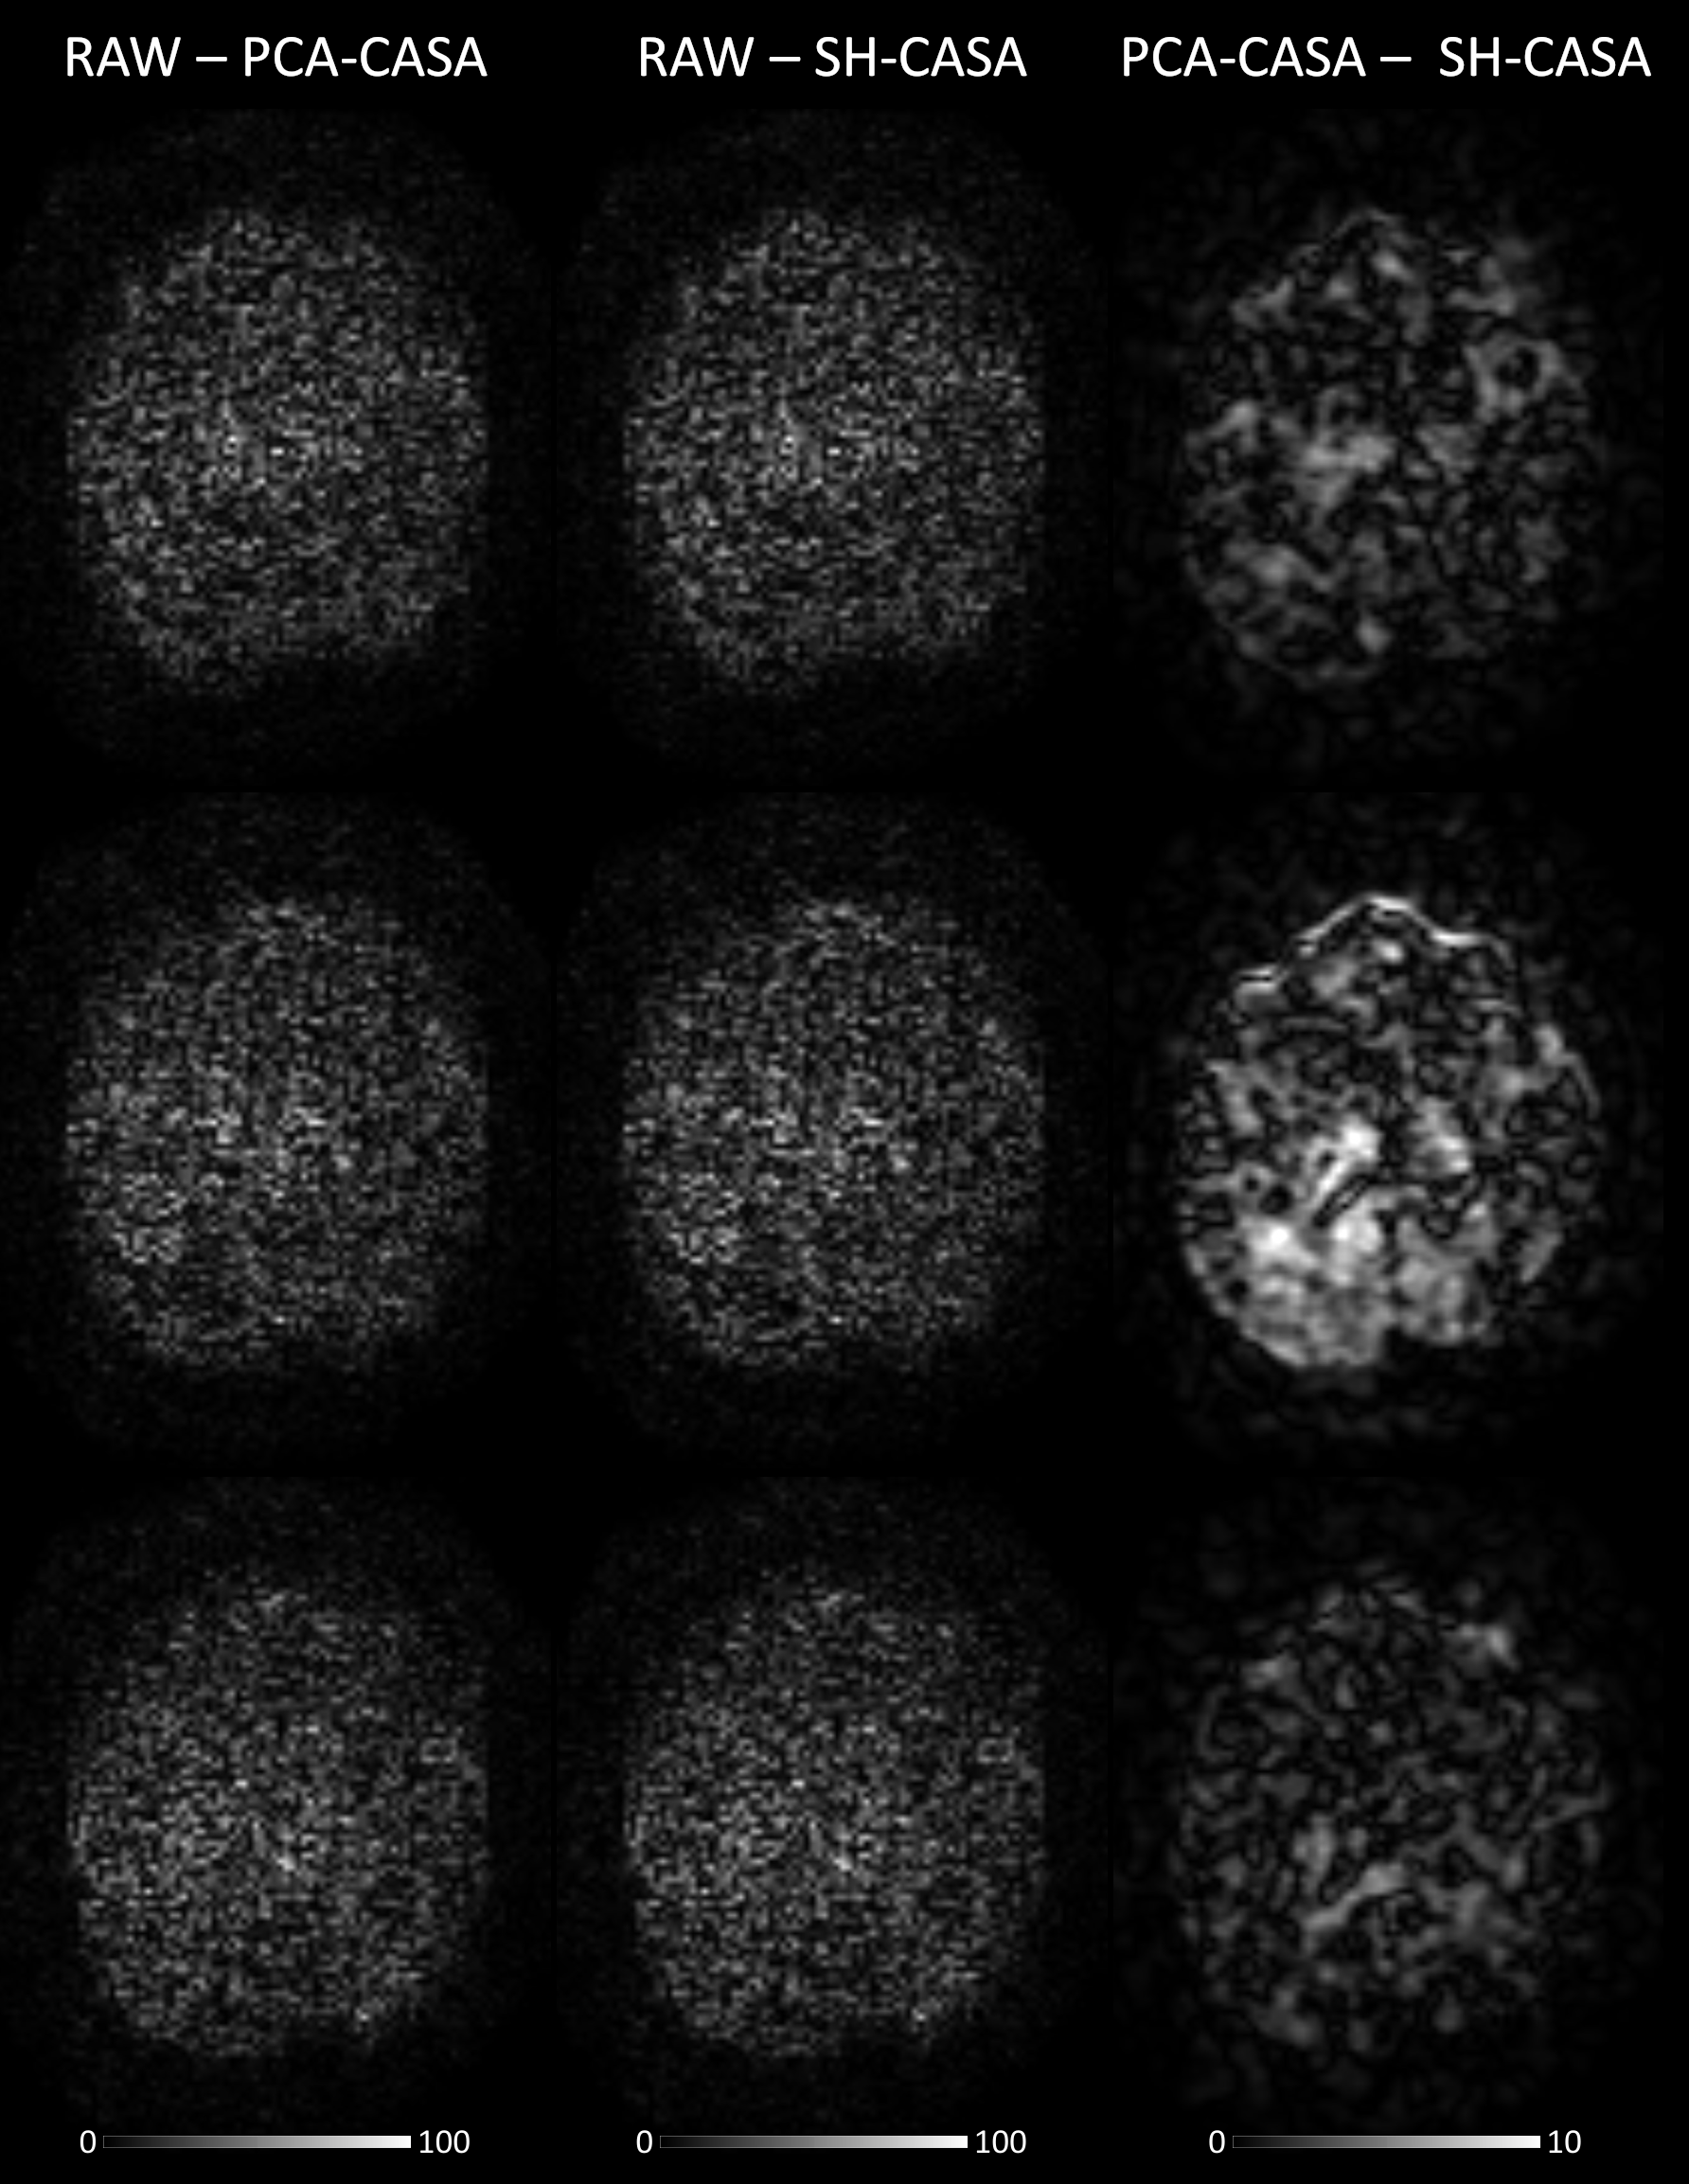
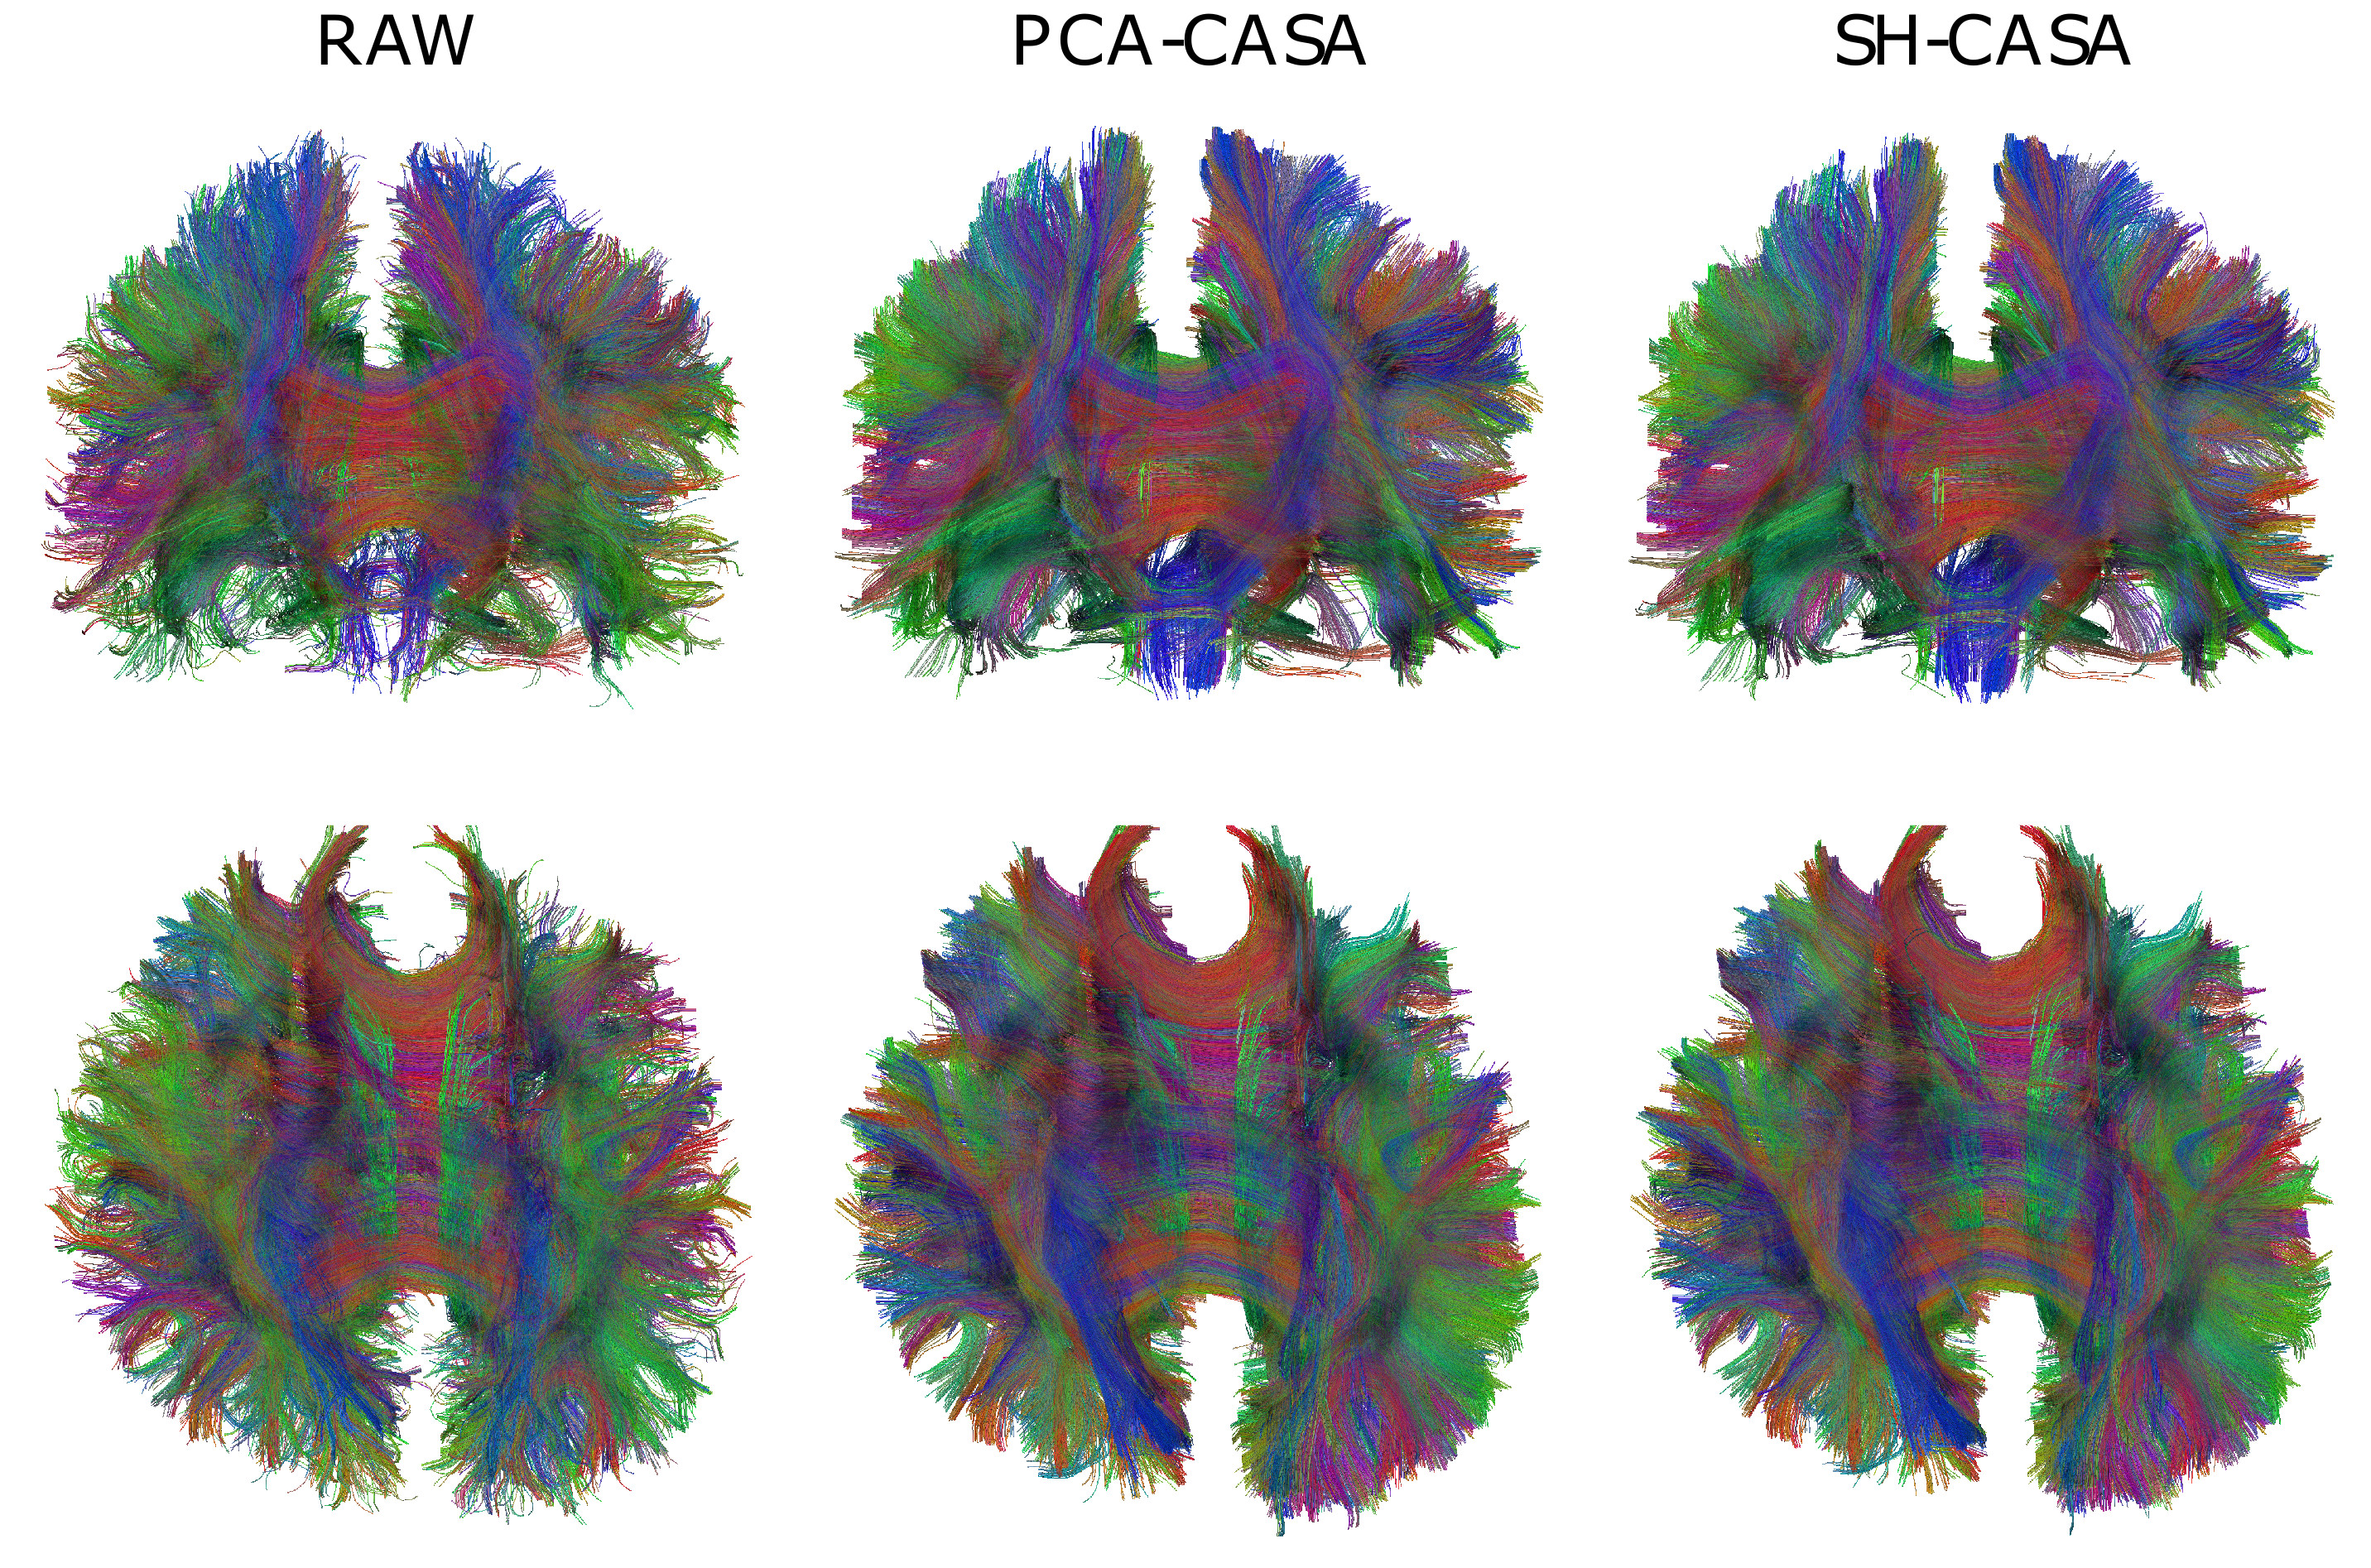
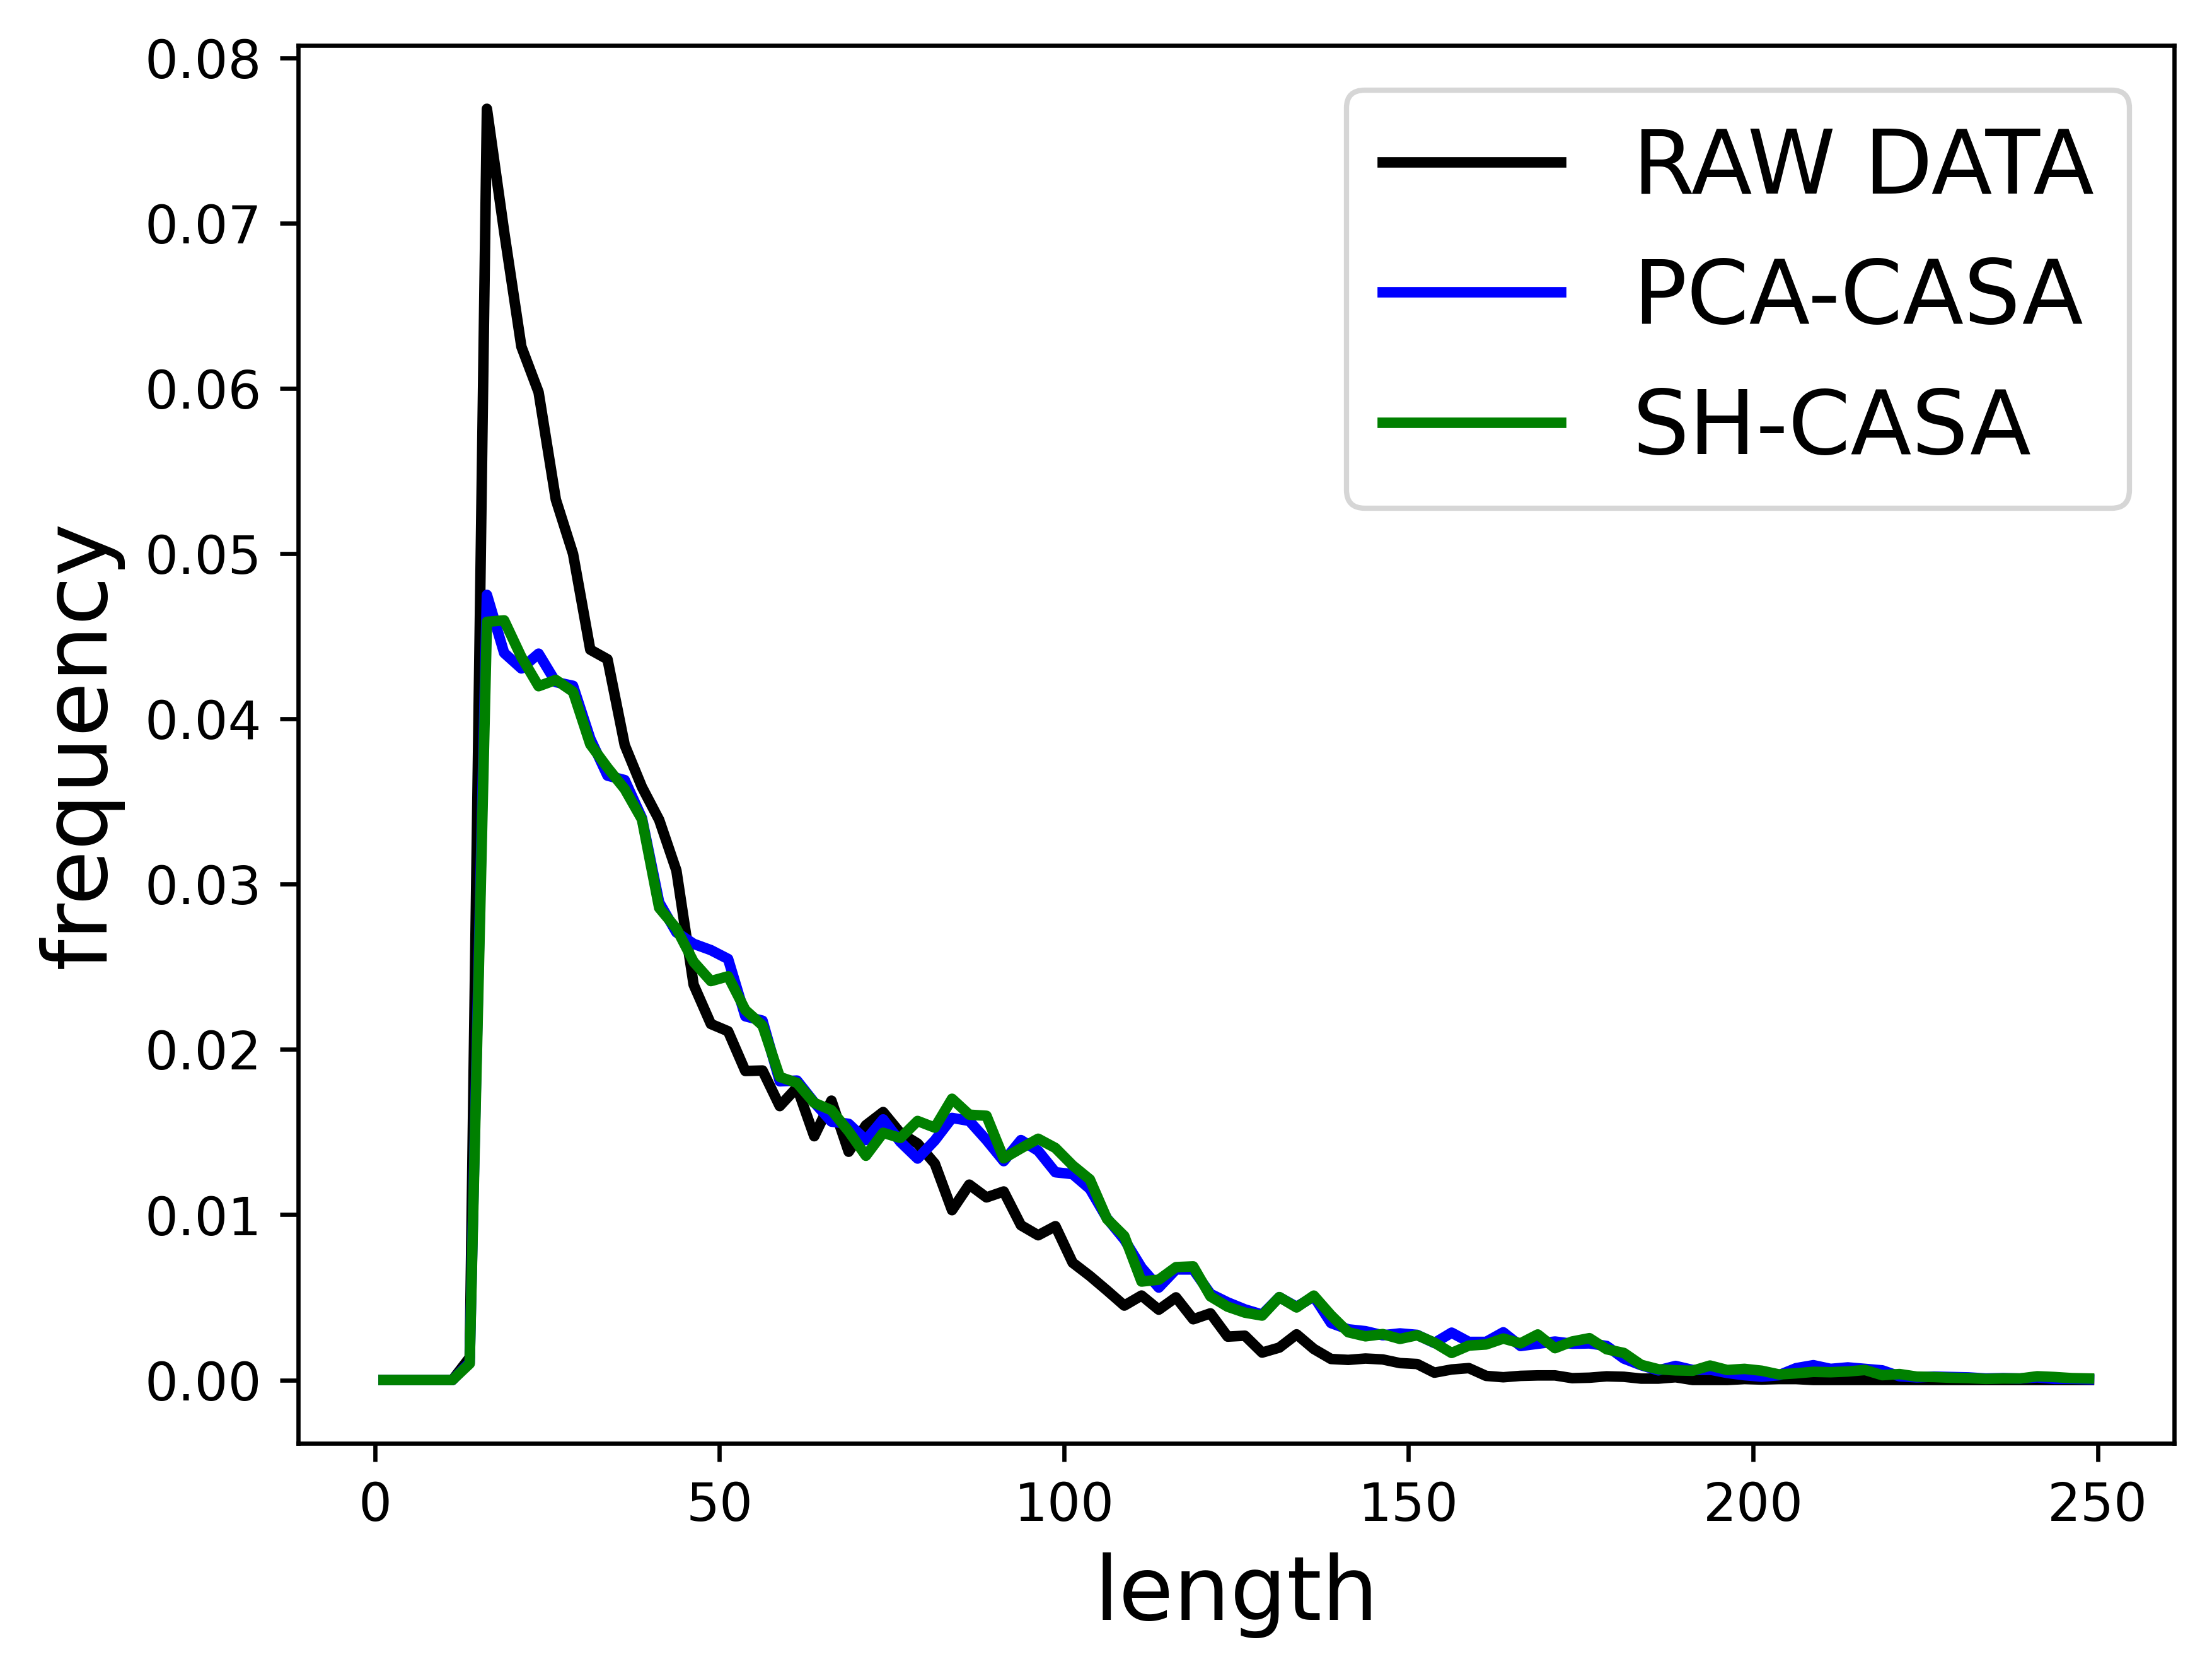
To quantify our method's performance, we utilized the ISMRM 2015 tractography phantom3,4,5, considering the artifact-free phantom as the Ground Truth (GT). We generated five images by adding Rician noise at SNR levels ranging from 10 to 50. Figure 1 illustrates the relative error, computed as the sum of the absolute value of the difference between the GT and the denoised data, divided by the GT. SH-CASA consistently demonstrates superior results across all SNR levels, while both techniques notably enhance dMRI data quality. In Figure 2, the application of PCA-CASA and SH-CASA denoising to in-vivo data showcases the effective improvement of the original dMRI data by both methods. Additionally, the absolute difference between denoised and non-denoised data, and the comparison between the two methods (depicted in Figure 3), indicate that both approaches effectively eliminate noise with minimal differences between them. Figure 4 displays the coronal and axial views of tractography for the raw in-vivo data and the two denoised datasets. Despite using the same number of seeds, the tractograms exhibit 36205, 44896, and 44802 streamlines for the raw data, PCA-CASA, and SH-CASA, respectively. The difference in streamline counts derived from the rejection of streamlines based on our tractography algorithms' criteria, involving minimal streamline length and turning angle. Both PCA-CASA and SH-CASA present largely similar results, demonstrating higher bundle coherence compared to the raw data. Figure 5 illustrates the length distribution of streamlines in the three cases. Our denoising methods result in a reduced number of short streamlines (below 50 mm) and an increased number of streamlines in the 50-200 mm range.DISCUSSION AND CONCLUSION
In this study, we presented an advancement of the CASA denoising algorithm for dMRI data by integrating SH decomposition. Our results with synthetic data reveal enhanced denoising compared to the original method. SH-CASA shows particular suitability in handling pure Rician noise. However, in in-vivo scenarios, both methods demonstrate similar qualitative improvements in dMRI data quality. This similarity may be attributed to various factors impacting the diffusion signal, such as motion and other artifacts, potentially blurring distinctions between the two methods. Notably, it's intriguing that disparate signal decompositions like PCA and SH yield closely aligned outcomes. Our future investigations will delve into understanding the relationship between the harmonics and principal components of the diffusion signal.Acknowledgements
No acknowledgement found.References
1. Casagranda S.; Papageorgakis C.; et al. Principal Component selections and filtering by spatial information criteria for multi-acquisition CEST MRI denoising. In Proceedings of the 31st Annual Meeting of the ISMRM 2022. Abstract 2080.
2. Zucchelli,M. Et al Component Analysis based on Standard-deviation Attenuation(CASA): a new algorithm for the denoising of Diffusion MRI data. In Proceedings of the 32st Annual Meeting of the ISMRM 2023. Abstract 1136.
3. Côté, M.-A., Girard, G., Boré, A., Garyfallidis, E., Houde, J.-C. and Descoteaux, M. (2013). Tractometer: Towards Validation of Tractography Pipelines, Medical Image Analysis, 17(7), 844-857.
4. Renauld, E., Théberge, A., Houde, J.-C., Descoteaux, M., Validate your white matter tractography algorithms with a reappraised ISMRM 2015 Tractography Challenge scoring system, Scientific Reports, 13:2347 (2023).
5 . Renauld, E., Théberge, A., Houde, J.-C., Descoteaux, M., Update of the ISMRM 2015 Tractography Challenge: curated data and enhanced Tractometer scoring system, ISMRM Workshop on Diffusion MRI: From Research to Clinic, October 2022.
Figures