2165
Deep Learning-Driven Enhancement of Fibre Orientation Distribution: Effect of Choice of Gradient Direction Number1School of Computer Science, The University of Sydney, Sydney, Australia, 2Brain and Mind Centre, The University of Sydney, Sydney, Australia, 3Sydney Neuroimaging Analysis Centre, The University of Sydney, Sydney, Australia, 4School of Biomedical Engineering, The University of Sydney, Sydney, Australia, 5Sydney Imaging, The University of Sydney, Sydney, Australia
Synopsis
Keywords: Diffusion Analysis & Visualization, Tractography & Fibre Modelling, Fiber Orientation Distribution, Brain Connectivity, Enhancement
Motivation: Learning-based methods effectively enhance fibre orientation distributions (FODs) derived from limited single-shell acquisitions. However, the enhancement capacity with different number of gradient directions is not fully characterised.
Goal(s): This study aims to explore the impact of initial gradient directions on FOD enhancement capacity of clinically accessible single-shell diffusion data.
Approach: We employ a FOD enhancement framework on single-shell (b=1000) data with different numbers of gradient directions. The enhanced FODs and derivatives are evaluated through FOD-based, fixel-based and connectome analysis metrics.
Results: The optimal trade-off between the learning-based FOD enhancement outcome and the choice of number of gradient directions is at around 24 directions.
Impact: This work provides guidelines for the optimal design of dMRI acquisition protocols meeting the expectations of clinical research on FOD enhancement according to the capability of learning-based frameworks, ensuring high-quality tractography and connectomes without the need for multi-shell HARDI protocols.
Introduction
Diffusion magnetic resonance imaging (dMRI) is a non-invasive technique for brain structural connectivity analysis1,2, most commonly based on the information from fibre orientation distributions (FODs). While constrained spherical deconvolution (CSD)3-5 of multi-shell high angular resolution diffusion imaging (HARDI) data provides high quality FODs and subsequent tractography6, scanner capacity limitations or time constraints in clinical studies often lead to the acquisition of single-shell, low angular resolution diffusion imaging (LARDI), which can result in inaccuracies in reconstructing complex white matter fibre representations7. Learning-based methods8,9 have shown promising results in FOD enhancement comparable to multi-shell HARDI acquisitions from limited single-shell LARDI. However, the impact from the number of gradient directions on such enhancement frameworks is not fully characterised. This study aims to fill this gap and provide guidance for dMRI study protocol design when combined with FOD enhancement. We employ an end-to-end FOD enhancement framework9 on the public Human Connectome Project (HCP) dataset10, sampling different evenly distributed gradient directions as input, and evaluate the enhancement outcome with different FOD-based, fixel-based, and connectome analysis metrics.Methods
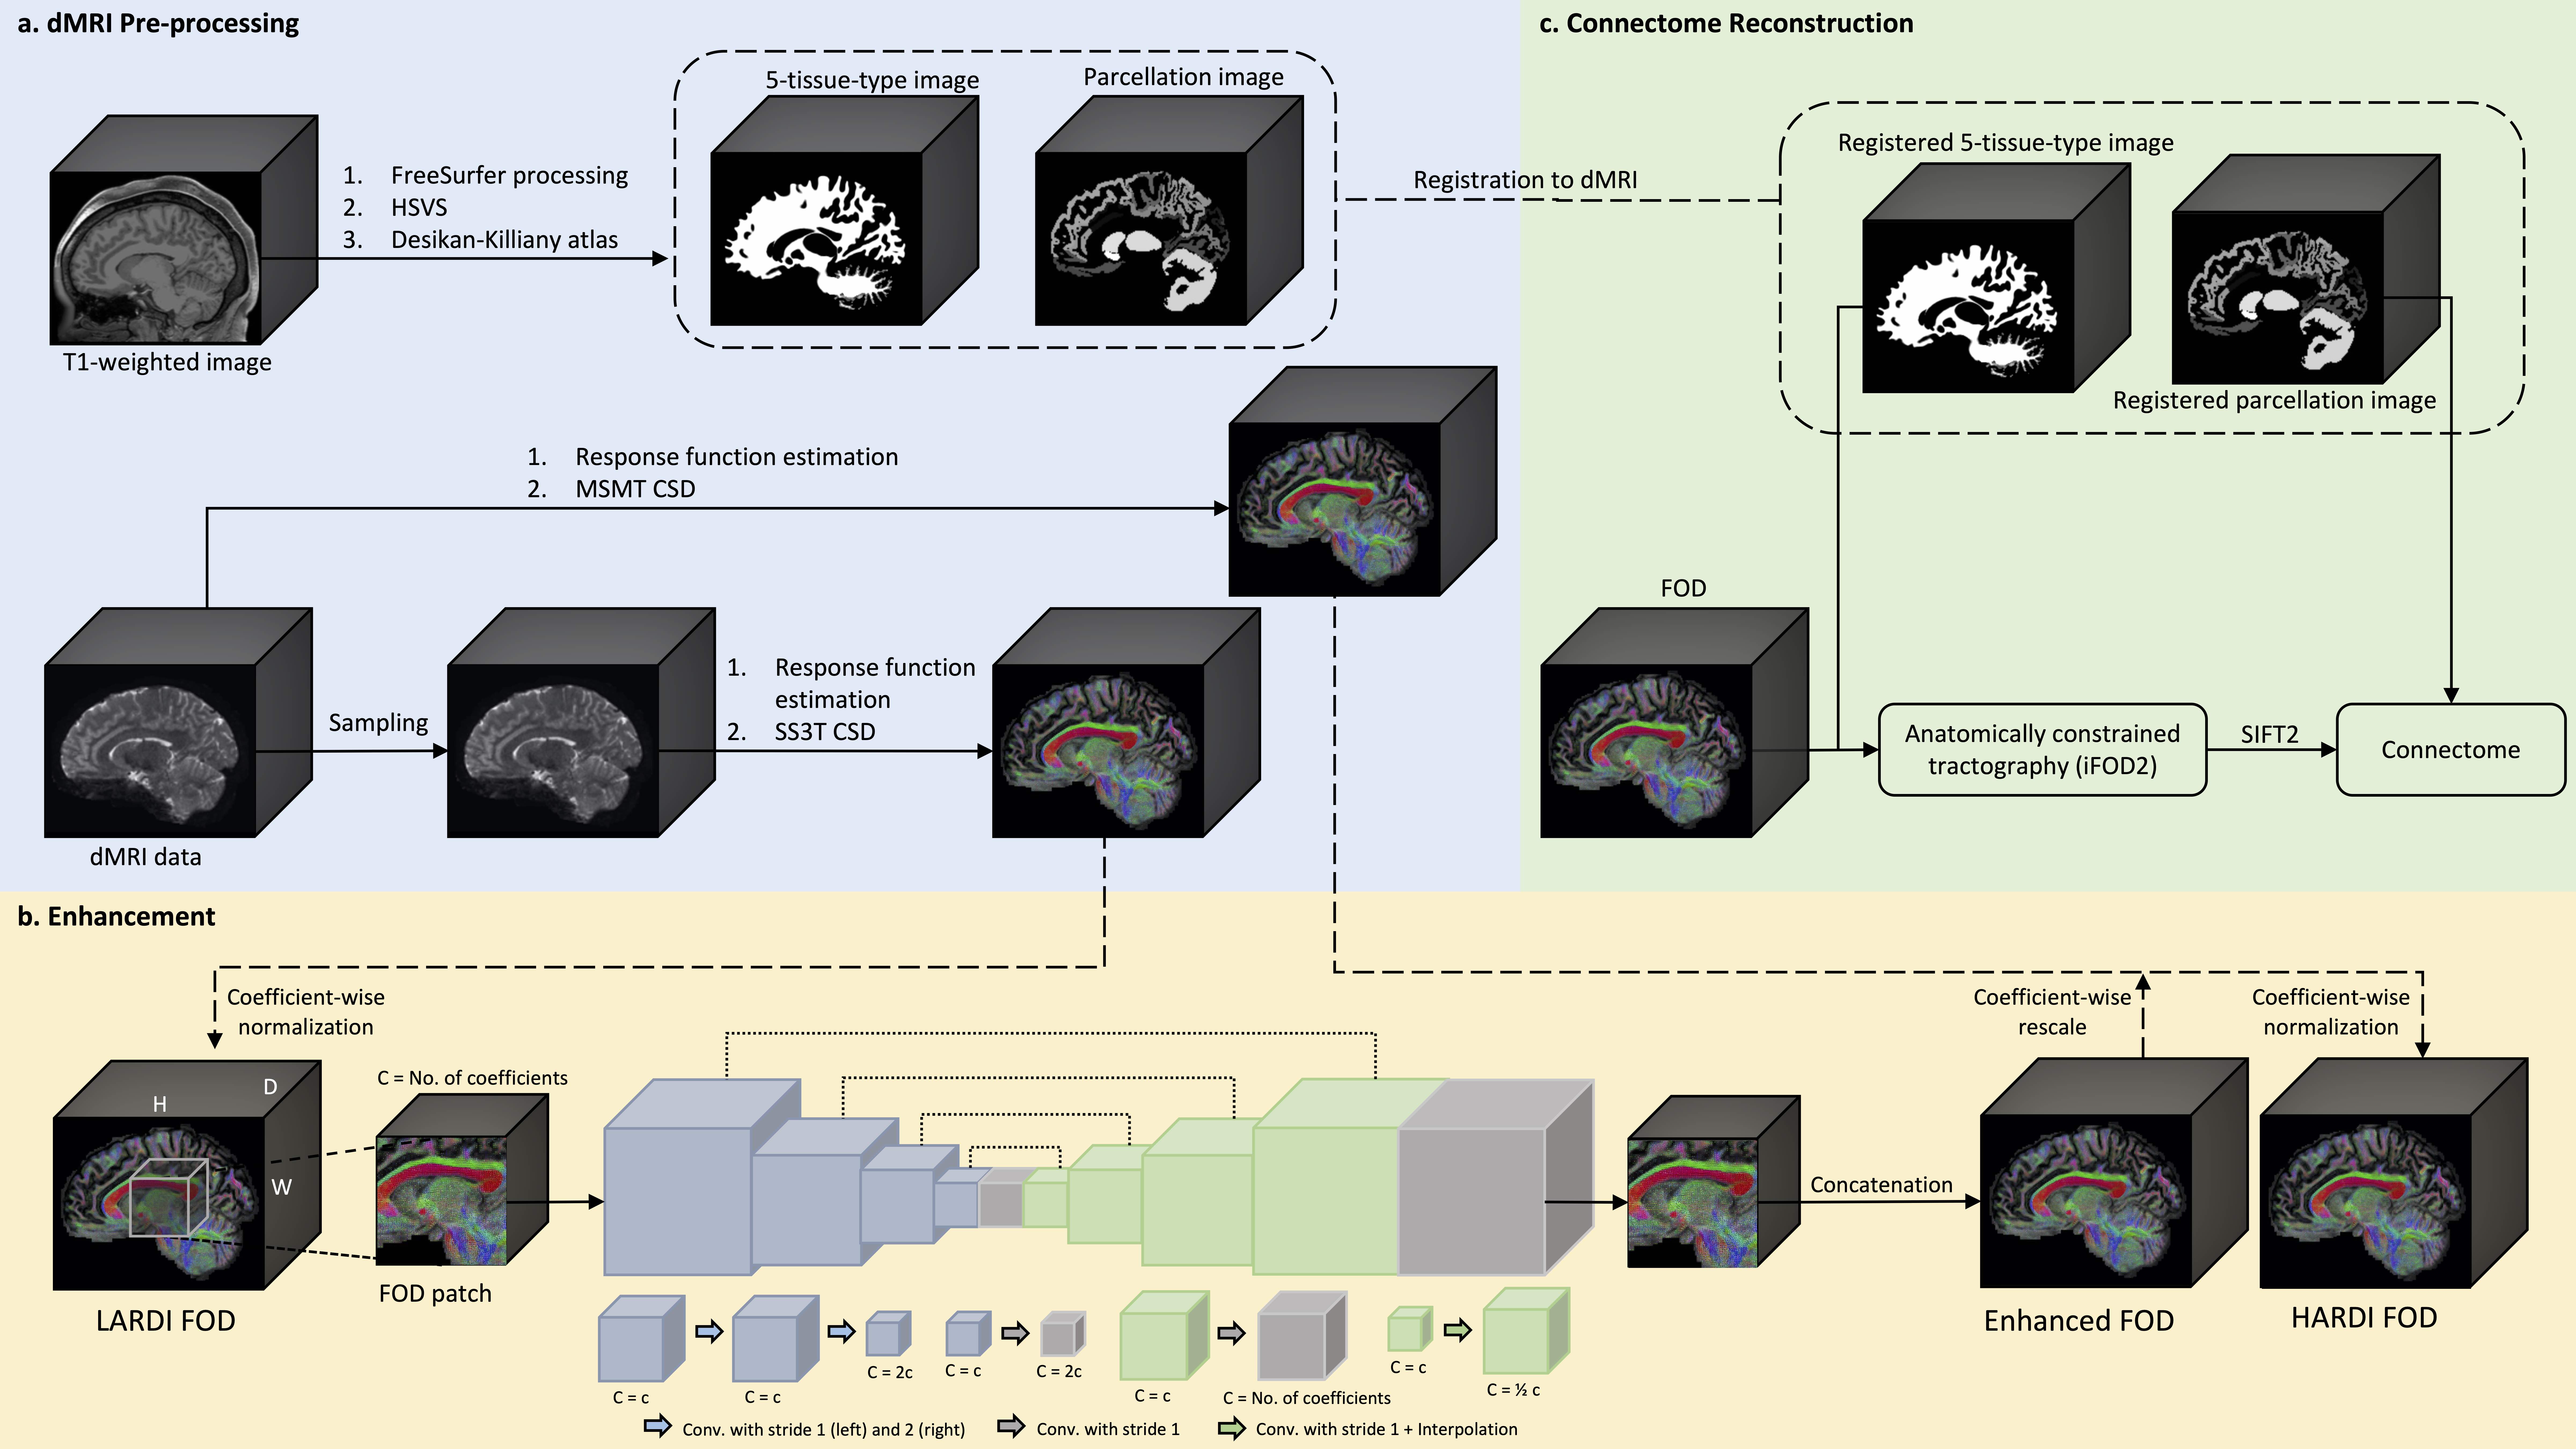
A total of 100 subjects were selected from the HCP dataset, split into 80 cases for training and 20 for testing. Different numbers of gradient directions from 6 to 48 were sampled from the b1000 acquisitions using the Kennard-Stone algorithm8,9. The mean b0 volume was added to the sampled volumes to simulate a single-shell LARDI acquisition. Figure 1a and 1c provide an overview of the preprocessing and connectome generation pipeline using Mrtrix311. FODs were computed using both single-shell three-tissue (SS3T)12 and multi-shell multi-tissue (MSMT)3 CSD routines, resulting in 45 spherical harmonic coefficients, regardless of the number of gradient directions. Input patches were cropped using a sliding window and were normalised by coefficient-wise z-score of the whole subject. We then applied an end-to-end learning-based framework (FOD-Net 2.0) (Figure 1b) to enhance the entire FOD patch9.Results
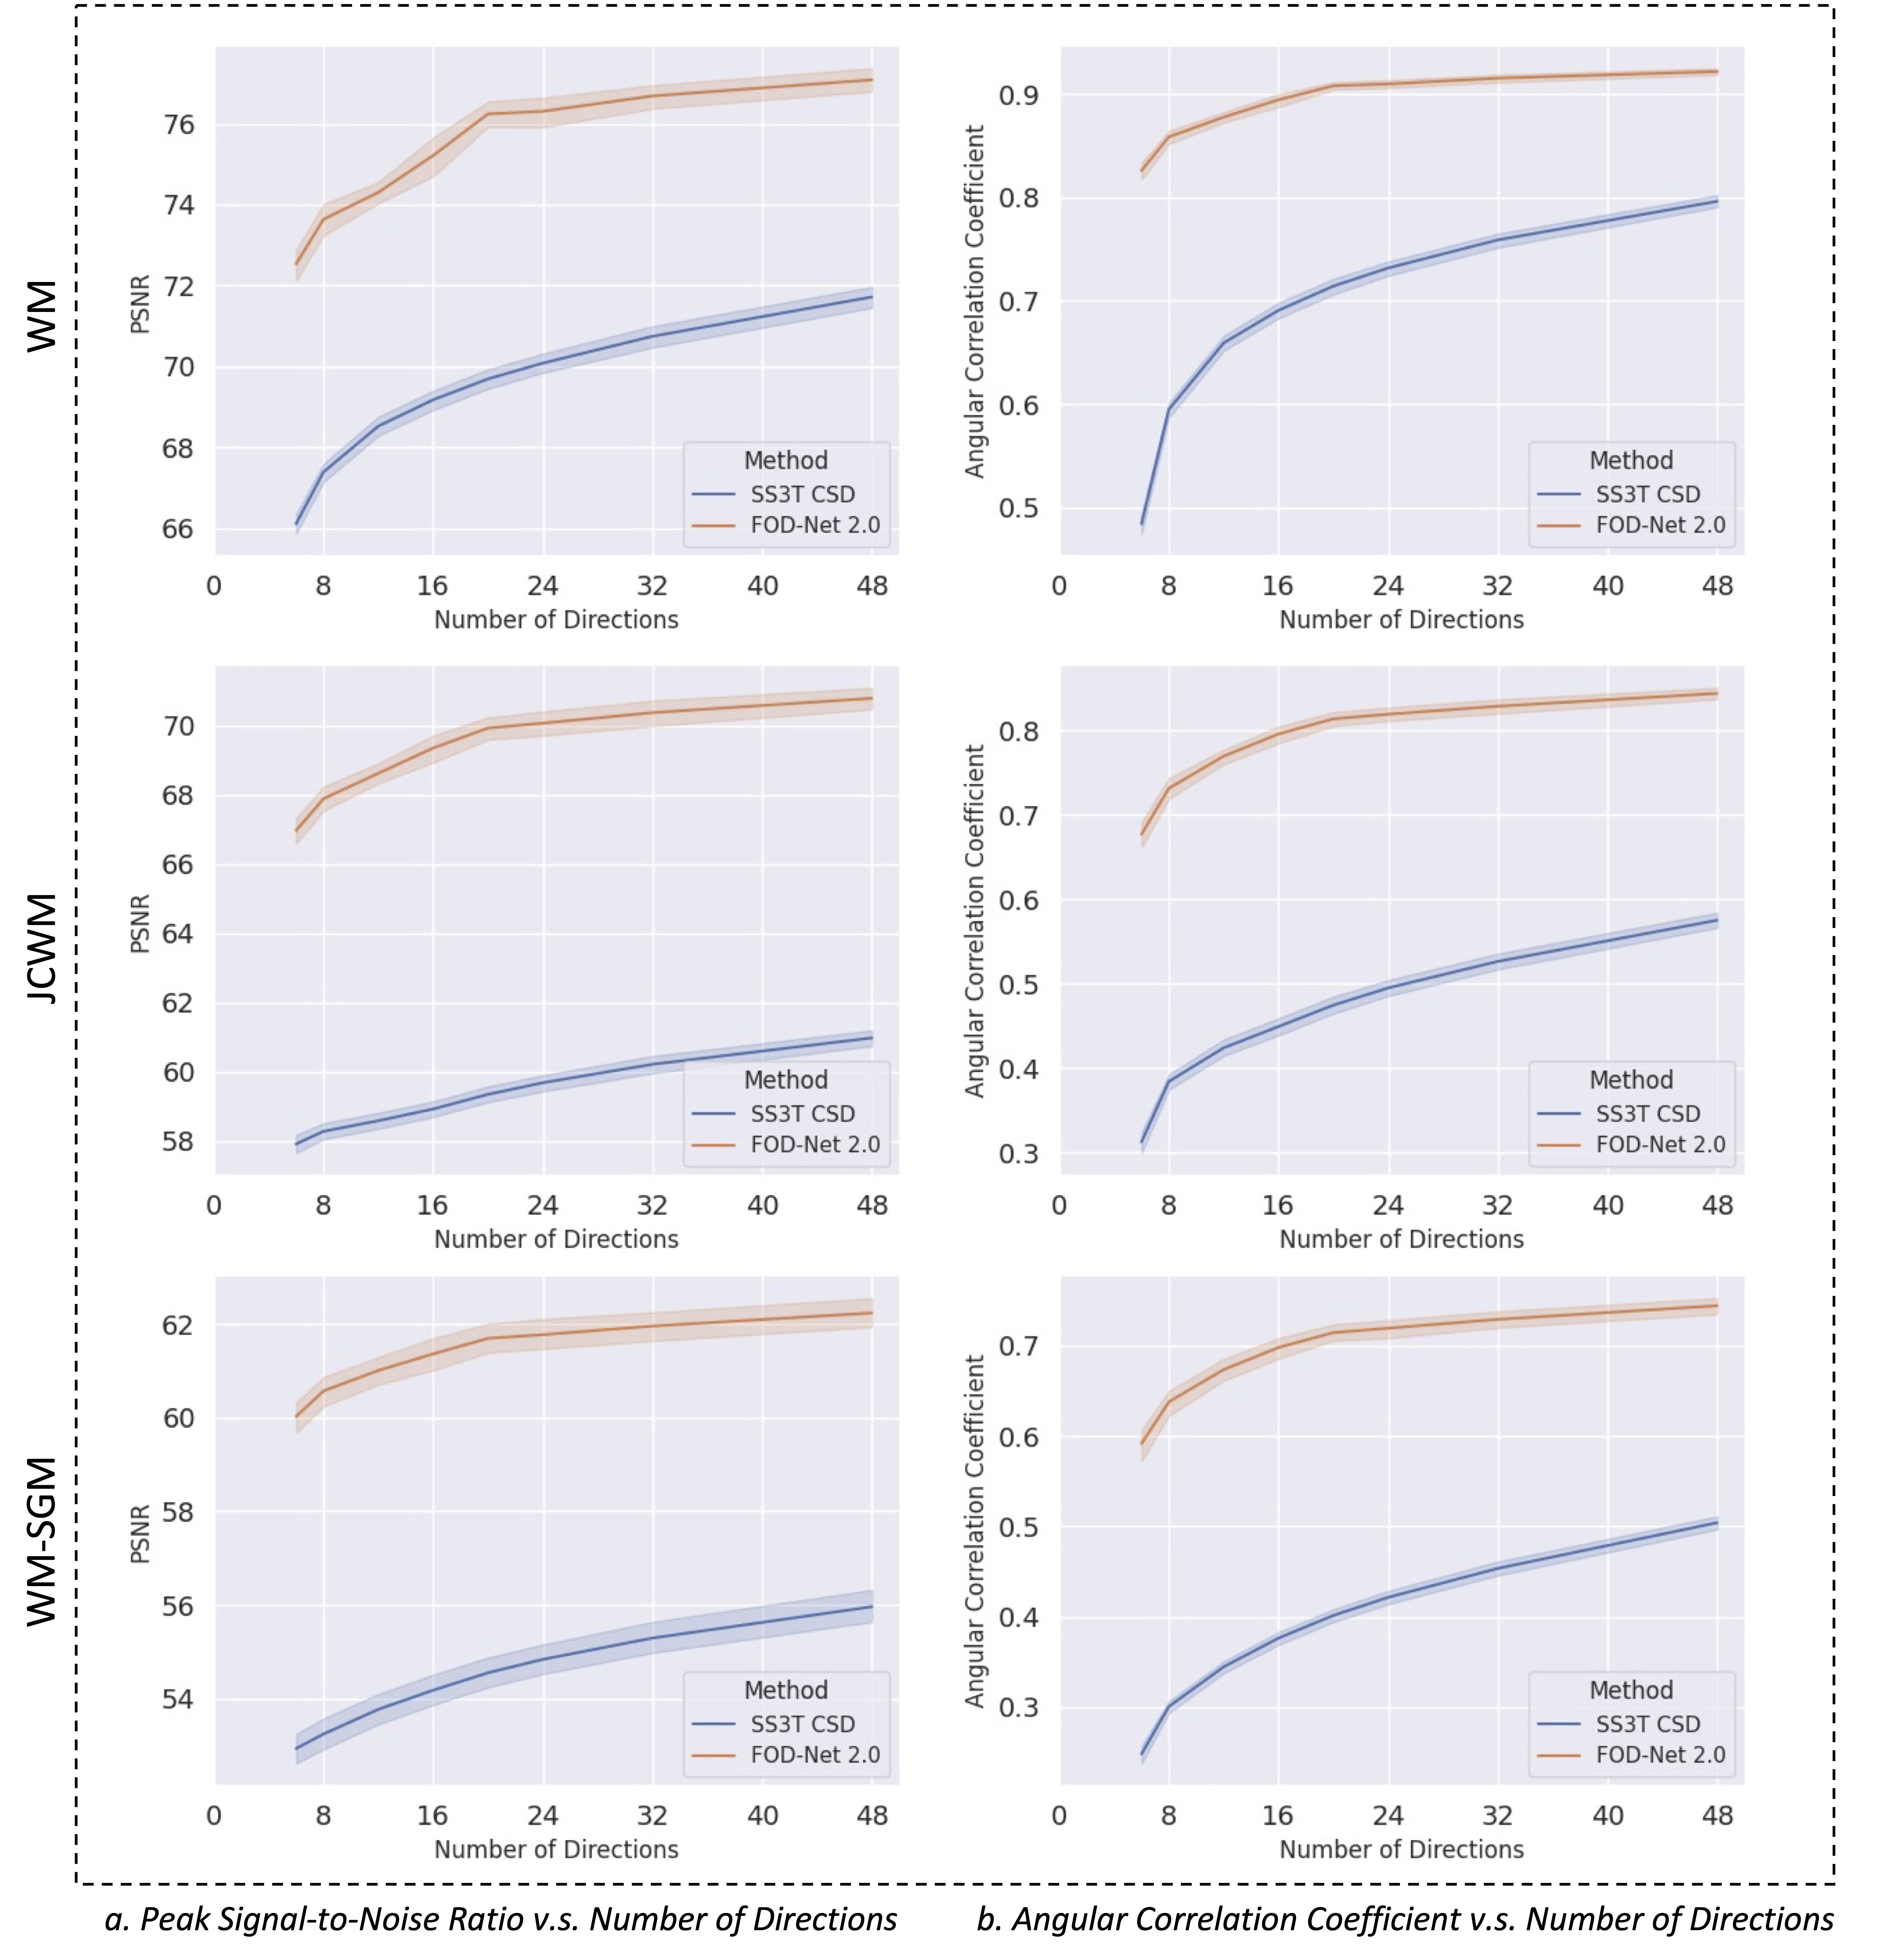
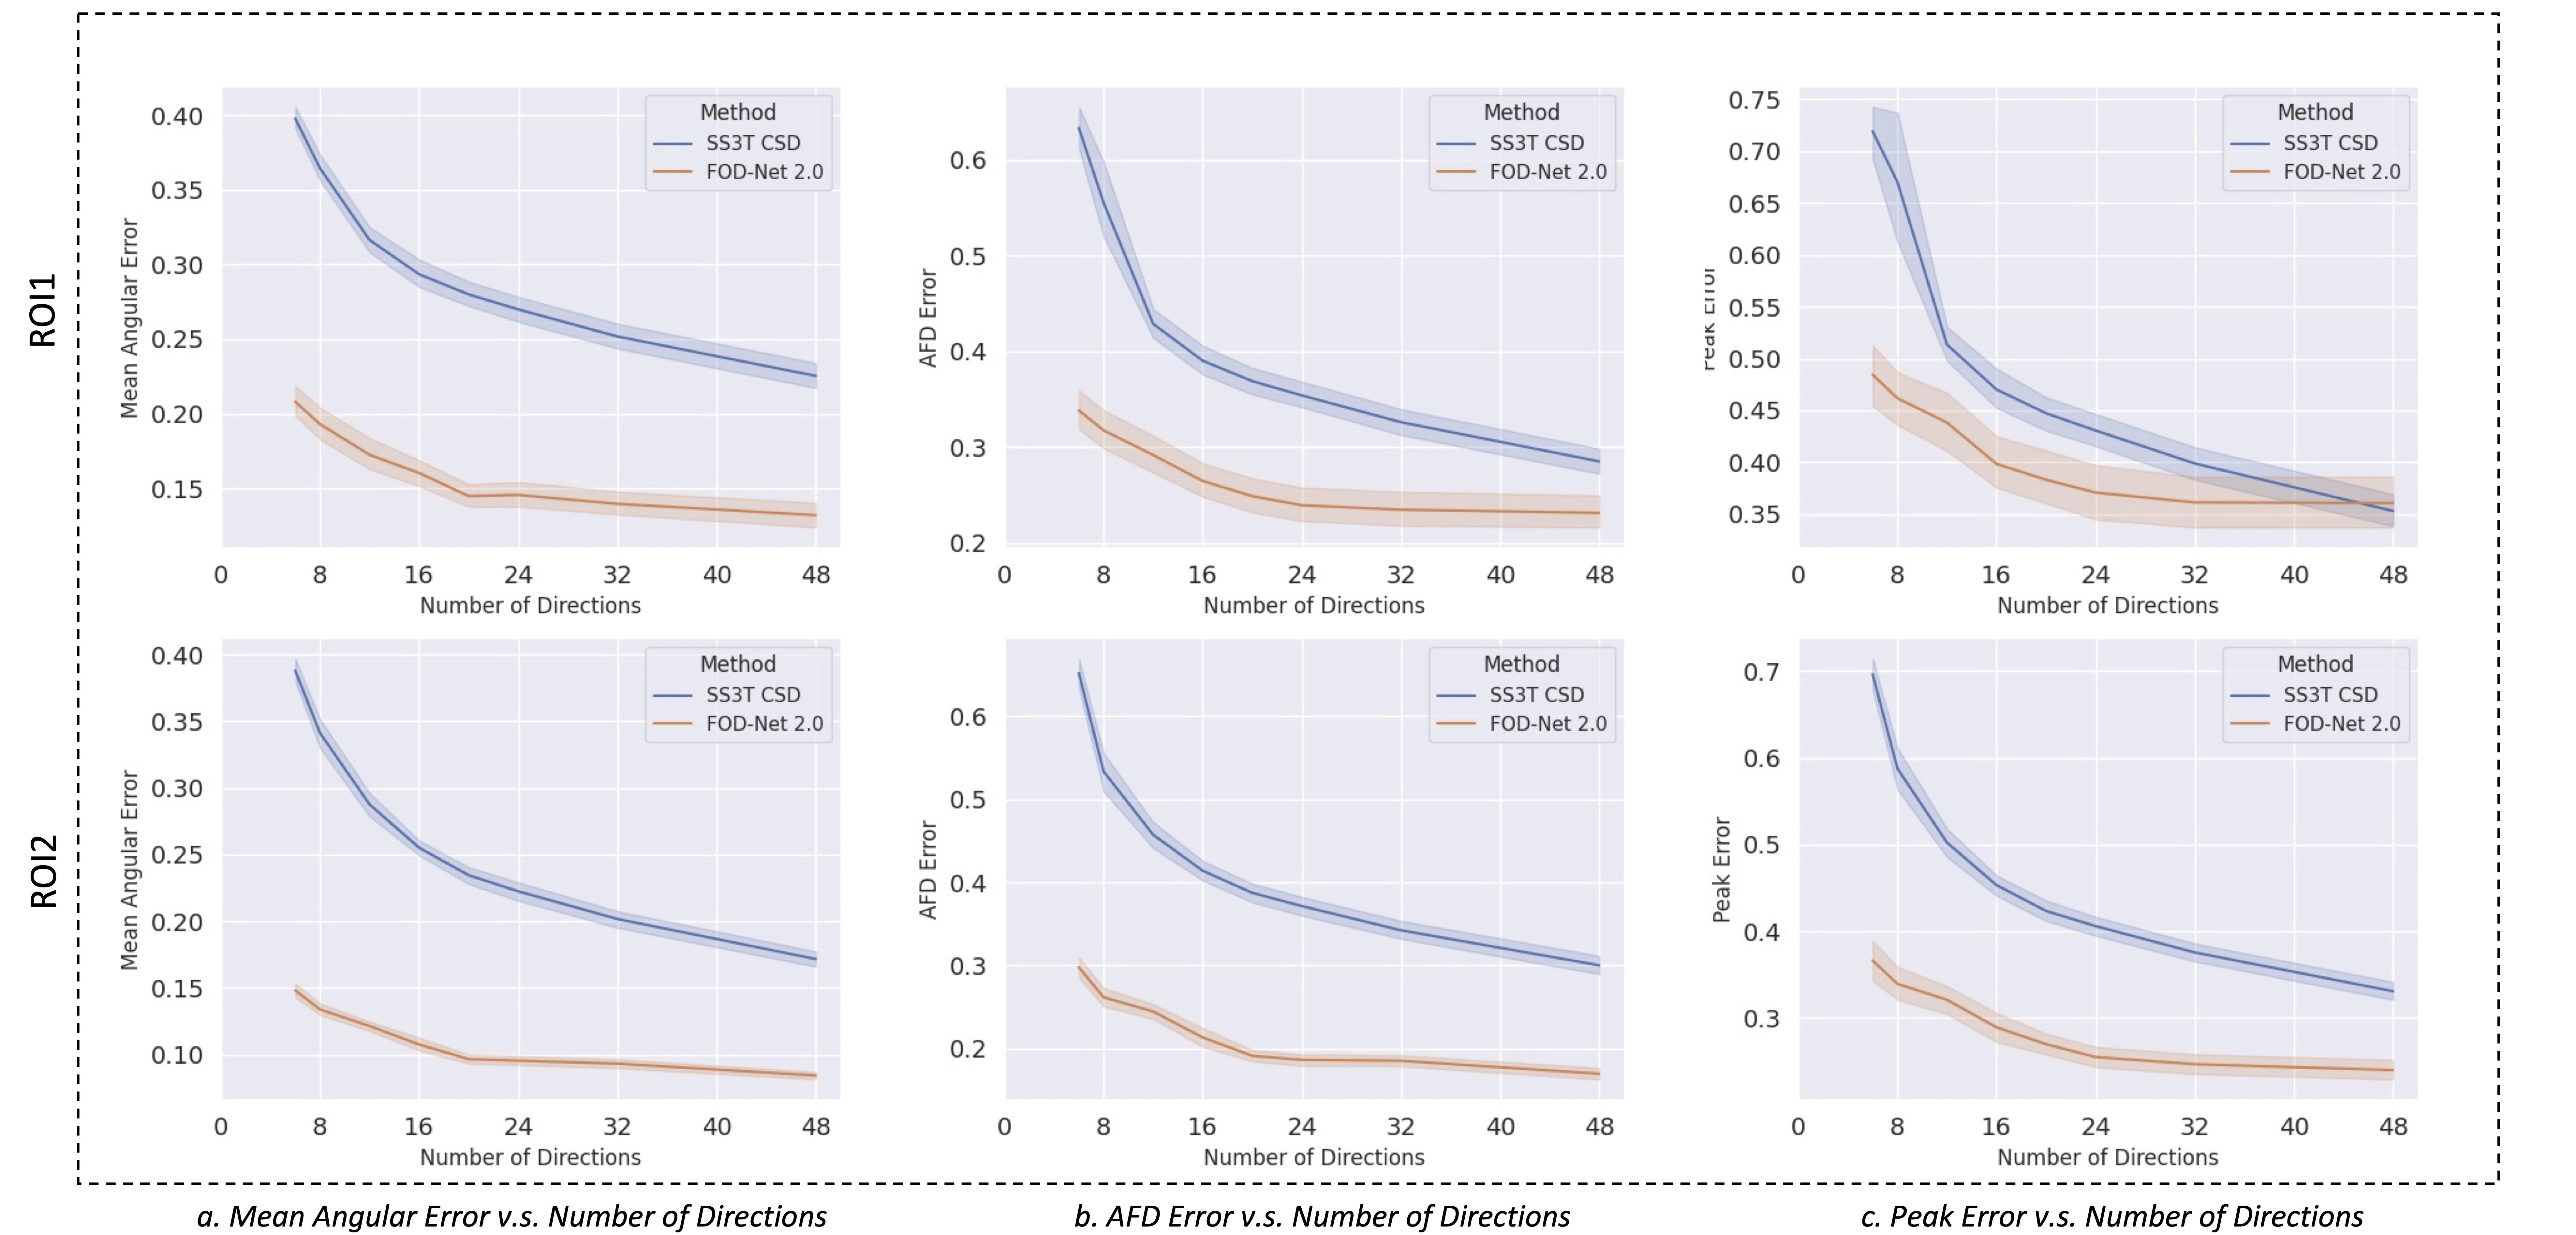
Peak Signal-to-Noise Ratio (PSNR) and the angular correlation coefficient (rAngular)13 were used to assess the quality and accuracy of the estimated FOD maps in regions with pure white matter (WM) and those with grey matter (GM) partial volumes8. The FOD-Net 2.0 framework significantly enhances the quality and accuracy of FODs for all the sampled directions (Figure 2). With 20 or more directions, it achieves a mean rAngular exceeding 0.9 in pure WM, 0.8 in juxtacortical WM (JCWM), and 0.7 at the border of WM and subcortical GM (WM-SGM), although the improvement gains become more gradual after 20s comparing to those with less than 20 directions.The enhancement quality was also evaluated using fixel-based metrics in two regions of interest (ROIs) with two and three crossing fibres respectively8,9. Notably, as the number of gradient directions reaches 20 in both ROIs, the mean angular error (μEAngular) of enhanced FODs exhibits a substantial decrease (crucial for tractography8) (Figure 3a). Nonetheless, the AFD and peaks error (EAFD, EPeak) show slower reductions, reaching a plateau after surpassing 24 gradient directions (Figure 3b,c).
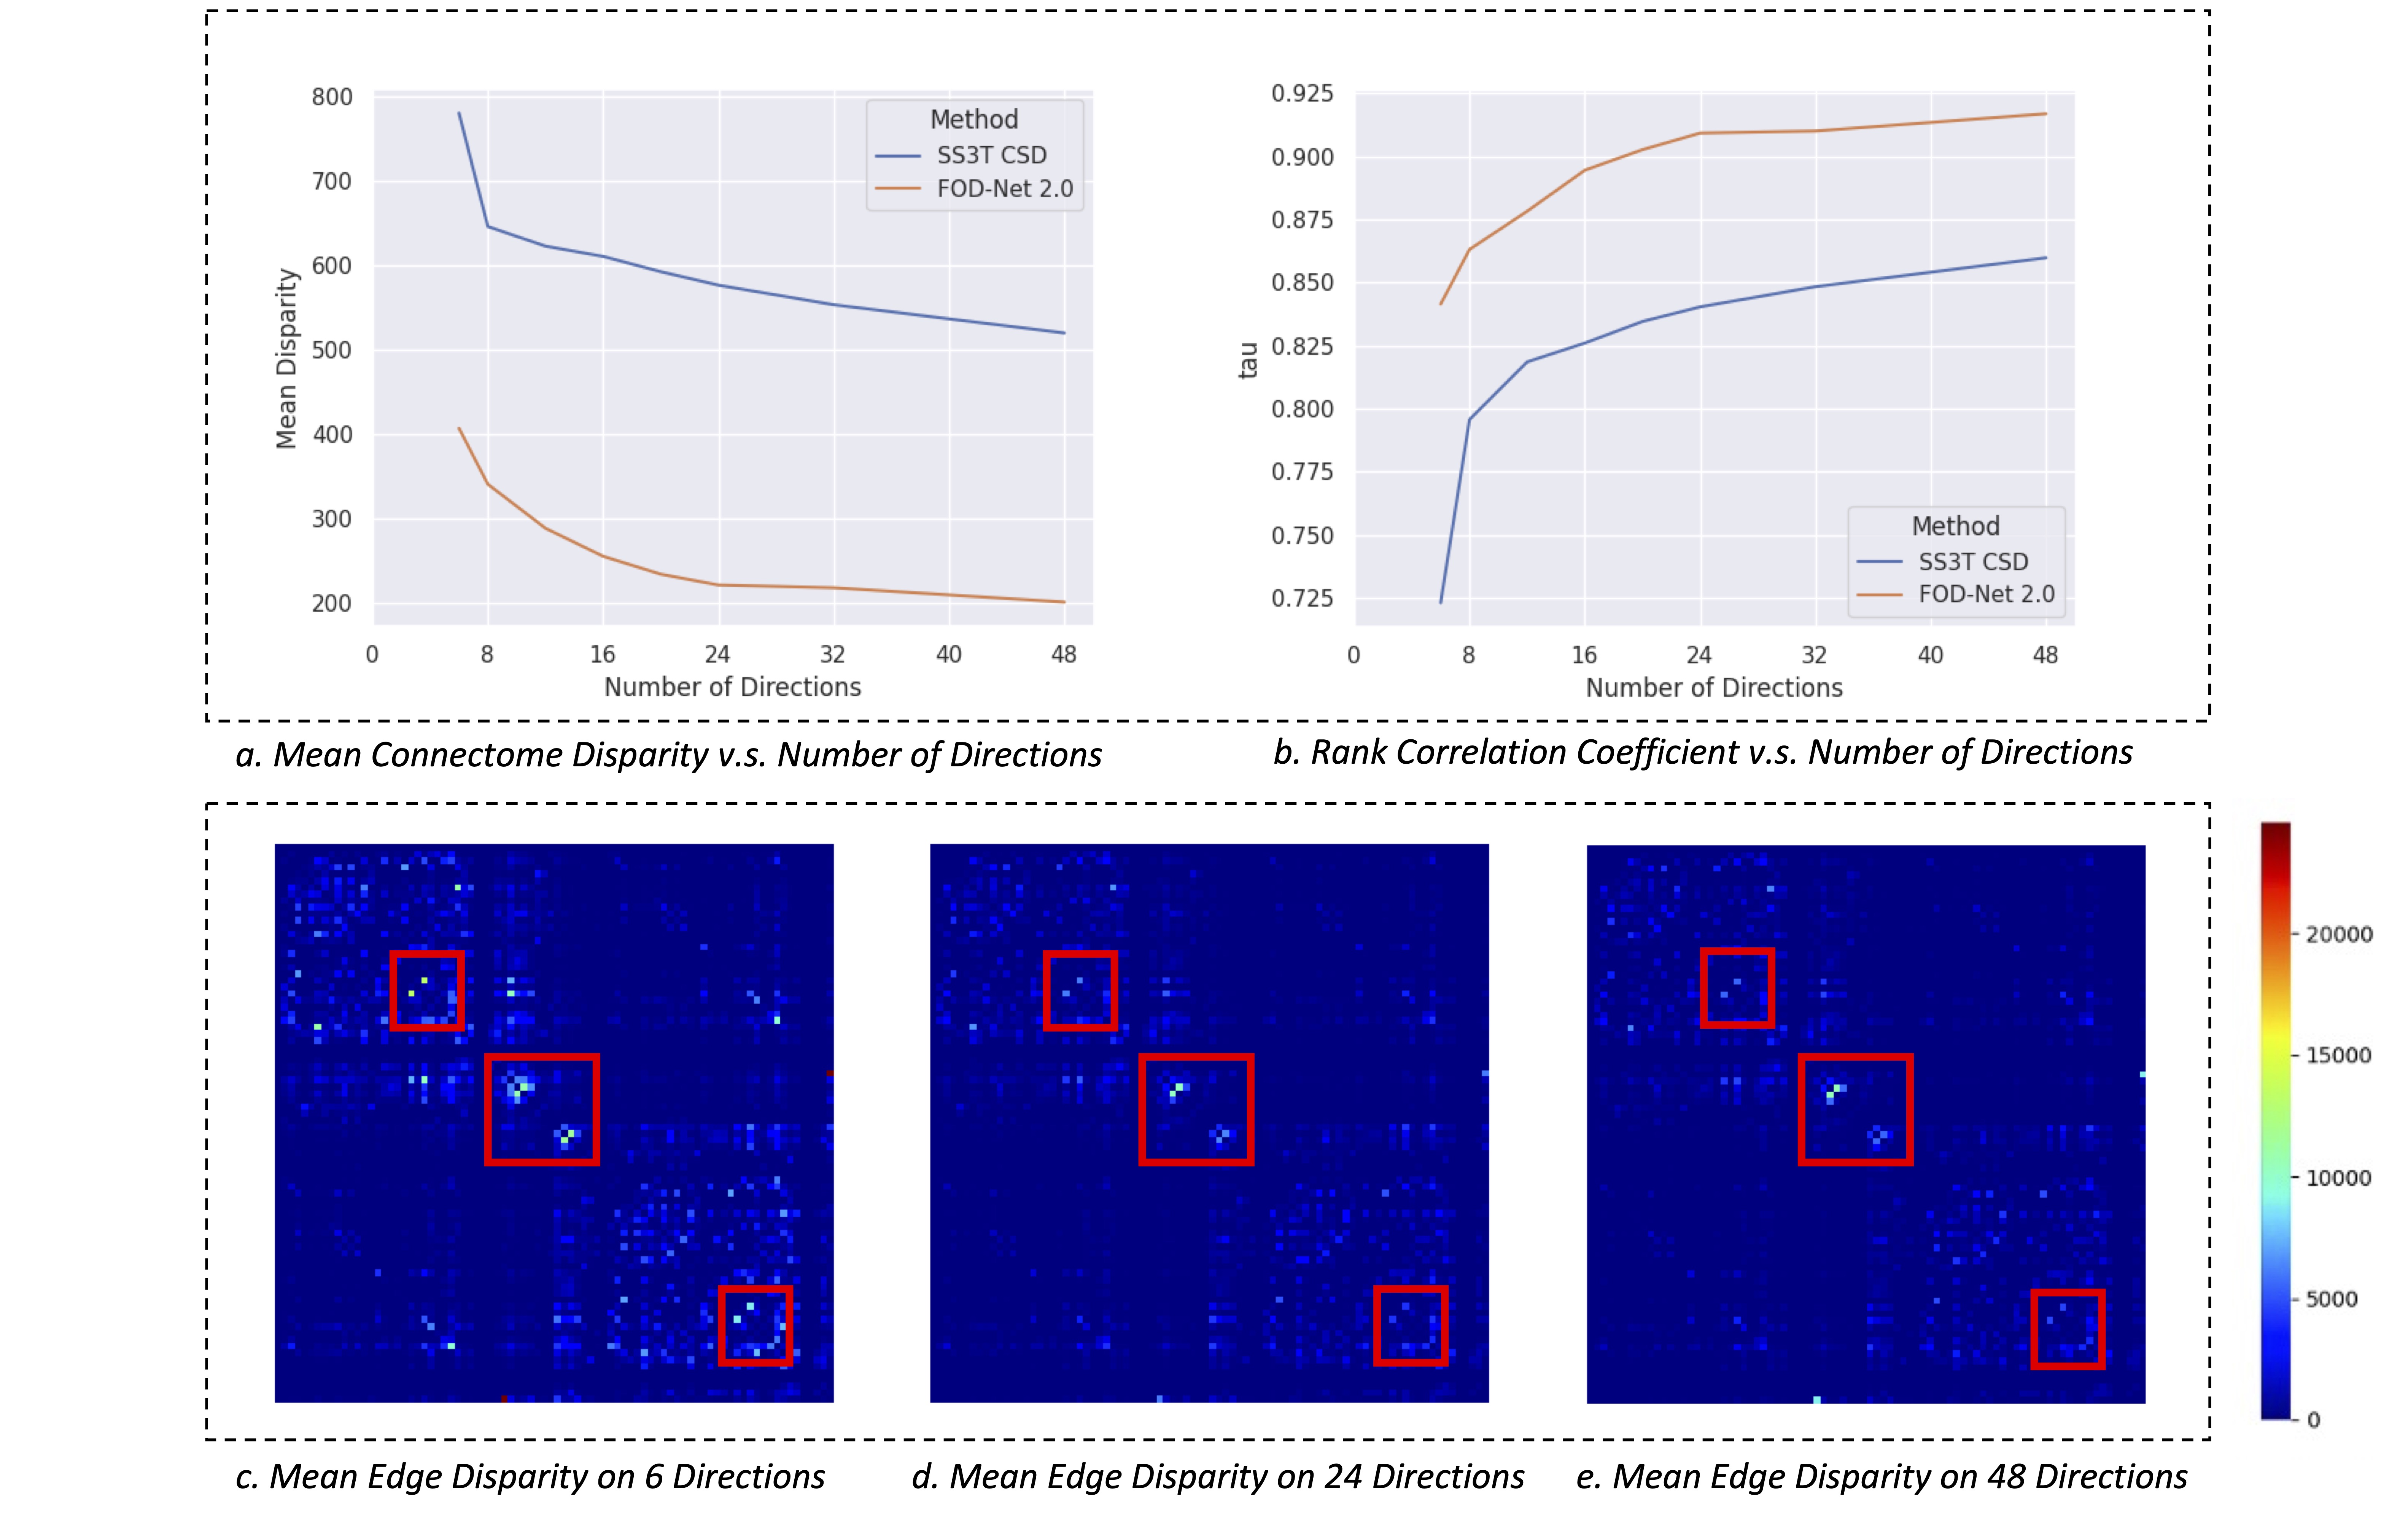
Mean disparity matrices8 were also computed to compare connectomes from all the sampled sets of directions. The Kendall's Tau rank correlation coefficient was used to measure ranking similarity of the connection strengths. When increasing the number of sampled directions, mean disparity decreases (Figure 4a, c-e) while the ranking correlation coefficient (Figure 4b) shows significant improvements, which both plateau when surpassing 24 directions, relatively.
Discussion
Across FOD, fixel-based, and connectome measurements, the learning-based enhancement framework consistently improves single-shell LARDI FODs with different number of gradients, demonstrating its effectiveness. Notably, the extent of improvement plateaus beyond approximately 24 gradient directions for FOD and its subsequent tractography and connectome reconstructions, comparing to the range of 6-24 directions making a notable improvement gain. This finding aligns with tensor modelling requisites (at least 28 for low b-values) for dMRI signal characterisation14, indicating limited information of dMRI acquisition with less than 24 directions for advanced analysis, where benefits the most with learning-based FOD enhancement framework. The outcome of our study provides a guidance in the planning of future clinical studies with clinical constrains in dMRI acquisition, and sets the enhancement expectations for enhancement of retrospectively collected datasets.Conclusions
Our results demonstrate the effectiveness of learning-based FOD enhancement across a wide range of gradient directions with clinical b1000 acquisitions, although acquiring more than 24 directions yields marginal improvements. This suggests that an optimal trade-off between performance and the number of gradient directions is achieved around 24 directions.Acknowledgements
The authors acknowledge the funding support by the Australia Medical Research Future Fund under Grant (MRFFAI000085), the National Health and Medical Research Council of Australia & The University of Sydney Equipment Grant 2018 (grant number G201307), and The University of Sydney - Fudan University BISA Flagship Research Program. The authors acknowledge the facilities and scientific and technical assistance of the National Imaging Facility, a National Collaborative Research Infrastructure Strategy (NCRIS) capability, at Sydney Imaging, the University of Sydney.References
[1] Alexander, D.C., Zikic, D., Ghosh, A., Tanno, R., Wottschel, V., Zhang, J., Kaden, E., Dyrby, T.B., Sotiropoulos, S.N., Zhang, H., et al., 2017. Image quality transfer and applications in diffusion MRI. Neuroimage 152, 283–298.
[2] Tanno, R., Worrall, D.E., Kaden, E., Ghosh, A., Grussu, F., Bizzi, A., Sotiropoulos, S.N., Criminisi, A., Alexander, D.C., 2021. Uncertainty modeling in deep learning for safer neuroimage enhancement: demonstration in diffusion MRI. Neuroimage 225, 117366.
[3] Jeurissen, B., Tournier, J.D., Dhollander, T., Connelly, A., Sijbers, J., 2014. Multi-tissue constrained spherical deconvolution for improved analysis of multi-shell diffusion MRI data. Neuroimage 103, 411–426.
[4] Tournier, J.D., Calamante, F., Connelly, A., 2007. Robust determination of the fibre orientation distribution in diffusion MRI: non-negativity constrained super-resolved spherical deconvolution. Neuroimage 35 (4), 1459–1472.
[5] Tournier, J.D., Calamante, F., Gadian, D.G., Connelly, A., 2004. Direct estimation of the fibre orientation density function from diffusion-weighted MRI data using spherical deconvolution. Neuroimage 23 (3), 1176–1185.
[6] Dell’Acqua, F., Tournier, J.D., 2019. Modeling white matter with spherical deconvolution: how and why? NMR Biomed. 32 (4), e3945.
[7] Farquharson, S., Tournier, J.D., Calamante, F., Fabinyi, G., Schneider-Kolsky, M., Jackson, G.D., Connelly, A., 2013. White matter fibre tractography: why we need to move beyond DTI. J. Neurosurg. 118 (6), 1367–1377.
[8] Zeng, R., Lv, J., Wang, H., Zhou, L., Barnett, M., Calamante, F., Wang, C., 2022. FOD-Net: A deep learning method for fibre orientation distribution angular super resolution. Medical Image Analysis, 79, p.102431.
[9] Wang, X., Tang, Z., Cabezas, M., D’Souza, A., Calamante, F., Liu, D., Barnett, M., Tu, S., Cai, W., Wang, C., 2023. FOD-Net 2.0: End-to-end FOD enhancement for low angular diffusion acquisitions using deep learning. In Annual Meeting of the International Society for Magnetic Resonance in Medicine (ISMRM).
[10] Van Essen, D.C., Smith, S.M., Barch, D.M., Behrens, T.E., Yacoub, E., Ugurbil, K., Consortium, W.M.H., et al., 2013. The WU-minn human connectome project: an overview. Neuroimage 80, 62–79.
[11] Tournier, J.D., Smith, R., Raffelt, D., Tabbara, R., Dhollander, T., Pietsch, M., Christiaens, D., Jeurissen, B., Yeh, C.H., Connelly, A., 2019. MRtrix3: a fast, flexible and open software framework for medical image processing and visualization. Neuroimage 202, 116137.
[12] Khan, W., Egorova, N., Khlif, M.S., Mito, R., Dhollander, T., Brodtmann, A., 2020. Three-tissue compositional analysis reveals in-vivo microstructural heterogeneity of white matter hyperintensities following stroke. Neuroimage 218, 116869.
[13] Anderson, A.W., 2005. Measurement of fibre orientation distributions using high angular resolution diffusion imaging. Magnetic Resonance in Medicine: An Official Journal of the International Society for Magnetic Resonance in Medicine 54, 1194–1206.
[14] Tournier, J. D., Mori, S., Leemans, A., 2011. Diffusion tensor imaging and beyond. Magnetic Resonance in Medicine, 65(6), 1532.
Figures